")
")
| Issue |
Sci. Tech. Energ. Transition
Volume 80, 2025
|
|
|---|---|---|
| Article Number | 46 | |
| Number of page(s) | 12 | |
| DOI | https://doi.org/10.2516/stet/2025026 | |
| Published online | 29 July 2025 | |
Regular Article
Natural hydrogen soil gas emissions near Harvey, Perth Basin: a comparative study of survey methods
1
Edith Cowan University, 270 Joondalup Dr, Joondalup, Western Australia 6027, Australia
2
Commonwealth Scientific and Industrial Research Organization (CSIRO), 26 Dick Perry Ave, Kensington, Western Australia 6151, Australia
3
Geological Survey of Western Australia, Mineral House, 100 Plain St, East Perth, Western Australia 6004, Australia
* Corresponding author: This email address is being protected from spambots. You need JavaScript enabled to view it.
; This email address is being protected from spambots. You need JavaScript enabled to view it.
Received:
17
January
2025
Accepted:
30
June
2025
Abstract
Quantifying natural hydrogen soil gas emissions and their controlling factors is critical for assessing hydrogen storage viability and improving exploration strategies. This study provides the first detailed comparison of hydrogen emissions near the DMP Harvey-2 well in the Perth Basin and compares the effectiveness of repeated point surveys and autonomous monitoring in capturing emission variability. Hydrogen concentrations ranged from 0 to >1000 ppm in point surveys, with transient pulses up to 598 ppm detected through continuous monitoring, indicating episodic release. Repeated point surveys successfully captured the overall range of emissions but failed to resolve dynamic processes, such as abrupt flux changes influenced by temperature, atmospheric pressure, and soil moisture. Continuous monitoring provided additional insights into these transient phenomena and the relationship between baseline emissions and geological processes. These findings help define the repeatability of point surveys and demonstrate the value of integrating continuous monitoring with single-point surveys to establish baselines and identify natural hydrogen microseepage hotspots. This integrated approach offers practical insights for hydrogen exploration and baseline monitoring, contributing to improved planning for subsurface hydrogen storage.
Key words: Natural hydrogen / Soil gas emissions / Energy transition / Hydrogen storage / Continuous monitoring / Microseepage
© The Author(s), published by EDP Sciences, 2025
 This is an Open Access article distributed under the terms of the Creative Commons Attribution License (https://creativecommons.org/licenses/by/4.0), which permits unrestricted use, distribution, and reproduction in any medium, provided the original work is properly cited.
Key points
-
Significant daily and seasonal variability in natural soil gas emissions.
-
While repeat point surveys can reveal the soil gas emission ranges, autonomous monitoring allows for more comprehensive data interpretation.
-
Natural soil gas emissions are influenced by climatic factors, with temperature, atmospheric pressure, and soil moisture playing key roles.
-
First baseline studies of H2 gas microseepage using autonomous monitoring in the Perth Basin.
1 Introduction
1.1 Soil gas emissions
Understanding the daily and seasonal emissions of subsurface gases is fundamental for hydrogen storage projects and natural hydrogen exploration. In the context of hydrogen (H2) storage, soil gas monitoring plays a critical role in ensuring safety compliance and assessing containment effectiveness [1]. Additionally, soil gas studies complement other surface monitoring techniques in addressing stakeholder concerns and enhancing project transparency [2, 3].
Natural hydrogen exploration has gained global momentum as a clean, non-carbon energy alternative. Discoveries of high hydrogen concentrations in regions such as South Australia [4] and Mali [5] have accelerated interest in this resource. Soil gas sampling has emerged as a key method for exploration, as low-concentration micro-seepage from the soil can indicate subsurface hydrogen generation [6–10].
Extensive research on CO2 soil gas emissions has highlighted significant variability driven by soil type, vegetation, and seasonal changes [11]. However, studies on natural hydrogen emissions remain nascent. Early findings reveal both temporal [9, 12, 13] and spatial variability [14, 15], including sporadic hydrogen pulses [16]. Single-point sampling surveys often produce inconsistent results and may be subject to seasonal variability [12, 13, 16–18] or artefacts caused by drilling activities [19]. Continuous monitoring, in contrast, offers a more thorough solution, capturing sporadic hydrogen pulses that point sampling may miss [13, 16, 18, 20].
We conducted a pilot study at the DMP Harvey-2 wellsite. The DMP Harvey-2 well was drilled as part of the South West Hub project, a Western Australian government initiative aimed at assessing whether the Triassic Lesueur Sandstone in the Harvey region could serve as a viable site for carbon capture and storage (CCS). As part of that effort, four wells were drilled and both 2D and 3D seismic data were acquired to better understand the geology of the area. The project wrapped up in 2018, and all associated data were made publicly available through the WAPIMS database. Importantly, Harvey-2 intersected a major fault – known as the F10 fault – which dips steeply to the west and extends deep into basement rocks. The site now serves as an in situ laboratory, where CO2 injection and monitoring technologies are being tested. The site history and geology make it a valuable site for studying natural gas emissions: it is well-documented, close to a major fault that may allow deep gases to reach the surface, and already supported by infrastructure and data.
The pilot study was designed to address two key questions: (1) What are the ranges of natural hydrogen and carbon dioxide soil gas emissions near the DMP Harvey-2 well site? (2) Can multiple single-point soil gas surveys capture emission variability as effectively as autonomous monitoring?
To answer these questions, soil gas point sampling was conducted at 91 locations over 5 separate days within the 0.3 sq km site during the autumn of 2022. Autonomous monitoring, implemented for the first time for natural hydrogen in the Perth Basin, complemented these efforts to investigate temporal variability and the relationship between baseline emissions and transient hydrogen release events.
By integrating point sampling with continuous monitoring, this study advances our understanding of natural soil gas dynamics, offering critical guidance for hydrogen storage and exploration projects. These findings contribute to the development of soil gas sampling strategies for the global energy transition.
1.2 Geology of the Perth Basin
The Perth Basin developed as a north-south oriented rift along the continent’s southwestern margin (Fig. 1). Significant structural elements include the Darling Fault marking the western boundary of the Archean Yilgarn Craton, with key depocenters located in the Dandaragan and Bunbury Troughs, and the Mandurah Terrace. The basin primarily comprises Permian and younger continental clastic sediments deposited within the Eastern Gondwana rift system. Two principal tectonic phases are identified: Permian extension and Jurassic extension that culminated in Early Cretaceous continental breakup and the formation of the Indian Ocean [21]. These phases are inferred to have involved a component of sinistral and dextral movement along the Darling Fault and other major faults. Numerous new faults formed during breakup [22] with some faults showing small offsets of the breakup unconformity and overlying Cretaceous strata on seismic data, implying minor Cenozoic reactivation.
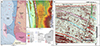 |
Fig. 1 Geological context of the study area. a) Geological map of the southwest corner of Western Australia, highlighting the study area in the red square. b) DEM map of the study area (red square on a) showing tectonic elements and seismic line in c) West-east seismic section through the DMP Harvey-2 well site, which intersected a deep fault with ~1 km of normal displacement. The fault may show further displacement of the breakup unconformity; however, this is not resolvable on current seismic. The Lower Lesueur Sandstone is being investigated as a reservoir for CO2 sequestration. |
Proterozoic igneous and metamorphic rocks of the Pinjarra Orogen form the basement to the Perth Basin, and are exposed in three inliers: the Leeuwin, Mullingarra, and Northampton Inliers [23]. These comprise gneisses and metasedimentary rocks. At the Mullingarra Inlier, the crystalline basement rocks are unconformably overlain by the Yandanooka Basin of probable Neoproterozoic age, but this pre-Perth Basin sedimentary succession is not known to extend to our south Perth Basin study area. The Perth Basin is also partly underlain by granites and metamorphic rocks (including greenstones, i.e., metamorphosed mafic volcanics) of the Yilgarn Craton on the footwall of the west-dipping Darling Fault, defining the eastern margin of the basin. Proterozoic dolerite dykes intrude both the Yilgarn Craton and Pinjarra Orogen [24].
The underlying granitic rocks of the Perth Basin provide potential for a deep-seated radiolytic natural hydrogen source, and natural hydrogen may also form in greenstone belts and Proterozoic dolerite dykes through interactions between iron-rich rocks and groundwater [25, 26].
The DMP Harvey-2 well was drilled in 2014–2015 [27] and intersected a deep west-dipping normal fault previously mapped from seismic data for the SW Hub project, coded as the “F10” fault in SW Hub literature [28]. The fault has a throw of nearly 1 km and is interpreted to reach the basement. It links to the Darling Fault south of the study area [29], close to where the Harvey River traverses the Darling Scarp. Displacement along the fault is not discernible above the breakup unconformity in publicly available seismic sections (Fig. 1), implying either complete cessation of movement prior to breakup or only minor neotectonic movement post-breakup, with any small shallower displacements not resolvable on current seismic sections. Surface expression of this fault is inconsistent and not discernible on seismic (Fig. 1c) or remote sensing; however, some sections of the Harvey River drainage system are possible surface expressions of the F10 fault (Fig. 1b). The soil gas monitoring herein was designed to test an area adjacent to the Harvey River drainage system as the possible surface expression of the F10 fault.
2 Methods
Ninety-one holes were drilled to a depth of 80 cm–1 m for point sampling across five separate days between the 31st of March 2022 and the 31st of May 2022 in a 0.3 square kilometres area near the DMP Harvey-2 well site, southwest of Perth, Western Australia (Fig. 1).
Point sampling methods have previously been described by [7, 8, 15, 17]. In this study, fresh holes were drilled for the point sampling on each of the 5 separate sampling days. H2 and CO2 concentrations were measured using both iBrid Mx6 and GA5000 handheld multi-gas meters [30, 31]. The iBrid Mx6 was calibrated 3 months before the survey, and the GA5000 was calibrated approximately 9 months before the survey.
Although the primary focus of this study was on natural hydrogen emissions, CO2 was concurrently monitored due to its established role as an indicator of soil gas dynamics and subsurface processes [32]. Monitoring CO2 provides critical baseline data that complements hydrogen measurements, offering insights into the interplay of microbial activity, soil moisture, and pressure-driven and geological fluxes [1, 12].
In addition to point sampling, an autonomous multi-gas monitoring system (Axiom: WHALI, Australia) [33] was deployed over a four-week period at two separate locations on site, named AXH2-10 and AXH2-13. At each location, a perforated PVC tube was inserted 80 cm–1 m below, the surface and a 3 mm silicone tube was inserted into the PVC tube.
The two autonomous monitoring sites, approximately 400 m apart, were both located in heavy clay soils with moderate grass coverage and located within 3–5 m of mature trees. The AXH2-10 site had heavier grass cover compared to the AXH2-13 site.
The autonomous device measured soil gas concentrations from the 4th of May to the 31st of May 2022 across the two locations (Fig. 2). H2 and H2S were measured using an electrochemical sensor, and CO2 was measured using an infrared sensor.
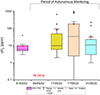 |
Fig. 2 Box plot showing the variability in cH2 concentrations across five point survey days near the DMP Harvey-2 well site in the Perth Basin, Western Australia. The box represents the interquartile range (25th–75th percentile), the line indicates the median, and individual data points are shown to display distribution spread. Measurements were obtained using the GA5000 handheld instrument, which has an upper detection limit of 1000 ppm. Values recorded as 1000 ppm represent the saturation point of the device and should be interpreted as ≥1000 ppm. |
Surface temperature and pressure data were also recorded within the monitoring unit. The unit was programmed to pump for 3.5 min every 30 min using a peristaltic pump, which averaged 300 mL/min pump volume. This allowed the evacuation of approximately 2 L/h of soil gas. The autonomous unit was calibrated immediately prior to the survey. The unit lost power after a heavy rainstorm and low light levels (required to charge the solar panel) overnight on the 18th to 19th of May 2022, and a technician attended the site and restarted the machine at 10 am on the 19th of May 2022 after approximately 12 h of lost recording time.
The measurement range and accuracy of the gas sensors in the autonomous device (WHALI) are shown in Table 1, compared to the hand-held devices used in this study. All H2 measurements presented represent temperature-corrected concentrations [34, 35].
Accuracy ranges of WHALI autonomous multi-gas meter for measured gases compared to GA5000 and iBridMX6 hand-held devices.
3 Results
3.1 Natural hydrogen emissions
The results from point sampling and autonomous monitoring revealed significant variability in natural hydrogen soil emissions. During the five-point sampling days, hydrogen concentrations (cH2) varied considerably, ranging from undetectable levels on May 4, 2022, to peak concentrations of >1,000 ppm on May 17, 2022 (Figs. 2c, 2d and 3). The point surveys were conducted on the 31st of March, 4th of May, 11th of May, 17th of May, and 31st of May 2022 and the mean hydrogen concentration observed across the sampling days were very different at (9 ppm, 0 ppm, 84 ppm, 137 ppm, and 36 ppm, respectively). Additionally, high cH2 (>500 ppm) was measured within 10 m of 0 ppm measurements (Fig. 2d), indicating high spatial variability.
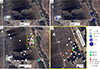 |
Fig. 3 Point sampling near the DMP Harvey-2 well site. a) Initial cCO2 measured at each location on the 4th of May, 2022. b) Final CO2 measured at each location on the 4th of May, 2022. c) cH2 results for all point sampling and autonomous monitoring locations near DMP Harvey-2 during 2022, and d) Zoom in of area in yellow square in (c) close to the Harvey River canal, interpreted surface expression of the F10 fault, both modified after Maxar Technologies, Google Earth. |
At the AXH2-10 autonomous monitoring site, cH2 was highest on the initial days, reaching a peak of 98 ppm on the 8th of May 2022, 4 days after installation. Increasing cH2 in the first four days coincided with falling atmospheric pressure and high temperatures (Figs. 4a–4d). This flux diminished to negligible levels during the period of rainfall from the 12th to the 15th of May 2022. Overall, average hydrogen measurements were low (mean 14 ppm).
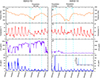 |
Fig. 4 Autonomous monitoring results at the AXH2-10 location (33°0′33″S, 115°51′5″E) from the 4th of May 2022 to the 17th of May 2022 and at the AXH2-13 location (33°0′18″S, 115°50′59″E) from the 18th of May 2022 to the 31st of May 2022 a) AXH2-10 atmospheric pressure (hPa). b) AXH2-10 temperature (°C). c) AXH2-10 carbon dioxide concentration (ppm). d) AXH2-10 hydrogen concentration (ppm – temperature corrected). e) AXH2-13 atmospheric pressure (hPa). f) AXH2-13 temperature (°C). g) AXH2-13 carbon dioxide concentration (ppm). h) AXH2-13 hydrogen concentration (ppm- temperature corrected) shown with restricted range 0–120 ppmin the main image and with full range 0–600 ppm cH2 in the inset, demonstrating the scale of the spike observed on 19th May 2022. Blue dashed lines indicate periods of precipitation measured at the Bunbury Weather Station, Western Australia. |
In contrast, AXH2-13 recorded an isolated pulse of 598 ppm on the 19th of May 2022, one day after installation and several hours after restarting the autonomous unit (Figs. 4 and 5). There were no associated spikes in CO2 concentration (cCO2), H2S concentration (cH2S), temperature, or pressure. This spike was followed by smaller pulses of 61 ppm and 35 ppm on the subsequent days (Fig. 4h), after which, cH2 became insignificant (mean 8 ppm).
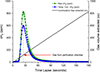 |
Fig. 5 Raw and temperature corrected hydrogen (cH2) concentration trace during the initial gas extraction at the AXH13 site near DMP Harvey-2, corresponding to the peak shown in Figure 4h and inset. The hydrogen signal increases continuously and reaches a maximum after 26 seconds of pumping (~120 cc of gas extracted), consistent with elevated concentrations sourced from the perforated chamber of the downhole probe assembly (80 cm to 1 m depth). |
Both autonomous monitoring sites measured a low level of daily flux, with the highest cH2 measurements in the middle of the day.
3.2 Carbon dioxide emissions
Point sampling and autonomous monitoring revealed considerable variability in cCO2 in soil gas. During point sampling on May 4, 2022, CO2 levels increased throughout the day, with final concentrations reaching up to 25,900 ppm at certain locations – a 550% increase compared to initial measurements (Figs. 2a and 2b).
Autonomous monitoring at AXH2-10 recorded a maximum cCO2 of 14,186 ppm, significantly higher than the peak observed at AXH2-13 (3,581 ppm). Median CO2 levels at AXH2-10 were 10,209 ppm, and a moderate negative correlation with temperature was observed during the first 4 days of monitoring. This relationship weakened in later days as CO2 concentrations became more stable.
At AXH2-13, CO2 emissions were generally lower, averaging 1,481 ppm before significant rainfall on May 23–24. Following these heavy rains, CO2 concentrations dropped to an average of 501 ppm.
cH2 and cCO2 were negatively correlated for the first 4 days of monitoring at AXH2-10, before any significant rainfall events. Following that, there was no obvious correlation between the gases.
3.3 Hydrogen sulphide (H2S)
H2S concentrations throughout the survey measured below the threshold accuracy of 0.6 ppm for the duration of the monitoring period, at both the AXH2-10 and AXH2-13 sites.
3.4 Temporal and spatial variability
Temporal and spatial variability in both H2 and CO2 emissions was pronounced. The range of H2 concentrations observed during point sampling (0 – >1,000 ppm) was comparable to that recorded via autonomous monitoring, although the latter provided higher temporal resolution and captured short-lived pulses. Spatial variability was also significant. Although AXH2-10 and AXH2-13 were only 400 m apart, their emission profiles differed markedly. AXH2-10 exhibited higher CO2 emissions, with values at times exceeding four-fold those at AXH2-13 (Figs. 6, 4c, and 4g). Similarly, H2 flux patterns varied, with pulsed emissions confined to AXH2-13. Box plot analysis revealed that the interquartile ranges (IQR) for cCO2 and cH2 concentrations did not overlap between the two sites, further highlighting spatial heterogeneity (Fig. 6).
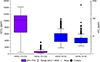 |
Fig. 6 Box plot comparing cH2 and cCO2 variability between the two autonomous monitoring sites (AXH2-10 and AXH2-13). Boxes represent the 25th–75th percentile range, with medians shown as horizontal lines. Diamond points indicate the outlying measurements. |
Atmospheric temperature and pressure were recorded at the WHALI unit (Fig. 4), while relative humidity was recorded twice daily at the Bunbury Weather Station [36]. Environmental factors at times appeared to influence the cH2 and CO2 patterns at AXH2-10 (Fig. 4). During the first 4 days, when temperatures were higher, humidity was lower, and pressure was decreasing, daily cH2 levels were elevated, whereas cCO2 levels remained low (Fig. 4). Following the precipitation event (12–15 May, 2022), characterized by increased humidity and higher soil moisture, the trends reversed, with cH2 levels decreasing and cCO2 levels rising. There was less evidence of environmental influence at AXH2-13, with the exception of the overall suppression of soil gas emissions during the heavy precipitation event from 22nd to 25th of May.
The high pulse observed during autonomous monitoring of AXH13 on the 19th of May 2022 was reviewed in further detail to determine the likely source and to rule out an electrical defect. Figure 5 shows that peak cH2 was reached after 26 s of pumping, with approximately 120 cc of gas pumped. This suggests the high hydrogen vapor concentration sourced from the perforated chamber of the downhole assembly, approximately 80 cm–1 m below ground level.
After 60 s, 284 cc was drawn, nearly double the downhole assembly volume, indicating direct extraction from the soil. cH2 remained significant (36 ppm temperature corrected). The exponential concentration decline implies a much slower hydrogen recharge rate into the soil compared to the pump rate of the autonomous unit (~300 cc per min).
4 Discussion
4.1 Key findings
This study aimed to investigate natural hydrogen soil gas emissions near the DMP Harvey-2 well site, with a focus on temporal and spatial variability, environmental controls, and the effectiveness of point sampling versus autonomous monitoring. The site investigated comprised of open pasture adjacent to the Harvey River Canal, whose course may be influenced by the underlying F10 fault. There were no sub-circular depressions (SCDs) in this study, which have been the focus of numerous previous soil gas surveys [9, 10, 14, 15]. Key findings reveal significant cH2 near the DMP Harvey-2 well (>1000 ppm), with hydrogen emissions combining baseline flux and sporadic pulses.
International case studies from Russia, Namibia, and Brazil have demonstrated that both spatial and temporal hydrogen variations can be substantial, particularly near geological features such as faults and sub-circular depressions. In Russia, hydrogen concentrations in cratonic SCDs varied from 0 to 1.25% at 1.2 m, with distinct clustering around structural features [14]. In Namibia, surveys in the Waterberg Basin showed hydrogen seepage associated with Neoproterozoic banded iron formations, with cH2 ranging from 0 to 730 ppm, localized around SCDs [9].
Autonomous surveys in Brazil have recorded diurnal hydrogen variations, with concentrations peaking at midday due to pressure-driven gas release [37]. Similar patterns have been observed on the Yilgarn Craton [16], but this study demonstrates such variations for the first time in the Perth Basin and quantifies the scale of repetition required when using point survey techniques alone.
The spatial variability in hydrogen concentrations, particularly the high cH2 values recorded near the Harvey River canal suggests that subsurface structural features may influence seepage pathways. Given that the fault intersects Proterozoic basement rocks, including granites and greenstones [38, 39] known elsewhere to generate hydrogen through radiolysis and serpentinization, it is plausible that these geological elements play a role in sourcing or facilitating hydrogen migration at the site. While detailed source attribution was beyond the scope of this study, the geological setting remains a plausible control on the observed flux patterns.
4.2 Comparison of survey methods
Both point surveys and autonomous monitoring captured the general range of H2 and CO2 emissions (Fig. 7). However, the results of point surveys showed significant variability across sampling days, ranging from 0 ppm cH2 on May 4, 2022, to >1,000 ppm on May 17, 2022. This variability highlights the need for repeat surveys to accurately characterize emission ranges [17].
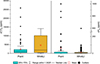 |
Fig. 7 Box plot comparing the range of cCO2 (left) and cH2 (right) concentrations captured by all five point surveys (combined) versus continuous autonomous monitoring. The box represents the interquartile range (25th–75th percentile), and individual points show outlier data variability. |
Understanding how many repeat point surveys are needed is critical for efficient natural hydrogen exploration. In this study, we found that the full range of hydrogen concentrations observed during the 31st March 2022 survey was already encompassed within the interquartile range (25–75th percentile) of the data collected between the 17th May 2022. This suggests that the 31st March survey did not contribute additional information on soil gas variability and may have been redundant. In contrast, each of the other four survey days captured unique variability not observed on other dates, indicating that they were necessary to characterize temporal fluctuations. Furthermore, the variability in point survey data was consistent with the range captured by 25 days of continuous WHALI monitoring. Based on this comparison, we propose that four well-timed point surveys were sufficient to characterize soil gas hydrogen variability at the DMP Harvey-2 site during the autumn 2022 monitoring period.
The high cH2 values (>1,000 ppm) observed on May 17, 2022, lack sufficient contextual data to conclusively differentiate between natural hydrogen pulses [37] and potential drilling-induced artifacts [6, 19]. Nevertheless, the consistency of results and proximity of these elevated cH2 values to the hydrogen pulse recorded at AXH2-13 two days later suggest a connection to natural hydrogen emissions, potentially linked to deep geological pulses [13].
Autonomous monitoring provided higher temporal resolution, enabling the confident identification of transient events [17]. For instance, the 598 ppm hydrogen pulse observed on May 19, 2022, was attributed to a natural hydrogen release due to its occurrence in the absence of anthropogenic activity. Transient hydrogen pulses, such as this, likely represent dynamic migration processes from the deep subsurface, facilitated by geological structures like the F10 fault [6, 9].
Autonomous monitoring facilitated the direct comparison of H2 emissions with other gases, revealing important relationships. For instance, CO2 and H2 emissions showed no significant correlation during the monitoring period, except for the first four days at AXH2-10, where they were negatively correlated. Similarly, the identified cH2 spikes lacked concurrent spikes in CO2 or H2S concentrations [17], suggesting distinct generation mechanisms. While identifying the source of natural hydrogen was outside the scope of this study, the lack of co-occurrence of these gases indicates that bacterial processes are unlikely to be the primary source of the observed natural hydrogen emissions. Such nuanced insights into gas dynamics were not possible through point sampling alone.
Repeated point sampling is an effective method for establishing broad soil gas emission baselines [17]. However, this study highlights the necessity of conducting multiple surveys to capture temporal variability. In this case, four surveys were required to completely capture the data range recorded by the autonomous monitors over a 25-day period. Integrating point surveys with autonomous monitoring enhances temporal data resolution, offering a more comprehensive understanding of emission dynamics and their potential geological and environmental drivers.
4.3 Environmental influences on soil gas emissions
Environmental conditions, including temperature, atmospheric pressure, and soil moisture, influenced both the cH2 and cCO2 emissions.
Soil type is known to impact CO2 flux [40], and thus may also impact cH2 flux. However, both the AXH2-10 and AXH2-13 monitoring sites appeared to have very similar soil types, being damp grey clays.
While temperature and cH2 here appeared to correlate, statistical analysis revealed a weak correlation (r 2 = 0.13), indicating that temperature alone is insufficient to explain hydrogen flux variability (Fig. 8). At AXH2-10, peak H2 concentrations occurred on cooler mornings, suggesting that additional factors, such as pressure or soil moisture, play a role in modulating emissions. These findings are consistent with previous studies that demonstrated that temperature fluctuations at depths of 80–100 cm are largely seasonal rather than diurnal [41, 42].
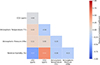 |
Fig. 8 Lower-triangle heatmap of Pearson correlation coefficients among cH2, CO2, atmospheric temperature, atmospheric pressure, and relative humidity, combining data from the AXH2-10 and AXH2-13 monitoring sites. Notably, cH2 and CO2 exhibit opposite correlations with relative humidity, highlighting distinct environmental controls on gas flux. Values below sensor resolution were excluded from the analysis. |
Soil moisture, inferred from relative humidity and precipitation data, is a strong determinant of soil gas flux dynamics [11, 12, 18]. During the initial dry period at AXH2-10, low relative humidity correlated strongly with elevated cH2 emissions. For example, hydrogen flux was highest when relative humidity was below 65%, but as relative humidity increased to 74% by the 8th of May, 2022, emissions sharply declined (Figs. 4a and 4d). Similarly, at AXH2-13, consistently high relative humidity throughout the monitoring period (mean 79%) indicates high soil moisture, which likely suppressed both H2 and CO2 emissions by limiting soil gas diffusion [40, 43, 44]. An exception to this suppression was the isolated 598 ppm hydrogen pulse observed on the 19th of May, 2022. These results align with previous research showing the inhibitory effects of soil moisture on gas diffusion and hydrogen flux variability in shallow soils [45].
Atmospheric pressure fluctuations were weakly linked to cH2 overall (r 2 = 0.11), however, the broad relationship cannot capture the daily scale pressure pumping [46]. Falling atmospheric pressure during the day facilitated increased H2 gas flux, while rising nighttime pressure inhibited emissions [43]. The diurnal variability in hydrogen emissions observed at both monitoring sites in this study (Figs. 4d and 4h) aligns with the findings of Moretti et al. [32] in Namibia, where similar daily flux patterns were noted in sub-circular depressions. Both studies observed maximum hydrogen flux during midday, suggesting a consistent relationship between temperature-driven pressure changes and hydrogen release across diverse geological settings. These parallels emphasize the relevance of environmental controls on hydrogen flux and the importance of integrating high-frequency, continuous monitoring to capture temporal dynamics accurately [37]. Modelled mechanisms for pressure-driven gas release in shallow soils further support this observation, highlighting how pressure dynamics can amplify hydrogen seepage [47, 48].
The elevated cCO2 concentrations observed at AXH2-10 are unlikely to be driven by vegetation, as the probe depth (80–100 cm) extends well below the active root zone of perennial grasses, typically limited to the top 30 cm of soil [49]. While AXH2-10 had denser grass cover than AXH2-13, the latter was located nearer to a stand of mature trees. Given the similar clay-rich soil composition at both sites and the limited root biomass at the sampling depth, differences in vegetation or soil type are insufficient to explain the CO2 variability. It is more likely that the higher cCO2 at AXH2-10 reflects site-specific subsurface processes such as microbial respiration, variations in soil gas diffusivity, or other short-term environmental influences on CO2 generation.
Temperature, soil moisture, and atmospheric pressure all contribute to the low-level diurnal gas variability. Although no single factor explains the gas concentrations, their combined effects offer insights into natural hydrogen microseepage. Simultaneous monitoring of multiple environmental variables enhances the ability to characterize microseepage dynamics and informs the design of more targeted exploration campaigns and baseline surveys [9, 12].
4.4 Implications for subsurface storage and natural hydrogen exploration
Geological hydrogen storage is increasingly viewed as a cornerstone technology in the shift toward low-carbon energy systems [50], but ensuring its safety and efficiency requires extensive monitoring to manage leakage risks and environmental impacts [51, 52]. Baseline soil gas surveys are critical for distinguishing natural hydrogen seepage from storage-induced leaks, offering spatial and temporal context essential for accurate risk assessments and monitoring system design. Hydrogen’s high mobility and low solubility make it susceptible to dispersion and interaction with shallow subsurface environments, emphasizing the need for geochemical monitoring. Measuring hydrogen alongside associated gases such as CH4, CO2, and H2S provides a more complete approach to understanding subsurface hydrogen behavior, including transformations driven by microbial or abiotic processes [50].
This study contributes to the body of knowledge by demonstrating the variability in soil gas cH2 in the Perth Basin near DMP Harvey-2 and the inadequacy of single-point surveys to establish emission baselines. Here, four surveys within one season captured the full range of soil gas emissions, while continuous monitoring provided high-resolution temporal data essential for characterizing dynamic soil gas processes.
Soil gas sampling remains a low-cost, efficient method for detecting microseepage for natural hydrogen exploration. Anthropogenic artifacts complicate the interpretation of natural hydrogen versus human-induced sources in hydrogen microseepage [19]. Developing a statistical understanding of the number and duration of surveys for statistical significance will improve survey efficiency. By integrating geological field data, this study advances the exploration of natural hydrogen and supports its development as a sustainable energy resource.
4.5 Limitations and recommendations for future work
The primary limitation of this study was its restricted timeframe, as it was conducted over a single season (Autumn 2022). Seasonal variability in hydrogen micro-seepage patterns, driven by fluctuations in temperature, soil moisture, and atmospheric pressure, was not captured. This temporal constraint limits the broader applicability of the findings. To address this, future surveys should incorporate either four discrete point measurements or at least 4 weeks of autonomous monitoring, per season. Such extended temporal coverage will facilitate the development of reliable year-round spatial and temporal baselines and enable the identification of potential micro-seepage hotspots, as suggested by previous studies [9, 12].
Moreover, incorporating direct soil moisture measurements and continuous humidity monitoring in future studies is essential to enhance a deeper understanding of hydrogen soil gas diffusion dynamics. These additional data layers will provide a more comprehensive framework for interpreting micro-seepage behavior and refining predictive models. By addressing these limitations, subsequent research can significantly advance the reliability and applicability of hydrogen seepage assessments.
5 Conclusions
At the DMP Harvey-2 site, we evaluated temporal and spatial variability in hydrogen soil gas emissions and assessed the relative performance of point-based and autonomous monitoring approaches under field conditions. Hydrogen emissions exhibited significant variability, with a combination of baseline flux and sporadic pulses linked to environmental and geological factors. A high hydrogen spike at AXH2-13 highlighted episodic geological pulsing, suggesting dynamic release mechanisms and possible migration pathways associated with the nearby F10 fault.
While multiple single-point surveys were effective in capturing the range of emissions, they were unable to resolve abrupt flux changes influenced by environmental drivers. Autonomous monitoring provided a more detailed understanding of dynamic processes, offering high-resolution data that revealed previously unobserved transient hydrogen pulses. Integrating both approaches enabled the establishment of thorough emission baselines and a more extensive evaluation of hydrogen microseepage patterns.
These findings contribute to advancing hydrogen exploration strategies and provide a scalable methodology for improving soil gas monitoring across diverse geological settings. The integration of autonomous monitoring with traditional surveys enhances the detection of hydrogen migration pathways and identifies natural seepage hotspots with greater accuracy. Such approaches are critical for ensuring the safety and effectiveness of hydrogen storage and exploration projects, aligning with global efforts to develop hydrogen as a cornerstone of the clean energy transition.
By applying these methods in other geological contexts, the hydrogen energy sector can improve exploration efficiency, better mitigate risks, and accelerate progress toward a sustainable, low-carbon future.
Acknowledgments
The WHALI autonomous monitoring unit was developed by Axiom Sensing Pty Ltd. The authors are grateful to Saxon Druce for his assistance in the field. P.H., C.T., and L.N. publish with the permission of the Executive Director of the Geological Survey of Western Australia.
Funding
This project was funded by the Geological Survey of Western Australia’s Exploration Incentive Scheme (EIS). K.D. is financially supported by the CSIRO iPhD Program in collaboration with Gold Hydrogen Ltd and Gehyra Energy Pty Ltd. The sponsors played no role in the design, analysis, or reporting of this study.
Data availability statement
All raw and processed seismic datasets, drillhole datasets, and acquisition, processing, and interpretation reports, are publicly available via WAPIMS (the Western Australian Petroleum and Geothermal Information Management System), which is the State government’s online public repository for all energy exploration-related geophysical and drillhole data acquired by either government or industry within the State: https://wapims.dmp.wa.gov.au/WAPIMS/
The point survey and autonomous soil gas monitoring can be accessed via the Zenodo repository https://zenodo.org/records/13368412.
Author contribution statement
All authors have read and agreed to the published version of the manuscript.
P.H., C.T., and L.N were responsible for the conceptualisation, project design, funding acquisition and point sampling fieldwork. K.D. was responsible for the WHALI fieldwork, data conditioning, visualization, and writing of the original draft. All contributed to the reviewing and editing of this manuscript.
References
- Schacht U, Jenkins C (2014) Soil gas monitoring of the Otway Project demonstration site in SE Victoria, Australia, Int. J. Greenh Gas Control 24, 14–29. https://doi.org/10.1016/j.ijggc.2014.02.007. [Google Scholar]
- Shin WJ, Ryu JS, Choi HB, Yun ST, Lee KS (2020) Monitoring the movement of artificially injected CO2 at a shallow experimental site in Korea using carbon isotopes, J. Environ. Manage. 258, 110030. https://doi.org/10.1016/j.jenvman.2019.110030. [Google Scholar]
- Beaubien S, Ruggiero L, Annunziatellis A, Bigi S, Ciotoli G, Deiana P, Graziani S, Lombardi S, Tartarello Maria C (2014) The importance of baseline surveys of near-surface gas geochemistry for CCS monitoring, as shown from onshore case studies in Northern and Southern Europe, Oil Gas Sci. Technol. 70, 4, 615–633. https://doi.org/10.2516/ogst/2014009. [Google Scholar]
- Gold H (2023) Ramsay 2 Update., in Very high hydrogen concentrations up to 86% purity found along with the very high helium concentrations Australian stock exchange. Available at https://cdn-api.markitdigital.com/apiman-gateway/ASX/asx-research/1.0/file/2924-02755706-2A1495322. [Google Scholar]
- Prinzhofer A, Tahara Cissé CS, Diallo AB (2018) Discovery of a large accumulation of natural hydrogen in Bourakebougou (Mali), Int. J. Hydrogen Energy 43, 42, 19315–19326. https://doi.org/10.1016/j.ijhydene.2018.08.193. [CrossRef] [Google Scholar]
- Prinzhofer A, Rigollet C, Lefeuvre N, Françolin J, Valadão de Miranda PE (2024) Maricá (Brazil), the new natural hydrogen play which changes the paradigm of hydrogen exploration, Int. J. Hydrogen Energy 62, 91–98. https://doi.org/10.1016/j.ijhydene.2024.02.263. [Google Scholar]
- Frery E, Langhi L, Maison M, Moretti I (2021) Natural hydrogen seeps identified in the North Perth Basin, Western Australia, Int. J. Hydrogen Energy 46, 61, 31158–31173. https://doi.org/10.1016/j.ijhydene.2021.07.023. [Google Scholar]
- Mainson M., Heath C., Pejcic B., Frery E. (2022) Sensing hydrogen seeps in the subsurface for natural hydrogen exploration, Appl. Sci. 12, 13, 6383. https://doi.org/10.3390/app12136383. [CrossRef] [Google Scholar]
- Roche V., Geymond U., Boka-Mene M., Delcourt N., Portier E., Revillon S., Moretti I. (2024) A new continental hydrogen play in Damara Belt (Namibia), Sci. Rep. 14, 1, 11655. https://doi.org/10.1038/s41598-024-62538-6. [CrossRef] [Google Scholar]
- Aimar L, Frery E, Strand J, Heath C, Khan S, Moretti I, Ong C (2023) Natural hydrogen seeps or salt lakes: how to make a difference? Grass Patch example, Western Australia, Front. Earth Sci. 11, 14. https://doi.org/10.3389/feart.2023.1236673. [CrossRef] [Google Scholar]
- Carman CH, Locke Ii R.A., Blakley C.S. (2014) Update on soil CO2 flux monitoring at the Illinois Basin–Decatur Project, USA. Energy Procedia 63, 3869–3880. https://doi.org/10.1016/j.egypro.2014.11.417. [Google Scholar]
- Prinzhofer A, Moretti I, Francolin J, Pacheco C, D’Agostino A, Werly J, Rupin F (2019) Natural hydrogen continuous emission from sedimentary basins: the example of a Brazilian H2-emitting structure, Int. J. Hydrogen Energy 44, 5676–5685. https://doi.org/10.1016/j.ijhydene.2019.01.119. [Google Scholar]
- Moretti I, Prinzhofer A, Françolin J, Pacheco C, Rosanne M, Rupin F, Mertens J (2021) Long-term monitoring of natural hydrogen superficial emissions in a brazilian cratonic environment. Sporadic large pulses versus daily periodic emissions, Int. J. Hydrogen Energy 46, 5, 3615–3628. https://doi.org/10.1016/j.ijhydene.2020.11.026. [Google Scholar]
- Larin N, Zgonnik V, Rodina S, Deville E, Prinzhofer A, Larin VN (2015) Natural molecular hydrogen seepage associated with surficial, rounded depressions on the European Craton in Russia. Nat. Resour. Res. 24, 3, 369–383. https://doi.org/10.1007/s11053-014-9257-5. [CrossRef] [Google Scholar]
- Zgonnik V, Beaumont V, Deville E, Larin N, Pillot D, Farrell KM (2015) Evidence for natural molecular hydrogen seepage associated with Carolina bays (surficial, ovoid depressions on the Atlantic Coastal Plain, Province of the USA). Prog. Earth Planet. Sci. 2, 1, 31. https://doi.org/10.1186/s40645-015-0062-5. [CrossRef] [Google Scholar]
- Davies K., Frery E., Giwelli A., Esteban L., Keshavarz A., Iglauer S. (2024) A natural hydrogen seep in Western Australia: observed characteristics and controls, Sci. Tech. Energ. Transition 79, 48. https://doi.org/10.2516/stet/2024043. [Google Scholar]
- Lévy D., Roche V., Pasquet G., Combaudon V., Geymond U., Loiseau K., Moretti I. (2023) Natural H2 exploration: tools and workflows to characterize a play, Sci. Tech. Energ. Transition 78, 27. https://doi.org/10.2516/stet/2023021. [CrossRef] [Google Scholar]
- Davies K, Esteban L, Keshavarz A, Iglaeur S (2024) Advancing natural hydrogen exploration: headspace gas analysis in water-logged environments, Energy Fuels 38, 2010–2017. https://doi.org/10.1021/acs.energyfuels.3c04562. [Google Scholar]
- Halas P, Dupuy A, Franceschi M, Bordmann V, Fleury J-M, Duclerc D (2021) Hydrogen gas in circular depressions in South Gironde, France: Flux, stock, or artefact? Appl. Geochem. 127, 104928. https://doi.org/10.1016/j.apgeochem.2021.104928. [CrossRef] [Google Scholar]
- Schloemer S, Furche M, Dumke I, Poggenburg J, Bahr A, Seeger C, Vidal A, Faber E (2013) A review of continuous soil gas monitoring related to CCS – Technical advances and lessons learned, Appl. Geochem. 30, 148–160. https://doi.org/10.1016/j.apgeochem.2012.08.002. [Google Scholar]
- Olierook HKH, Timms NE, Wellmann JF, Corbel S, Wilkes PG (2015) 3D structural and stratigraphic model of the Perth Basin, Western Australia: Implications for sub-basin evolution, Aust. J. Earth Sci. 62, 4, 447–467. https://doi.org/10.1080/08120099.2015.1054882. [Google Scholar]
- Norvick MS (2003) Tectonic and stratigraphic history of the Perth Basin, Geoscience Australia, Canberra. [Google Scholar]
- Markwitz V, Kirkland CL, Evans NJ (2017) Early Cambrian metamorphic zircon in the northern Pinjarra Orogen: implications for the structure of the West Australian Craton margin, Lithosphere 9, 3–13. https://doi.org/10.1130/L569.1. [Google Scholar]
- Hartnady MIH, Kirkand CL, Smithies RH, Poujol M, Clark C (2019) Periodic Paleoproterozoic calc-alkaline magmatism at the south eastern margin of the Yilgarn Craton; implications for Nuna configuration, Precambrian Res. 332, 105400. https://doi.org/10.1016/j.precamres.2019.105400. [Google Scholar]
- Wang L, Jin Z, Chen X, Su Y, Huang X (2023) The origin and occurrence of natural hydrogen, Energies 16, 2400. https://doi.org/10.3390/en16052400. [Google Scholar]
- Boreham CJ, Edwards DS, Czado K, Rollet N, Wang L, van der Wielen S, Champion D, Blewett R, Feitz A, Henson PA (2021) Hydrogen in Australian natural gas: occurrences, sources and resources, APPEA J. 61, 1, 163–191. https://doi.org/10.1071/AJ20044. [CrossRef] [Google Scholar]
- Stalker L, Whittaker S (2017) South West Hub CCS project: evolution of storage site characterization through targeted research and its impact on uncertainty reduction, Energy Procedia 114, 5981–5993. https://doi.org/10.1016/j.egypro.2017.03.1733. [Google Scholar]
- Byrne C (2016) Seismic interpretation of the Harvey Area, O.R. Consultants, WAPIMS. . 78 p. Available at https://wapims.dmp.wa.gov.au/WAPIMS/Search/WellDetails?id=W005822#. [Google Scholar]
- Thomas C. (2018) Regional seismic interpretation and structure of the southern Perth Basin, Western Australia (Report 184), Geological Survey of Western Australia: DEMIRs eBookshop. Available at https://dmpbookshop.eruditetechnologies.com.au/product/regional-seismic-interpretation-and-structure-of-the-southern-perth-basin.do. [Google Scholar]
- Air-Met Scientific Pty Ltd (2012) GA5000 portable gas analyser. Landfill & contaminated land specification sheet. Geotech, Warwickshire, UK. Available at https://www.airmet.com.au/assets/documents/product/301/GA5000-Datasheet.pdf. [Google Scholar]
- Industrial Scientific (2021) Gas detection and monitoring solutions iBrid MX6 product specifications, in summary spec sheet, I. Available at https://fs.hubspotusercontent00.net/hubfs/4113657/_ISC2021/Supporting%20Documents/MXiBRID/MX6iBrid_SpecSheet_EN.pdf. [Google Scholar]
- Garcia-Anton E, Cuezva S, Fernandez-Cortes A, Benavente D, Sanchez-Moral S (2014) Main drivers of diffusive and advective processes of CO2-gas exchange between a shallow vadose zone and the atmosphere, Int. J. Greenhouse Gas Control 21, 113–129. https://doi.org/10.1016/j.ijggc.2013.12.006. [Google Scholar]
- Axiom Sensing (2024) Axiom sensing services. Available at https://www.axiomsensing.com/services-4. [Google Scholar]
- Korotcenkov G, Han SD, Stetter JR (2009) Review of electrochemical hydrogen sensors, Chem. Rev. 109, 3, 1402–1433. https://doi.org/10.1021/cr800339k. [Google Scholar]
- Wang C, Yang J, Li J, Luo C, Xu X, Qian F (2023) Solid-state electrochemical hydrogen sensors: a review, Int. J. Hydrogen Energy 48, 80, 31377–31391. https://doi.org/10.1016/j.ijhydene.2023.04.167. [Google Scholar]
- Bureau of Meteorology, Australia Government (2022) Bunbury, Western Australia May 2022 daily weather observations. Available at http://www.bom.gov.au/climate/dwo/IDCJDW6017.latest.shtml. [Google Scholar]
- Moretti I, Geymond U, Pasquet G, Aimar L, Rabaute A (2022) Natural hydrogen emanations in Namibia: Field acquisition and vegetation indexes from multispectral satellite image analysis, Int. J. Hydrogen Energy 47, 84, 35588–35607. https://doi.org/10.1016/j.ijhydene.2022.08.135. [Google Scholar]
- Hutchinson IP, Jackson O, Stocks AE, Barnicoat AC, Lawrence SR (2024) Greenstones as a source of hydrogen in cratonic sedimentary basins, in: Kilhams B, Holford S, Gardiner D, Gozzard S, Layfield L, McLean C, Thackrey S, Watson D (eds), The impacts of igneous systems on sedimentary basins and their energy resources, vol. 547, Geological Society of London, pp. 511–525. https://doi.org/10.1144/sp547-2023-39. [Google Scholar]
- Murray J, Clément A, Fritz B, Schmittbuhl J, Bordmann V, Fleury JM (2020) Abiotic hydrogen generation from biotite-rich granite: a case study of the Soultz-sous-Forêts geothermal site, France, Appl. Geochem. 119, 104631. https://doi.org/10.1016/j.apgeochem.2020.104631. [Google Scholar]
- Howard DM, Howard PJA (1993) Relationships between CO2 evolution, moisture content and temperature for a range of soil types, Soil Biol. Biochem. 25, 11, 1537–1546. https://doi.org/10.1016/0038-0717(93)90008-Y. [Google Scholar]
- Zeng Y, Su Z, Wan L, Wen J (2011) A simulation analysis of the advective effect on evaporation using a two-phase heat and mass flow model, Water Resour. Res. 47, 10, W10529. https://doi.org/10.1029/2011WR010701. [Google Scholar]
- Cheng Q, Zhang M, Jin H, Ren Y (2022) Spatiotemporal variation characteristics of hourly soil temperature in different layers in the low-latitude plateau of China, Front. Environ. Sci. 10, 1091985. https://doi.org/10.3389/fenvs.2022.1091985. [CrossRef] [Google Scholar]
- Massman WJ, Frank JM (2022) Modeling gas flow velocities in soils induced by variations in surface pressure, heat, and moisture dynamics, J. Adv. Model. Earth Syst. 14, 10, e2022MS003086. https://doi.org/10.1029/2022MS003086. [CrossRef] [Google Scholar]
- Fairbairn L, Rezanezhad F, Gharasoo M, Parsons CT, Macrae ML, Slowinski S, Van Cappellen P (2023) Relationship between soil CO2 fluxes and soil moisture: anaerobic sources explain fluxes at high water content, Geoderma 434, 116493. https://doi.org/10.1016/j.geoderma.2023.116493. [Google Scholar]
- Currie JA (1983) Gas diffusion through soil crumbs: the effects of wetting and swelling, Eur. J. Soil Sci. 34, 217–232. [Google Scholar]
- Laemmel T, Mohr M, Schack-Kirchner H, Schindler D, Maier M (2019) 1D air pressure fluctuations cannot fully explain the natural pressure‐pumping effect on soil gas transport, Soil Sci. Soc. Am. J. 83, 1044–1053. https://doi.org/10.2136/sssaj2018.09.0379. [Google Scholar]
- Laemmel T, Mohr M, Longdoz B, Schack-Kirchner H, Lang F, Schindler D, Maier M (2019) From above the forest into the soil – how wind affects soil gas transport through air pressure fluctuations, Agric. For. Meteorol. 265, 424–434. https://doi.org/10.1016/j.agrformet.2018.11.007. [CrossRef] [Google Scholar]
- Cathles L, Prinzhofer A (2020) What pulsating H2 emissions suggest about the H2 resource in the Sao Francisco Basin of Brazil, Geosciences 10, 149. https://doi.org/10.3390/geosciences10040149. [CrossRef] [Google Scholar]
- Lodge GM, Murphy SR (2006) Root depth of native and sown perennial grass-based pastures, North-West Slopes, New South Wales. 1. Estimates from cores and effects of grazing treatments, Aust. J. Exp. Agric. 46, 3, 337–345. https://doi.org/10.1071/EA04276. [Google Scholar]
- McMahon CJ, Roberts JJ, Johnson G, Edlmann K, Flude S, Shipton ZK (2023) Natural hydrogen seeps as analogues to inform monitoring of engineered geological hydrogen storage, in: Miocic JM, Heinemann N, Alcalde J, Edlmann K, Schultz RA (eds), Enabling secure subsurface storage in future energy systems, vol. 528, Geological Society of London, pp. 461–489. https://doi.org/10.1144/sp528-2022-59. [Google Scholar]
- Lacroix E, Lafortune S, de Donato P, Gombert P, Pokryszka Z, Adelise F, Caumon MC, Barrès O, Rupasinghe SKLS (2020) Development of monitoring tools in soil and aquifer for underground H2 storages and assessment of environmental impacts through an in-situ leakage simulation, in: 22nd EGU General Assembly, Online, 4–8 May, EGU2020-17949, https://doi.org/10.5194/egusphere-egu2020-17949. [Google Scholar]
- Jafari Raad SM, Leonenko Y, Hassanzadeh H (2022) Hydrogen storage in saline aquifers: opportunities and challenges, Renew. Sustain. Energy Rev. 168, 112846. https://doi.org/10.1016/j.rser.2022.112846. [Google Scholar]
All Tables
Accuracy ranges of WHALI autonomous multi-gas meter for measured gases compared to GA5000 and iBridMX6 hand-held devices.
All Figures
|
Fig. 1 Geological context of the study area. a) Geological map of the southwest corner of Western Australia, highlighting the study area in the red square. b) DEM map of the study area (red square on a) showing tectonic elements and seismic line in c) West-east seismic section through the DMP Harvey-2 well site, which intersected a deep fault with ~1 km of normal displacement. The fault may show further displacement of the breakup unconformity; however, this is not resolvable on current seismic. The Lower Lesueur Sandstone is being investigated as a reservoir for CO2 sequestration. |
| In the text | |
|
Fig. 2 Box plot showing the variability in cH2 concentrations across five point survey days near the DMP Harvey-2 well site in the Perth Basin, Western Australia. The box represents the interquartile range (25th–75th percentile), the line indicates the median, and individual data points are shown to display distribution spread. Measurements were obtained using the GA5000 handheld instrument, which has an upper detection limit of 1000 ppm. Values recorded as 1000 ppm represent the saturation point of the device and should be interpreted as ≥1000 ppm. |
| In the text | |
|
Fig. 3 Point sampling near the DMP Harvey-2 well site. a) Initial cCO2 measured at each location on the 4th of May, 2022. b) Final CO2 measured at each location on the 4th of May, 2022. c) cH2 results for all point sampling and autonomous monitoring locations near DMP Harvey-2 during 2022, and d) Zoom in of area in yellow square in (c) close to the Harvey River canal, interpreted surface expression of the F10 fault, both modified after Maxar Technologies, Google Earth. |
| In the text | |
|
Fig. 4 Autonomous monitoring results at the AXH2-10 location (33°0′33″S, 115°51′5″E) from the 4th of May 2022 to the 17th of May 2022 and at the AXH2-13 location (33°0′18″S, 115°50′59″E) from the 18th of May 2022 to the 31st of May 2022 a) AXH2-10 atmospheric pressure (hPa). b) AXH2-10 temperature (°C). c) AXH2-10 carbon dioxide concentration (ppm). d) AXH2-10 hydrogen concentration (ppm – temperature corrected). e) AXH2-13 atmospheric pressure (hPa). f) AXH2-13 temperature (°C). g) AXH2-13 carbon dioxide concentration (ppm). h) AXH2-13 hydrogen concentration (ppm- temperature corrected) shown with restricted range 0–120 ppmin the main image and with full range 0–600 ppm cH2 in the inset, demonstrating the scale of the spike observed on 19th May 2022. Blue dashed lines indicate periods of precipitation measured at the Bunbury Weather Station, Western Australia. |
| In the text | |
|
Fig. 5 Raw and temperature corrected hydrogen (cH2) concentration trace during the initial gas extraction at the AXH13 site near DMP Harvey-2, corresponding to the peak shown in Figure 4h and inset. The hydrogen signal increases continuously and reaches a maximum after 26 seconds of pumping (~120 cc of gas extracted), consistent with elevated concentrations sourced from the perforated chamber of the downhole probe assembly (80 cm to 1 m depth). |
| In the text | |
|
Fig. 6 Box plot comparing cH2 and cCO2 variability between the two autonomous monitoring sites (AXH2-10 and AXH2-13). Boxes represent the 25th–75th percentile range, with medians shown as horizontal lines. Diamond points indicate the outlying measurements. |
| In the text | |
|
Fig. 7 Box plot comparing the range of cCO2 (left) and cH2 (right) concentrations captured by all five point surveys (combined) versus continuous autonomous monitoring. The box represents the interquartile range (25th–75th percentile), and individual points show outlier data variability. |
| In the text | |
|
Fig. 8 Lower-triangle heatmap of Pearson correlation coefficients among cH2, CO2, atmospheric temperature, atmospheric pressure, and relative humidity, combining data from the AXH2-10 and AXH2-13 monitoring sites. Notably, cH2 and CO2 exhibit opposite correlations with relative humidity, highlighting distinct environmental controls on gas flux. Values below sensor resolution were excluded from the analysis. |
| In the text | |
Current usage metrics show cumulative count of Article Views (full-text article views including HTML views, PDF and ePub downloads, according to the available data) and Abstracts Views on Vision4Press platform.
Data correspond to usage on the plateform after 2015. The current usage metrics is available 48-96 hours after online publication and is updated daily on week days.
Initial download of the metrics may take a while.