")
")
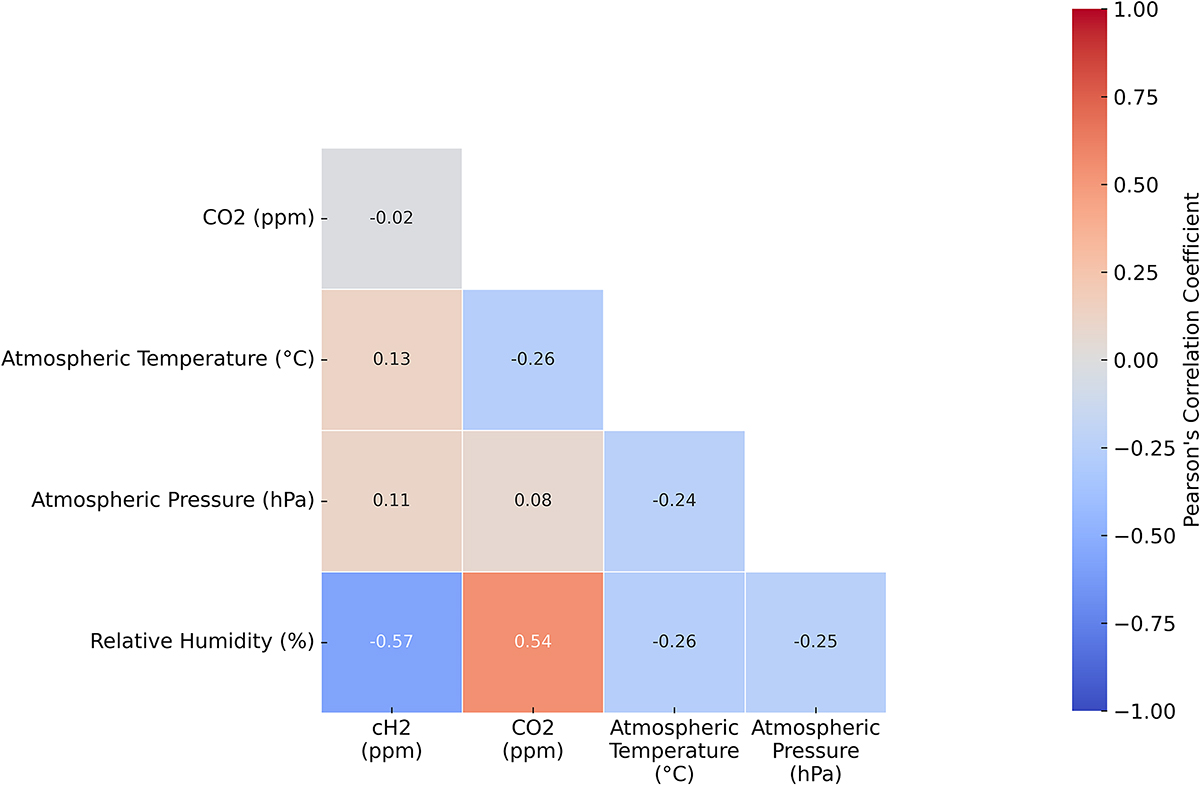
Fig. 8
Download original image
Lower-triangle heatmap of Pearson correlation coefficients among cH2, CO2, atmospheric temperature, atmospheric pressure, and relative humidity, combining data from the AXH2-10 and AXH2-13 monitoring sites. Notably, cH2 and CO2 exhibit opposite correlations with relative humidity, highlighting distinct environmental controls on gas flux. Values below sensor resolution were excluded from the analysis.
Current usage metrics show cumulative count of Article Views (full-text article views including HTML views, PDF and ePub downloads, according to the available data) and Abstracts Views on Vision4Press platform.
Data correspond to usage on the plateform after 2015. The current usage metrics is available 48-96 hours after online publication and is updated daily on week days.
Initial download of the metrics may take a while.