")
")
Fig. 4
Download original image
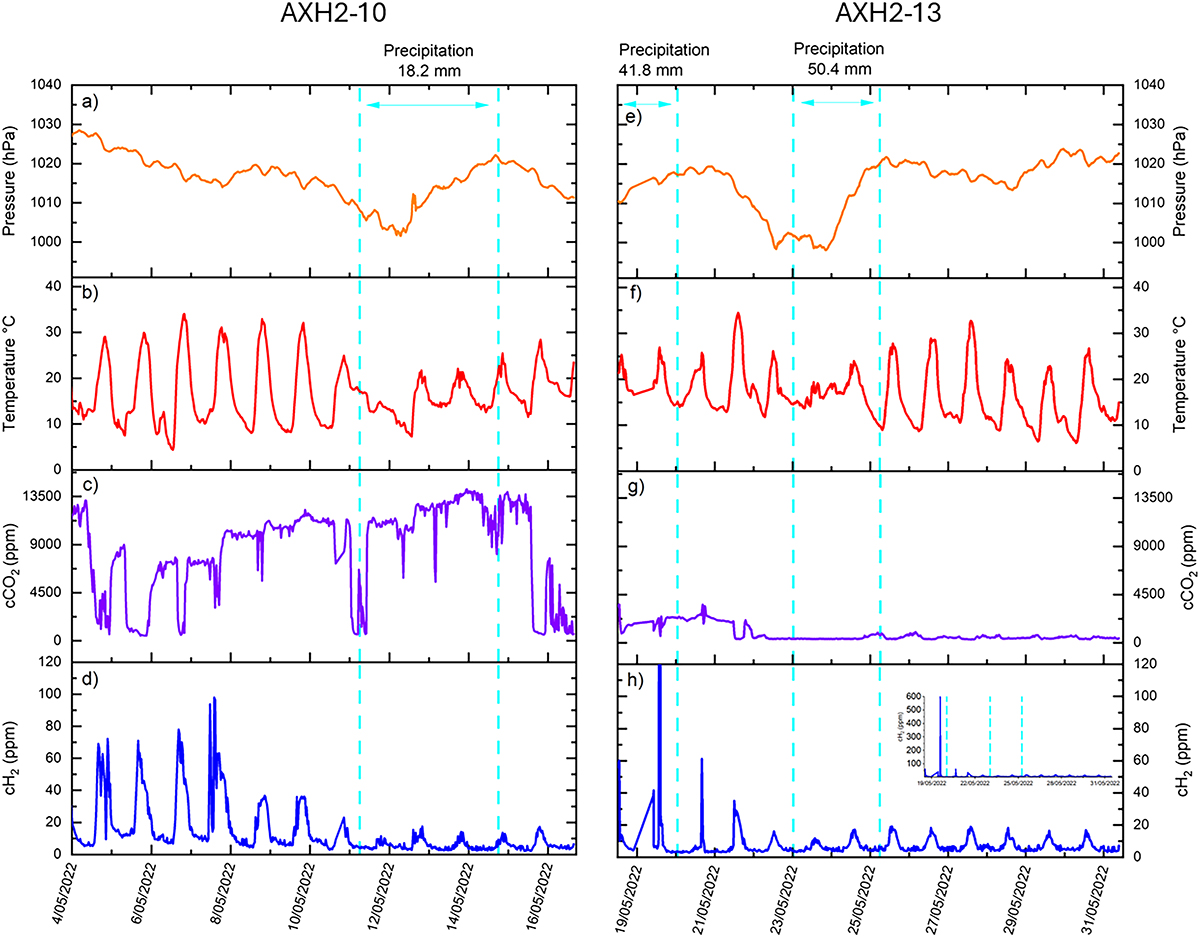
Autonomous monitoring results at the AXH2-10 location (33°0′33″S, 115°51′5″E) from the 4th of May 2022 to the 17th of May 2022 and at the AXH2-13 location (33°0′18″S, 115°50′59″E) from the 18th of May 2022 to the 31st of May 2022 a) AXH2-10 atmospheric pressure (hPa). b) AXH2-10 temperature (°C). c) AXH2-10 carbon dioxide concentration (ppm). d) AXH2-10 hydrogen concentration (ppm – temperature corrected). e) AXH2-13 atmospheric pressure (hPa). f) AXH2-13 temperature (°C). g) AXH2-13 carbon dioxide concentration (ppm). h) AXH2-13 hydrogen concentration (ppm- temperature corrected) shown with restricted range 0–120 ppmin the main image and with full range 0–600 ppm cH2 in the inset, demonstrating the scale of the spike observed on 19th May 2022. Blue dashed lines indicate periods of precipitation measured at the Bunbury Weather Station, Western Australia.
Current usage metrics show cumulative count of Article Views (full-text article views including HTML views, PDF and ePub downloads, according to the available data) and Abstracts Views on Vision4Press platform.
Data correspond to usage on the plateform after 2015. The current usage metrics is available 48-96 hours after online publication and is updated daily on week days.
Initial download of the metrics may take a while.