")
")
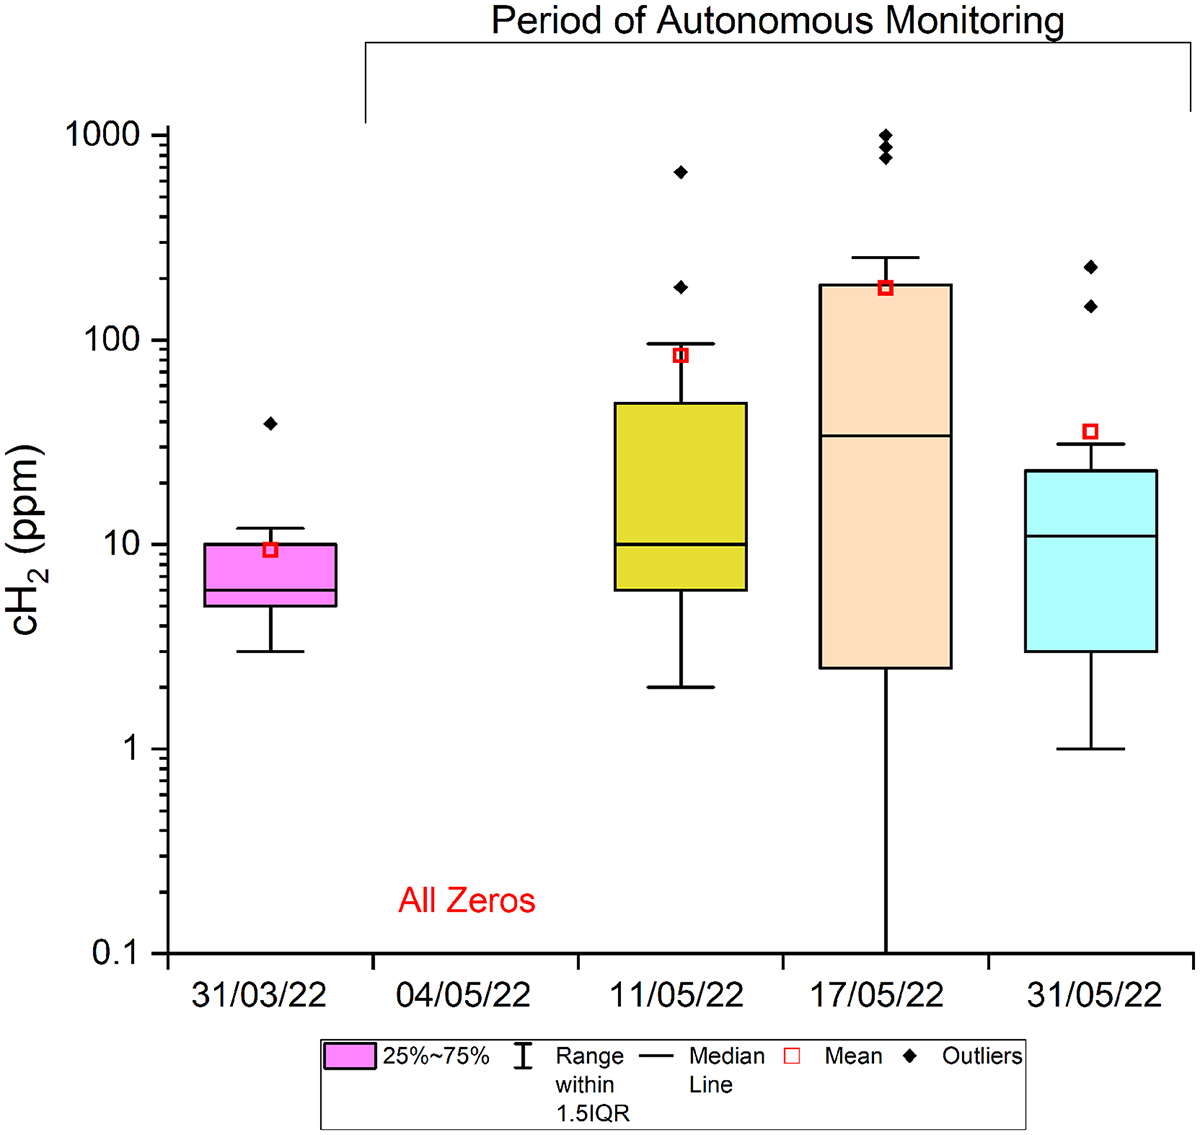
Fig. 2
Download original image
Box plot showing the variability in cH2 concentrations across five point survey days near the DMP Harvey-2 well site in the Perth Basin, Western Australia. The box represents the interquartile range (25th–75th percentile), the line indicates the median, and individual data points are shown to display distribution spread. Measurements were obtained using the GA5000 handheld instrument, which has an upper detection limit of 1000 ppm. Values recorded as 1000 ppm represent the saturation point of the device and should be interpreted as ≥1000 ppm.
Current usage metrics show cumulative count of Article Views (full-text article views including HTML views, PDF and ePub downloads, according to the available data) and Abstracts Views on Vision4Press platform.
Data correspond to usage on the plateform after 2015. The current usage metrics is available 48-96 hours after online publication and is updated daily on week days.
Initial download of the metrics may take a while.