")
")
| Issue |
Sci. Tech. Energ. Transition
Volume 80, 2025
|
|
|---|---|---|
| Article Number | 39 | |
| Number of page(s) | 19 | |
| DOI | https://doi.org/10.2516/stet/2025016 | |
| Published online | 03 June 2025 | |
Regular Article
A novel power flow control transformer for transmission grids and its steady-state analysis
1
Electric Power Research Institute of State Grid Hebei Electric Power Co., Ltd., Shijiazhuang 050021, PR China
2
School of Electrical and Electronic Engineering of Shijiazhuang Tiedao University, Shijiazhuang 050043, PR China
* Corresponding author: This email address is being protected from spambots. You need JavaScript enabled to view it.
Received:
11
March
2025
Accepted:
29
April
2025
Abstract
New energy sources such as solar and wind power are increasingly being integrated into the power system. Due to their inherent randomness, volatility, and intermittency, these renewable energy sources pose significant challenges to power flow control, particularly in transmission grids. This paper presents a novel topology of power flow control transformers for high-voltage transmission grids, aiming to address the insufficient reactive power regulation capability of traditional Phase-Shifting Transformers (PST). To thoroughly investigate the voltage and power flow regulation characteristics of the proposed topology, a steady-state port circuit model is initially developed. Given the complexity of the port circuit model and its inability to intuitively represent the voltage conversion relationship, a steady-state simplified equivalent model is subsequently developed. Through comprehensive simulation analysis and experimental validation, the feasibility of the proposed topology and the accuracy of the models are confirmed. The research findings indicate that this topology can significantly broaden the reactive power regulation range, thereby enabling the four-quadrant operation of the power flow working point. The simplified equivalent model accurately captures its voltage regulation and phase-shifting characteristics, demonstrating robust engineering applicability. Furthermore, the phase compensation voltage exerts a significant influence on active power regulation, while the amplitude compensation voltage has a pronounced effect on reactive power regulation.
Key words: Power flow control transformer / Transmission grids / Steady-state analysis / Phase compensation voltage / Amplitude compensation voltage
© The Author(s), published by EDP Sciences, 2025
 This is an Open Access article distributed under the terms of the Creative Commons Attribution License (https://creativecommons.org/licenses/by/4.0), which permits unrestricted use, distribution, and reproduction in any medium, provided the original work is properly cited.
1 Introduction
In recent years, the installed capacity of renewable energy sources such as solar and wind power has witnessed a significant increase worldwide. This growth can be attributed to the substantial advantages these clean energy technologies offer in terms of technological advancement, economic viability, and environmental sustainability [1, 2]. Simultaneously, the large-scale integration of renewable energy into the power grid has introduced new challenges for power system operators in managing power flow control. More specifically, these challenges involve heightened uncertainty on the generation side, modifications to grid operational characteristics, and constrained capacity for integrating renewable energy sources. Firstly, new energy sources such as wind power and photovoltaic power are constrained by natural conditions, and their output exhibits intermittent, fluctuating, and uncertain characteristics. This substantially enhances the complexity of power flow prediction and control in the power grid, thereby posing significant challenges to the optimization and adjustment of power flow distribution. Secondly, the randomness and volatility of new energy generation may result in the overloading of certain lines in the power grid, while the transmission capacity of other lines remains underutilized, thus creating a bottleneck effect in the transmission section. Lastly, given the substantial fluctuations in new energy output, traditional flexible power sources (e.g., thermal power and hydropower) may lack sufficient regulation capacity to fully match these fluctuations, consequently limiting the accommodation capacity for new energy [3–5].
Due to limitations in regulation speed, control flexibility, and regulation capacity, traditional methods employed by power grids, such as adjusting generator operating states and modifying grid structures, are insufficient to effectively address the challenges posed by the randomness, volatility, and intermittency of high-proportion renewable energy on the spatiotemporal distribution of power flows [6]. Under the condition of maintaining the existing grid network structure, the regulation of power flow distribution is achieved by adjusting key parameters such as voltage magnitude, phase angle, and line reactance at nodes and along transmission lines [7, 8]. The power flow in a power system comprises active power (PR) and reactive power (QR), which are functions of line impedance (X), the magnitudes of the sending-end voltage (Es) and receiving-end voltage (ER), as well as the phase difference (θ) between them, as illustrated in equations (1a)–(1b). In this simplified model, the transmission line is represented solely by its reactance. (1a)
(1a)
 (1b)
(1b)
Therefore, Flexible AC Transmission Systems (FACTS), which can adjust one or more parameters of the AC transmission system to enhance the stability and efficiency of power systems, are widely utilized in modern grid operations [9, 10]. Currently, based on the type of conversion equipment employed, FACTS devices can be categorized into two primary types: power flow controllers utilizing power electronic devices and those employing transformer technology.
Power flow controllers based on power electronic devices mainly include static Synchronous Series Compensator (SSSC), Static Synchronous Compensator (STATCOM), Unified Power Flow Controller (UPFC), and Direct Power Flow Controller (DPFC), etc. Reference [11] proposes a method for optimally coordinating Power System Stabilizers (PSS) and SSSC using the ant colony optimization algorithm, with the aim of enhancing both the dynamic stability and steady-state performance of power systems. Reference [12] presents a sliding mode control method based on reinforcement learning to enhance the control performance of hybrid static synchronous compensators (hybrid-STATCOM). This approach achieves efficient computation, high steady-state accuracy, rapid response, and robust performance. UPFC comprises a SSSC, STATCOM, and DC energy storage unit, which is recognized as one of the most powerful and versatile devices within FACTS equipment. Reference [13] proposes a hybrid method integrating Particle Swarm Optimization (PSO) and the Firefly Algorithm (FA) to determine the optimal placement and parameter settings of UPFC, as well as the output parameters of power plant generators, thereby enhancing the reliability of power systems with uncertain variables. This approach Employs Expected Unserved Energy (EPNS) as the reliability assessment metric. Reference [14] achieves independent regulation of the amplitude and phase of grid node voltages by employing a configuration that includes parallel and series three-phase transformers, three single-phase full-bridge AC units, and a three-phase filter. This configuration facilitates effective control of active and reactive power flows. Overall, power flow controllers based on power electronic devices possess significant advantages, including rapid regulation capability, flexible operation modes, and continuous high-precision regulation. Thus, certain countries have adopted FACTS technology to enhance the optimization of power flow distribution. The STATCOM device was integrated into Panama’s power transmission network for operational use, enhancing transient stability in the event of disturbances and alleviating power transmission constraints [15]. To address the power supply capacity limitations resulting from the challenges in constructing urban power supply corridors, the State Grid Corporation of China implemented a 500 kV UPFC demonstration project in Jiangsu Province. By adopting MMC-UPFC technology, the project has successfully achieved precise control over power flow, thereby enhancing the reliability and efficiency of the power grid [16]. However, their limitations are also notable, such as limited overload capacity, complex structural design, high construction and maintenance challenges, and substantial costs. These factors significantly constrain their widespread adoption in modern power grids.
The power flow controller based on transformer technology effectively addresses the limitations of power flow controllers utilizing power electronics technology. It offers advantages such as robust overload capacity, extensive regulation range, high equipment stability, and lower project costs. For instance, double-core Phase-Shifting Transformers (PST) suitable for high-voltage transmission grids as well as SEN Transformers (ST) designed for distribution networks are considered. Compared with power electronic devices, transformer technology is characterized by mature manufacturing processes, inherent mechanical structural features, and extensive operational experience, leading to higher reliability, lower losses, stronger overload capability, and longer service life. According to references [17, 18], the capital cost of UPFC is approximately five times higher than that of ST, and its operational cost is about ten times greater than that of ST. In particular, traditional PST have seen widespread application in transmission grids [19–21]. The compensation voltage generated by the traditional dual-core PST is perpendicular to the system voltage and acts as a phase compensation component, enabling it to regulate only the active power of the power system. Consequently, its power flow regulation capability is relatively restricted, making it more suitable for scenarios requiring active power regulation. With the integration of renewable energy sources like solar and wind power, voltage fluctuations in modern power systems have become more pronounced, consequently imposing greater challenges on voltage regulation and the control of active and reactive power flows. Therefore, to address the limitation of traditional PST, which can only adjust active power with restricted reactive power regulation capabilities, relevant scholars have commenced preliminary research and exploration. Reference [22] extended the application of the ST, originally designed for low-voltage power grids [23–25], to high-voltage power grids by incorporating isolation transformers, thereby forming the dual-core ST. This approach enables flexible regulation of active and reactive power flows. However, it also introduces challenges such as an excessive number of on-load tap changers and a higher number of windings. In the field of high-voltage transmission grids, due to the extremely strict requirements for production, operation and maintenance costs and reliability, research reports on the topology of power flow control devices and power flow regulation are still relatively limited to date. In conclusion, the topology of transformer-based power flow control devices and their associated power flow regulation characteristics require further in-depth investigation.
This paper addresses the issue of insufficient reactive power regulation capability of traditional PST and proposes a novel topology of power flow control transformer for high-voltage transmission grids. By establishing a steady-state circuit model, the voltage and power flow regulation characteristics of the proposed topology are investigated. The main contributions of this work are summarized as follows:
-
A novel topology for a power flow control device based on transformer technology is proposed. This topology enables four-quadrant operation of the working point by regulating the polarity and amplitude of two orthogonal compensation voltages.
-
A steady-state port circuit model is developed, in order to thoroughly investigate the voltage and power flow regulation characteristics of the proposed novel topology. Given the complexity of the port model and its numerous parameters, an alternative simplified equivalent model with enhanced engineering applicability is subsequently introduced.
-
Based on the simplified equivalent model, the relationship between the system voltage after compensation and the series compensation voltage is analyzed. The control mechanism of the series compensation voltage on the regulation of active and reactive power flows is investigated. The feasibility of the proposed topology and the accuracy of the model are validated through simulation analysis and experimental studies.
The rest of this paper is organized as follows: Section 2 elaborates on the operation principle of the proposed topology; Section 3 develops the port equivalent model and the simplified equivalent model; Section 4 investigates the voltage and power flow regulation characteristics of the proposed topology using a two-terminal transmission systems through simulation analysis; Section 5 validates the engineering feasibility and model accuracy of the proposed topology through experimental studies; Section 6 summarizes the key conclusions of the paper.
2 Operation principle of the novel power flow control transformer
The topology of the novel power flow control transformer is depicted in Figure 1. This configuration comprises an exciting unit and a series unit. The exciting unit is a three-phase, three-winding transformer with the primary winding(AE1, BE1, CE1) connected in YN configuration, while the secondary(aE2, bE2, cE2) and tertiary windings(aE3, bE3, cE3) are connected in yn configuration and equipped with a tap changer. The series unit consists of two three-phase double-winding transformers. Series unit No. 1 adopts a III/yn connection mode, with its secondary winding linked to the second winding of the exciting unit, thereby facilitating adjustment of the sending-end voltage amplitude. Series unit No. 2 employs a III/Δ connection mode, with its secondary winding connected to the third winding of the exciting unit, enabling adjustment of the sending-end voltage phase. By isolating the on-load tap changer through the series unit, this topology enhances operational reliability. Furthermore, the excitation unit and the series unit respectively adopt mature three-winding transformer and double-winding transformer technologies. Their manufacturing processes have been highly refined, thereby ensuring the high reliability of the system. The on-load tap changer can be implemented using either a mechanical switch [26] or a power electronic switch [27, 28]. For this paper, it is assumed that a mechanical switch is utilized. Thus, the topological structure presented in this paper features discrete voltage compensation. Its operating point is determined jointly by the number of steps and the step voltage. While its dynamic response is relatively slower, it exhibits high reliability. A typical application scenario for this topology is steady-state power flow control in high-voltage transmission grids.
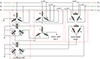 |
Fig. 1 The topology of the novel power flow control transformer. |
As illustrated in Figure 1, (SA, SB, SC) and (LA, LB, LC) represent the sending end and receiving end of the transmission line, respectively. The voltage at the sending end of the transmission line before compensation is denoted as ( ). The compensation voltages provided by the two series units are (
 ) and (
 ), respectively. Consequently, the voltage at the sending-end of the transmission line after compensation can be expressed as:
 (2a)
(2a)
 (2b)
(2b)
 (2c)
(2c)
By adjusting the tap positions of the two secondary windings of the exciting unit, the amplitude and phase of the compensation voltage can be modified, thereby regulating the voltage levels at nearby nodes and the power flow distribution in the line. The on-load tap changer operates within a range of (0, ±1, ±2, … ±n), assuming that both secondary windings possess three-level voltage regulation capability (i.e., n = 3). Consequently, the output voltage phasors for the dual-core ST and the topology proposed in this paper are illustrated in Figure 2.
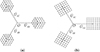 |
Fig. 2 Schematic diagram of the output voltage phasor following compensation voltage application (a) the dual-core ST; (b) the topology proposed in this paper. |
As illustrated in Figure 2, both the dual-core ST and the novel topology can achieve four-quadrant regulation of the compensation voltage. A comparative analysis is presented below between the dual-core ST topology and the topology structure proposed in this paper, focusing on four key aspects: regulation accuracy, power flow regulation range, the number of three-phase on-load tap changers, and the manufacturing process. Detailed information can be found in Table 1.
Comparison between dual-core ST and the proposed topology in this paper.
As presented in Table 1, when the step voltage and regulation series are identical, the novel topology exhibits a greater number of operating points: specifically, the dual-core ST has 37 operating points, whereas the novel topology has 49. Moreover, if the maximum compensation voltage is the same, the voltage regulation accuracy of the novel topology surpasses that of the dual-core ST. Furthermore, the novel power flow control transformer achieves a reduction in the number of on-load tap changers, thereby optimizing the manufacturing process without compromising performance, and significantly enhancing both its maturity and reliability.
3 Steady-state equivalent circuit model
3.1 Port equivalent circuit model
To thoroughly investigate the voltage regulation characteristics and power flow control capabilities of the novel power flow control transformer, it is imperative to develop a precise steady-state equivalent circuit model. Currently, in the study of transformer steady-state performance, two primary modelling approaches are predominantly utilized: one is the equivalent circuit model based on coupled inductors, and the other is the multi-winding transformer model based on the T-type equivalent circuit. In the circuit model based on coupled inductors, self-inductance characterizes the electromagnetic properties of individual windings, while mutual inductance quantifies the coupling relationship between different windings. By formulating the equation set for coupled inductors, it becomes possible to determine the voltage and current relationships across each winding and to conduct a detailed analysis of the transformer’s steady-state behaviour and transient response. Although this method can precisely consider the mutual leakage reactance of windings, its calculation process is rather complicated and lacks clear engineering physical significance, thus making it inconvenient to apply in practical analysis and calculation. In the transformer model based on the T-type equivalent circuit, each winding of a multi-winding transformer is represented by its corresponding resistance, inductance, and ideal transformer. By applying Kirchhoff’s laws and the law of electromagnetic induction, the relationships between the voltages and currents of each winding are established, enabling a comprehensive analysis of the steady-state operating characteristics of the multi-winding transformer. The T-type equivalent circuit is typically formulated under the assumption of linear core and winding characteristics of the transformer, potentially resulting in inaccuracies when characterizing its nonlinear behaviour. However, the parameters of this model possess explicit engineering physical significance, and the calculation process is straightforward and efficient, rendering it highly suitable for practical engineering analysis and computation. In conclusion, the modelling approach based on the T-type equivalent circuit model is better aligned with the research objectives of this paper and demonstrates superior applicability.
From a port perspective, the novel topology can be regarded as a six-port passive network. Based on its topological connection, a single-phase equivalent circuit is established, as shown in Figure 3. In this equivalent circuit, the following parameters are defined: let  represent the source-side voltage and load-side voltage of the line, respectively. Similarly, let
  denote the source-side current and load-side current, respectively. The amplitude compensation voltage and phase compensation voltage are represented by
  and
and  , respectively. For the series unit No. 1, ZS1, ZS3 denote the primary side leakage impedance and the secondary side leakage impedance, respectively. While the excitation impedance is represented by ZSm1, the secondary side terminal voltage and current are given by
  and
and  , respectively.
  is the excitation current of series unit No. 1. For the series unit No. 2, ZS2, ZS4 denote the primary side leakage impedance and the secondary side leakage impedance, respectively. The excitation impedance is represented by ZSm2. While the secondary side terminal voltage is given by
  and
and  , the secondary side terminal currents is given by
  and
and  , respectively.
  is the excitation current of series unit No. 2. For the exciting unit, the terminal voltages of the three windings are
  , and the terminal currents are
  . The leakage impedances of the three windings are ZE1, ZE2, ZE3, while the excitation current and excitation impedance are denoted by
  and ZEm, respectively. The transformation ratios for the series unit No. 1, series unit No. 2, and the exciting unit are 1:NS1, 1:NS2 and 1:NE1:1:NE2, respectively. Notably, NE1, NE2 vary with changes in the on-load tap changer position.
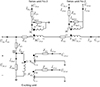 |
Fig. 3 The single-phase equivalent circuit diagram of the proposed topology in this paper. |
From Figure 3, the Kirchhoff’s Voltage Law (KVL) equations for the source side and load side of the line can be derived as follows: (3a)
(3a)
 (3b)where X = A, B, C, represents three phases.
The Kirchhoff’s Current Law (KCL) equation for node ① can be expressed as: (4)
(4)
The magnetic driving force balance equation can be formulated as: (5a)
(5a)
 (5b)
(5b)
 (5c)
(5c)
The KVL equation for the secondary side of the exciting unit can be expressed as: (6a)
(6a)
 (6b)
(6b)
The KVL equation for the secondary side of the series units can be formulated as: (7a)
(7a)
 (7b)
(7b)
According to the connection relationship between the excitation unit and the first series unit, it can be concluded that: (8a)
(8a)
 (8b)
(8b)
 (8c)
(8c)
 (8d)
(8d)
 (8e)
(8e)
 (8f)
(8f)
From the connection relationship between the excitation unit and the second series unit, it can be obtained that: (9a)
(9a)
 (9b)
(9b)
 (9c)
(9c)
 (9d)
(9d)
 (9e)
(9e)
 (9f)
(9f)
 (9g)
(9g)
 (9h)
(9h)
 (9i)
(9i)
By systematically organizing equations (3)–(9), the port equivalent circuit model of the proposed topology can be derived as follows:![Mathematical equation: $$ \left[\begin{array}{l}{\dot{U}}_{{SA}}\\ {\dot{U}}_{{SB}}\\ {\dot{U}}_{{SC}}\\ {\dot{U}}_{{LA}}\\ {\dot{U}}_{{LB}}\\ {\dot{U}}_{{LC}}\\ \end{array}\right]=\left[\begin{array}{llllll}{Z}_{11}& {Z}_{12}& {Z}_{13}& {Z}_{14}& {Z}_{15}& {Z}_{16}\\ {Z}_{21}& {Z}_{22}& {Z}_{23}& {Z}_{24}& {Z}_{25}& {Z}_{26}\\ {Z}_{31}& {Z}_{32}& {Z}_{33}& {Z}_{34}& {Z}_{35}& {Z}_{36}\\ {Z}_{41}& {Z}_{42}& {Z}_{43}& {Z}_{44}& {Z}_{45}& {Z}_{46}\\ {Z}_{51}& {Z}_{52}& {Z}_{53}& {Z}_{54}& {Z}_{55}& {Z}_{56}\\ {Z}_{61}& {Z}_{62}& {Z}_{63}& {Z}_{64}& {Z}_{65}& {Z}_{66}\end{array}\right]\left[\begin{array}{l}{\dot{I}}_{{SA}}\\ {\dot{I}}_{{SB}}\\ {\dot{I}}_{{SC}}\\ {\dot{I}}_{{LA}}\\ {\dot{I}}_{{LB}}\\ {\dot{I}}_{{LC}}\\ \end{array}\right] $$](/articles/stet/full_html/2025/01/stet20250124/stet20250124-eq49.gif) (10)
(10)
The detailed expressions for each element of the open-circuit impedance matrix presented in the aforementioned equation are provided in Appendix. This model comprehensively accounts for the topological connections between series and exciting units, incorporates all excitation and short-circuit impedances of the transformer, and precisely characterizes the coupling relationships between ports.
However, as revealed by equation (10), this model exhibits two significant limitations: firstly, the open-circuit impedance matrix encompasses a large number of variables, with 36 matrix elements, leading to highly complex expressions; secondly, it is not feasible to directly derive the voltage transformation relationship between the power supply side and the load side, thereby complicating the analysis required for engineering applications. Consequently, it is imperative to develop an equivalent model that is simpler in structure, more broadly applicable, and maintains acceptable accuracy.
3.2 Simplified equivalent circuit model
To address the two limitations of the port equivalent circuit model, leveraging the fact that the excitation impedance of the transformer is significantly higher than the leakage impedance of the windings, the excitation impedance is approximated as infinite. Consequently, the simplified equivalent circuit, as depicted in Figure 4, can be derived.
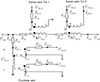 |
Fig. 4 The simplified equivalent circuit of the proposed topology in this paper. |
Based on Figure 4, under the condition of positive sequence voltage, by simplifying and reorganizing equations (3)–(9), the following results can be derived. (11)
(11)
Let  , it is the positive sequence equivalent ratio of the series unit, T1 = 1 − k1 = |T1| ∠ φ1 is the positive sequence voltage transfer ratio. φ1 is a positive sequence phase-shifting angle. It can be seen that the voltage regulation and phase-shifting characteristics of the proposed topology in this paper. Let
  , it is a positive sequence equivalent short circuit impedance.
Under negative sequence voltage conditions, the same analytical approach can be adopted to derive the corresponding results. (12)
(12)
Let  , it is the negative sequence equivalent ratio of the series unit,
  is the negative sequence voltage transfer ratio. Zeq2 = Zeq1, it is a negative sequence equivalent short circuit impedance. Evidently, the positive and negative sequence circuit models exhibit the following characteristics: identical equivalent short-circuit impedance, consistent transformation ratio magnitude, yet opposite phase-shifting angle directions.
Under zero sequence voltage conditions, the zero sequence equivalent circuit model can be obtained using the same analytical approach as described in the preceding analysis. (13)
(13)
Let k0 = NE1/NS1, it is the zero sequence equivalent ratio of the series unit, T0 = 1 − k0 is the zero sequence voltage transfer ratio. It is evident that T0 is a real number, indicating that under zero-sequence voltage conditions, the power flow control transformer lacks phase-shifting capability. Let  ,it is a zero-sequence equivalent short circuit impedance.
Based on the aforementioned analysis, the simplified equivalent circuit model can be represented by the schematic diagram shown in Figure 5.
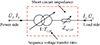 |
Fig. 5 Simplified equivalent model diagram of the proposed topology in this paper. |
Compared with the port equivalent model, the simplified equivalent model effectively addresses its two primary limitations. Firstly, the port equivalent model comprises 36 characteristic parameters, whereas the simplified equivalent model consists of only 6, thereby significantly improving the model’s conciseness and interpretability. Secondly, the port equivalent model lacks an intuitive representation of voltage conversion relationships, while the simplified equivalent model incorporates physically meaningful parameters such as the voltage transfer ratio and equivalent short-circuit impedance. More specifically, the voltage transfer ratio explicitly demonstrates the voltage regulation and phase-shifting capabilities of the proposed topology; the equivalent short-circuit impedance precisely characterizes its impedance properties; and the sequence equivalent ratio emphasizes the compensation voltage feature. Consequently, the simplified equivalent model, characterized by its concise formulation and clear physical interpretation, enhances its practical applicability in engineering contexts.
4 Simulation analysis of steady-state operating characteristics
4.1 No-load voltage regulation characteristics
In high-voltage transmission grids, double-terminal transmission systems represent a prevalent transmission structure, particularly in applications such as long-distance and large-capacity power transmission, as well as cross-regional grid interconnections. For instance, transmission lines connecting power generation sources such as large hydropower stations and thermal power plants to load centres can typically be abstracted and simplified into a two-terminal transmission system. Consequently, conducting an in-depth analysis of the two-terminal transmission system model plays a crucial role in both theoretically comprehending and practically enhancing the transmission process within real high-voltage power grids. In this paper, the double-terminal transmission system offers a relatively simplified and analytically tractable platform for investigating the voltage regulation and power flow control characteristics of the novel power flow control transformer. This contributes to elucidating the operational mechanism of the proposed technology in typical high-voltage transmission grid scenarios.
The 220 kV double-terminal transmission system is illustrated in Figure 6.  , ZS10 represent the sending end’s main voltage and internal impedance, respectively.
  , ZS20 denote the receiving end’s main voltage and internal impedance. ZL represents the line impedance;
  is the sending end’s main voltage after compensation. The relevant parameters are listed in Table 2. The test parameters for the novel topology are designed based on the parameters of a standard transformer of the same voltage class, with two voltage-regulating windings adjustable by five voltage levels. The tap value is set to (0, ±1, ±2, ±3, ±4, ±5), the sending end’s main voltage is normalized to 1.0 p.u., and the maximum compensation voltage is set to ±0.1 p.u. In the calculation process, the resistance of the novel topology is neglected.
 |
Fig. 6 220 kV dual power transmission system (a) Double-terminal transmission system based on simulation model; (b) Double-terminal transmission system based on simplified equivalent model. |
Parameters of 220 kV dual power transmission system and the proposed topology in this paper.
When the line is unloaded, there is no power flow, and the sending-end voltage remains constant. By adjusting the tap position, the compensated sending-end voltage can be achieved. Under five-level voltage regulation, there are 121 possible operating points. Taking phase A as an example, nine representative operating points, spanning all four quadrants, are selected to perform a comparative analysis of the calculation results obtained from the port equivalent model (P-model), the simplified equivalent model (S-model), and the ATP/EMTP simulation model (ATP-model). Using the calculation results of the ATP/EMTP simulation model as a reference benchmark, the relative errors in the calculation results of the port equivalent model and the simplified equivalent model are assessed. The detailed results are presented in Table 3.
Sending end voltage after comparison of P-model, S-model and ATP-model.
As shown in Table 3, the calculated voltage amplitudes and phase angles of the P-model and S-model are largely consistent with the simulation results obtained from the ATP-model. Specifically, when compared to the ATP-model, the maximum relative errors in voltage amplitude and phase angle for the P-model are 0.042% and 0.158%, respectively, while those for the S-model are 0.058% and 0.316%. This indicates that the P-model exhibits smaller calculation errors, thereby validating its correctness under no-load conditions. Furthermore, although the S-model demonstrates slightly higher maximum relative errors than the P-model, it still satisfies the engineering accuracy requirements, thus confirming its feasibility and reliability in practical engineering applications.
Compared with the P-model, the S-model exhibits a clearer physical interpretation and a more concise formulation. On this basis, the S-model is adopted in this paper as the foundation to further investigate the voltage regulation characteristics of the novel power flow control transformer under no-load conditions. Taking the A phase of the power system as an example, the phasor diagram of the compensated voltage is shown in Figure 7a.  is system voltage before compensation,
  is system voltage after compensation, whose phase angle is ΔA.
  are amplitude and phase direction compensation voltage components, respectively. Obviously, the compensation voltage
  whose phase angle is θA. Taking θA as the independent variable, the curves of system voltage amplitude
  after compensation, phase angle ΔA after compensation and compensation voltage amplitude
  changing with compensation voltage phase angle θA are drawn, as shown in Figure 7. In the diagram, n = 0 is the case when the compensation voltage is 0, and n = 1~5 is the five-stage adjustment of the compensation voltage.
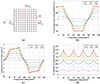 |
Fig. 7 The change curve of the amplitude of the system voltage, phase angle and the amplitude of the compensating voltage (a) Phase A compensation voltage phasor diagram; (b) The change of system voltage amplitude after compensation with the phase of compensation voltage; (c) The change of system voltage phase angle after compensation with the compensation voltage phase; (d) The amplitude of compensation voltage varies with the phase of compensation voltage. |
It can be seen that the phase of compensation voltage is adjustable in the four quadrants of 0~360°, the amplitude of the compensation voltage is adjustable in the range of 0~0.14 p.u., the amplitude of system voltage amplitude after compensation is adjustable in the range of 0.9~1.1 p.u., and the phase angle of system voltage after compensation is adjustable in the range of −6.34~6.34°. It should be noted that although the maximum compensation voltage is set to ±0.1 p.u. in this paper. In fact, its horizontal and vertical components can be set separately, that is the operating area in Figure 7a can be square or rectangular.
4.2 Power flow regulation characteristics
Nine representative operating points, covering all four quadrants, are still selected for a comparative analysis of the power flow calculation results obtained from the port equivalent model (P-model), the simplified equivalent model (S-model), and the ATP/EMTP simulation model (ATP-model). Using the calculation results of the ATP/EMTP simulation model as a reference benchmark, the relative errors in the results of the port equivalent model and the simplified equivalent model are evaluated, as presented in Table 4.
Power flow calculation comparison of P-model, S-model and ATP-model.
As presented in Table 4, the calculated active and reactive power flow results of both the P-model and S-model are largely consistent with the simulation values obtained from the ATP-model. More specifically, when compared to the ATP-model, the maximum relative errors for active and reactive power flows in the P-model are 1.05% and 1.07%, respectively, whereas the corresponding errors in the S-model are slightly higher at 1.28% and 1.83%. Consequently, it is evident that the P-model exhibits smaller calculation errors, thereby validating its accuracy under load conditions. Despite having marginally larger maximum relative errors than the P-model, the S-model still satisfies the necessary engineering precision requirements, thus demonstrating its feasibility and reliability for practical engineering applications.
In order to explore the influence of compensation voltage on power flow regulation, the power flow regulation is defined as  .
.  is the power flow of the receiving terminal when the tap is adjusted.
  is the power flow at the receiving terminal when the tap position is at (0, 0). By utilizing the simplified equivalent model (as given in Eq. (11)) and considering the structure of the two-terminal transmission system (illustrated in Fig. 6b), the mathematical expression for the current at the receiving end can be systematically derived as follows:
 (14)
(14)
The power flow at the receiving end can be expressed as (15)
(15)
In order to facilitate the observation, the amplitude compensation voltage  and the phase compensation voltage
  are both per unit value. In the four-quadrant whole domain, the variation surface of active and reactive power flow regulation amount with compensation voltage, as shown in Figure 8.
 |
Fig. 8 The three-dimensional surface depict the relationship between power flow regulation quantity and compensation voltage. (a) The variation of active power flow regulation amount with compensation voltage; (b) The variation of reactive power flow regulation amount with compensation voltage. |
It can be seen that the active power regulation range is −138.69~123.86 MW, and the reactive power regulation range is −142.13~136.94 MVar. The proposed topology in this paper is capable of realizing bidirectional control of power flow, and defined as  an ordered real number pair. The positions where the maximum active power regulation amount occurs are (−0.1, −0.1) and (0.1, 0.1), and the positions where the maximum reactive power regulation amount occurs are (−0.1, 0.1) and (0.1, −0.1). With the increase of
  , the regulation amount generally showed an increasing trend. This is because, as the compensation voltage increases, the current induced in the circuit also increases correspondingly. This relationship can be mathematically described by equation (15). The phase compensation voltage
  has a great influence on the active power regulation amount, while the amplitude compensation voltage
  , has a great influence on the reactive power regulation amount. Further, taking the phase of the compensation voltage as the independent variable, the curves of active and reactive power flow with it are drawn, as shown in Figure 9.
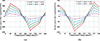 |
Fig. 9 The curves depicting the relationship between power flow regulation and compensating voltage phase. (a) The variation of active power flow regulation amount with the phase of compensation voltage; (b) The variation of reactive power flow regulation amount with the phase of compensation voltage. |
It is evident that the changing trend of active and reactive power flow regulation amounts with respect to the phase of the compensation voltage exhibits a pattern similar to that of sine or cosine functions. Although the range of regulation amounts varies across different tap settings, the overall change trend remains consistent. Specifically, the maximum values of active power flow regulation occur at phases 45° and 225°, while the maximum values of reactive power flow regulation are observed at phases 135° and 315°. These findings align with the results presented in Figure 8. Subsequently, further analysis is conducted regarding the variation characteristics of the short-circuit impedance of the power control transformer at different tap positions of the switch. The detailed results are presented in Figure 10.
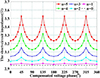 |
Fig. 10 The variation characteristics of short-circuit impedance of the power control transformer at different tap positions of the switch. |
As illustrated in Figure 10, the variation trend of the short-circuit impedance aligns with that of the amplitude of compensation voltage, which is consistent with the derivation in formula (11). Specifically, an increase in the amplitude of the compensation voltage leads to a higher short-circuit impedance exhibited by the power flow control transformer. Nevertheless, the overall variation range of the short-circuit impedance is limited to 2.94~3.53 Ω. By analyzing the line impedance parameters of the two-terminal transmission system, it can be concluded that the impedance fluctuations of the power flow control transformer exert only a minimal influence on the overall system impedance. As demonstrated by the analysis in Figure 8, the distribution characteristics of power flow in a dual-power supply transmission system are substantially determined by the compensation voltage.
5 Experimental verification
5.1 Simulated experiment platform
To validate the feasibility of the proposed topology, a small-scale prototype was developed, and a simulation experiment platform was established. The circuit schematic diagram and experimental setup are presented in Figure 11, while the relevant parameters are detailed in Table 5.
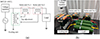 |
Fig. 11 Circuit wiring diagram and simulation test platform. (a) The circuit principle wiring diagram; (b) Simulated experiment platform. |
Parameters of simulated test platform.
5.2 No-load voltage regulation characteristics
The prototype possesses three-stage voltage regulation capability, with tap positions set at (0, ±1, ±2, ±3). The maximum compensation voltage is configured to ±0.1 p.u., resulting in a total of 49 operating points. Nine operating points from phase A are selected to compare the computational outcomes of the simplified equivalent model with the test results for the compensated sending terminal voltage, as presented in Table 6.
Sending terminal voltage comparison of simplified model and test results.
As indicated in Table 6, the computational outcomes of the simplified equivalent model exhibit substantial agreement with the experimental results. The maximum relative errors for amplitude and phase angle are 1.83% and 3.93%, respectively, thereby validating the engineering feasibility of the proposed topology and the accuracy of the simplified equivalent model under no-load conditions. The relatively large phase error can primarily be attributed to the overall small angle values and the measurement precision limitations of the equipment. The phase measurement accuracy of the equipment is ±0.1°.
5.3 Power flow regulation characteristics
Similarly, the computational outcomes of the simplified equivalent model are compared with the measured results pertaining to the active power flow at the sending terminal after compensation, as presented in Table 7.
Power flow calculation comparison of simplified model and test results.
As illustrated in Table 7, the computational outcomes of the simplified equivalent model exhibit substantial agreement with the experimental data, demonstrating a maximum relative error of 3.69%. Considering the potential inaccuracies inherent in the actual measurement process and the limitations of the measurement equipment, these results substantiate both the engineering feasibility of the proposed topology and the accuracy of the simplified equivalent model under on-load conditions.
Furthermore, with A phase in the power system as an example, the operating point P in Figure 12a was chosen as the measurement object. The measured waveforms of the amplitude compensation voltage  and the phase compensation voltage
  are illustrated in Figure 12b. Meanwhile, the measured waveforms of the sending-end voltage of the power supply
  , the compensated receiving-end voltage
  , and the load current
  are depicted in Figure 12c.
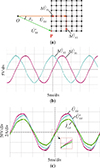 |
Fig. 12 The measured waveforms of voltage and current in the test platform. (a) Phasor diagram of compensation voltage; (b) The measured waveforms of compensation voltage; (c) The measured waveforms of the sending-end voltage, receiving-end voltage and circuit current. |
As illustrated in Figure 12b, the phase compensation voltage  leads the amplitude compensation voltage
  by exactly 90° in phase. Moreover, both voltages have an identical amplitude of 8.9 V. The phase of the voltage at the receiving end
  lags behind that at the sending end
 by approximately 6.1°. Additionally, the amplitude of the voltage at the receiving end
  measures 82 V, whereas the amplitude at the sending-end
  measures 89 V. It can be observed that the novel topology of the power flow control transformer proposed in this paper effectively realizes voltage regulation and phase shifting functions. The measured waveforms precisely correspond to the position of operating point P in Figure 12a. Furthermore, given that the simulation test platform employs resistive loads, the phase of the line current
  aligns with the phase of the compensated receiving-end voltage
  , with an amplitude of 2.5 A, thereby fully reflecting the power flow regulation capabilities of the proposed transformer.
6 Conclusions and future work
To address the limitation of traditional dual-core PST, which are unable to achieve four-quadrant power flow control due to insufficient reactive power regulation capability, this paper proposes a novel transformer-based power flow control topology. The main outcomes of the article are: (1) The study investigates the construction of its steady-state model and examines the characteristics of power flow regulation. The port equivalent model comprehensively accounts for the internal electrical connections and all impedance parameters of the topology. However, it suffers from a complex expression and an inability to reflect the voltage conversion relationship, making it less suitable for analyzing power flow regulation characteristics. In contrast, the simplified equivalent model offers clear physical meaning and a straightforward expression, thereby enhancing its engineering applicability. (2) The simulation analysis demonstrates that the simplified equivalent model exhibits high accuracy and satisfies engineering precision requirements. The proposed topology enables four-quadrant power flow control. Specifically, the phase compensation voltage significantly influences the active power flow regulation, whereas the amplitude compensation voltage has a substantial impact on the reactive power flow regulation. (3) A small-scale prototype is developed, and a test platform is established to evaluate the voltage and power flow regulation characteristics. The experimental results exhibit high consistency with the calculation results derived from the simplified equivalent model.
It is imperative to further investigate the power flow control response characteristics of the proposed topology under various operating conditions. Consequently, future work will focus on the following aspects: (1) The mechanical switch utilized in this paper exhibits a relatively slower response time, making it appropriate for steady-state power flow regulation. In future work, the integration of power electronic technologies, including thyristors and IGBTs (Insulated Gate Bipolar Transistors), will fully leverage the rapid response capabilities of power electronic switches. By combining this with the high reliability of electromagnetic transformers, the dynamic performance of the tap changer within the proposed topology will be further enhanced, enabling both swift power flow control and high-precision regulation. (2) The power flow control capability under the scenario of a three-phase symmetrical power flow has been investigated. Future work will focus on exploring the power flow control characteristics and dynamic response performance of the proposed topology under three-phase asymmetrical conditions. (3) For external faults, such as three-phase symmetrical short circuits and single-phase ground short circuits, the operational characteristics and dynamic response performance of the proposed topology under fault conditions will be further investigated.
Funding
This research was funded by the Science and Technology Program of State Grid Hebei Electric Power, grant number 5204DY23000G; Science and Technology Project of Hebei Education Department, grant number QN2020155.
Conflicts of interest
The authors declare no conflicts of interest.
Data availability statement
The data that support the findings of this study are available from the corresponding author upon reasonable request.
Author contribution statement
Conceptualization: P.Y. (Peng Yang) and W.D. (Wei Du); methodology: C.X. (Chenmeng Xiang) and S.G. (Shuguo Gao); software: P.Y. and Y.T. (Yuan Tian); validation: S.G. and L.D. (Lujian Dai); formal analysis: W.D., L.D., and Y.T.; writing – original draft preparation: P.Y., C.X., S.G., and L.D.; writing – review and editing: P.Y., W.D., C.X., Y.T., and W.D. All authors have read and agreed to the published version of the manuscript.
References
- Gupta R.K., Shankar R., Kumar A. (2025) Sustainable energy optimization in dual-area systems: integrating floating solar with hydroelectric power using hCIGWO and advanced 2-DOF controllers, J. Renew. Sustain. Energy 17, 1, 016301. [CrossRef] [Google Scholar]
- Ang T.-Z., Salem M., Kamarol M., Das H.S., Nazari M.A., Prabaharan N. (2022) A comprehensive study of renewable energy sources: classifications, challenges and suggestion. Energy Strateg. Rev. 43, 100939–100939. [CrossRef] [Google Scholar]
- Xie W., Yuan Y., Zheng X., Chen H., Liu J., Zhang C. (2025) Application of voltage optimization strategy for rotary power flow controllers in loop closing of distribution networks, Electronics 14, 630. [CrossRef] [Google Scholar]
- Zhai J., Guo L., Wang Z., Li X., Liu Y., Wang C. (2025) Coordinated frequency regulation of active distribution networks considering dimension-augmented power flow constraints, IEEE Trans. Sustain. Energy 16, 138–148. [CrossRef] [Google Scholar]
- Mohamed A.A., Kamel S., Hassan M.H., Dominguez-Garcia J.L. (2024) Optimal power flow incorporating renewable energy sources and facts devices: a chaos game optimization approach, IEEE Access 12, 23338–23362. [CrossRef] [Google Scholar]
- Li X., Xie K., Shao C., Hu B., Huang W., Pan C., Du X. (2025) A sensitivity-based rolling operational reliability evaluation that follows the changing available generation capacity of renewable energies, IEEE Trans. Power Syst. 40, 166–177. [CrossRef] [Google Scholar]
- Mishra A., Chatterjee K. (2023) Flicker attenuation using FACTS device for DFIG-based WECS connected to distribution network, IEEE Syst. J. 17, 282–293. [CrossRef] [Google Scholar]
- Marrero-Vera S., Hernandez-Tejera M., Nuez-Pestana I. (2022) Pareto optimality for FACTS devices placement considering demand variations, Electr. Power Syst. Res. 211, 108177–108177. [CrossRef] [Google Scholar]
- Roy C., Chatterjee D., Bhattacharya T. (2023) Control of a hybrid shunt FACTS compensator for voltage collapse prevention in interconnected EHV power transmission systems, IEEE J. Emerg. Sele. Topics Ind. Electron. 4, 538–548. [Google Scholar]
- Mohamed A.A., Kamel S., Hassan M.H.H., Ibrahim A.A.A. (2023) Northern goshawk optimization algorithm for optimal power flow with FACTS devices in wind power integrated electrical networks, Electric Power Comp. Syst. 52, 1293–1315. [Google Scholar]
- Kamarposhti M.A., Colak I., Iwendi C., Band S.S., Ibeke E. (2022) Optimal coordination of PSS and SSSC controllers in power system using ant colony optimization algorithm, J. Circuits Syst. Comput. 31, 4, 2250060. [CrossRef] [Google Scholar]
- Gong C., Sou W.K., Lam C.S. (2023) Reinforcement learning based sliding mode control for a hybrid-STATCOM, IEEE Trans. Power Electron. 38, 6795–6800. [CrossRef] [Google Scholar]
- Rezaeian-Marjani S., Miralizadeh Jalalat S., Tousi B., Galvani S., Talavat V. (2023) A probabilistic approach for optimal operation of wind‐integrated power systems including UPFC, IET Renew. Power Gen. 17, 706–724. [CrossRef] [Google Scholar]
- Yao C., Zhang Y. (2024) Direct power flow controller with continuous full regulation range, IEEE Trans. Power Electron. 39, 5449–5461. [CrossRef] [Google Scholar]
- Halphen L., Panamá (2022) STATCOM in Panama – First application of this technology in Central America, in 2022 IEEE 40th Central America and Panama Convention (CONCAPAN), Panama, 9–12 November, IEEE. https://doi.org/10.1109/CONCAPAN48024.2022.9997695. [Google Scholar]
- Qiufan Y., Ting D., Hengxin H., Xia C., Fengbo T., Zhicheng Z., Yang X., C Shu. (2020) Model predictive control of MMC-UPFC under unbalanced grid conditions, Int. J. Elec. Power Energy Syst. 117, 105637. [CrossRef] [Google Scholar]
- Sen K.K., Mey L.S. (2021) Power flow control solutions for a modern grid using smart power flow controllers, IEEE Press, Piscataway, NJ, USA. [CrossRef] [Google Scholar]
- Gasim Mohamed S.E. (2020) Power flow control capability of the power transistor-assisted Sen transformer and the unified power flow controller: a close comparison, IET Gener. Transm. Distrib. 4, 15, 3033–3041. [CrossRef] [Google Scholar]
- Jerbić G. (2022) Application of phase shifting transformers in the Croatian power supply system, J. Energy Energija 56, 216–231. [CrossRef] [Google Scholar]
- Albrechtowicz P., Rozegnał B., Cisek P. (2022) Comparison of phase-shifting transformers properties, Energies 15, 17, 6224. https://doi.org/10.3390/en15176224 [CrossRef] [Google Scholar]
- Yu M., Yuan J., Li Z., Li F., Yang X., Zhang W., Xu S., Mei J. (2022) Power flow optimization and economic analysis based on high voltage phase shifting transformer, Energies 15, 2363. [CrossRef] [Google Scholar]
- Bu B., Han H., Zhou C., Feng J. (2021) Electromagnetic transient model of two-core Sen Transformer based on UMEC, Power Syst. Technol. 45, 3283–3290. [Google Scholar]
- Yang W., Pan Y., Qiu Z., Zhai G. (2023) Electromagnetic transient model and field-circuit coupling numerical calculation of Sen transformer based on finite-element method, Electr. Power Syst. Res. 214, 108941. [CrossRef] [Google Scholar]
- Bu L., Han S., Feng J., Pan Y. (2022) Unified magnetic equivalent circuit-based model of two-core Sen transformer for low-frequency electromagnetic transients and its numerical calculation, Int. J. Electrical Power Energy Syst. 141, 108184. [CrossRef] [Google Scholar]
- Li W., Han S., Guo X., Xie S., Rong N. (2023) A reluctance-based electromagnetic transient model for the Sen transformer with inter-turn fault, Int. J. Electrical Power Energy Syst. 155, 109606–109606. [Google Scholar]
- Zhang N., Li H., Jin X., Bi C., Wang J. (2025) Comparative study of voltage and control characteristics of two-core and single-core step-up/down thyristor-controlled phase-shifting transformers, Energies 18, 837. [CrossRef] [Google Scholar]
- Yan X., Peng W., Wang Y., Aslam W., Shao C., Li T. (2022) Flexible loop closing control method for an active distribution network based on dual rotary phase shifting transformers, IET Gener. Transm. Distrib. 16, 4204–4214. [CrossRef] [Google Scholar]
- Zhang J., Liu Y., Zhou J., Zang J., Shi G., Wang J., Li Y., Yang X. (2024) A novel multiport transformer-less unified power flow controller, IEEE Trans. Power Electron. 39, 4278–4290. [CrossRef] [Google Scholar]
Appendix
In equation (10), the expressions for each element of the open-circuit impedance matrix are presented as follows:
Let 
 .
.
Then each element of the open-circuit impedance matrix is


All Tables
Parameters of 220 kV dual power transmission system and the proposed topology in this paper.
All Figures
|
Fig. 1 The topology of the novel power flow control transformer. |
| In the text | |
|
Fig. 2 Schematic diagram of the output voltage phasor following compensation voltage application (a) the dual-core ST; (b) the topology proposed in this paper. |
| In the text | |
|
Fig. 3 The single-phase equivalent circuit diagram of the proposed topology in this paper. |
| In the text | |
|
Fig. 4 The simplified equivalent circuit of the proposed topology in this paper. |
| In the text | |
|
Fig. 5 Simplified equivalent model diagram of the proposed topology in this paper. |
| In the text | |
|
Fig. 6 220 kV dual power transmission system (a) Double-terminal transmission system based on simulation model; (b) Double-terminal transmission system based on simplified equivalent model. |
| In the text | |
|
Fig. 7 The change curve of the amplitude of the system voltage, phase angle and the amplitude of the compensating voltage (a) Phase A compensation voltage phasor diagram; (b) The change of system voltage amplitude after compensation with the phase of compensation voltage; (c) The change of system voltage phase angle after compensation with the compensation voltage phase; (d) The amplitude of compensation voltage varies with the phase of compensation voltage. |
| In the text | |
|
Fig. 8 The three-dimensional surface depict the relationship between power flow regulation quantity and compensation voltage. (a) The variation of active power flow regulation amount with compensation voltage; (b) The variation of reactive power flow regulation amount with compensation voltage. |
| In the text | |
|
Fig. 9 The curves depicting the relationship between power flow regulation and compensating voltage phase. (a) The variation of active power flow regulation amount with the phase of compensation voltage; (b) The variation of reactive power flow regulation amount with the phase of compensation voltage. |
| In the text | |
|
Fig. 10 The variation characteristics of short-circuit impedance of the power control transformer at different tap positions of the switch. |
| In the text | |
|
Fig. 11 Circuit wiring diagram and simulation test platform. (a) The circuit principle wiring diagram; (b) Simulated experiment platform. |
| In the text | |
|
Fig. 12 The measured waveforms of voltage and current in the test platform. (a) Phasor diagram of compensation voltage; (b) The measured waveforms of compensation voltage; (c) The measured waveforms of the sending-end voltage, receiving-end voltage and circuit current. |
| In the text | |
Current usage metrics show cumulative count of Article Views (full-text article views including HTML views, PDF and ePub downloads, according to the available data) and Abstracts Views on Vision4Press platform.
Data correspond to usage on the plateform after 2015. The current usage metrics is available 48-96 hours after online publication and is updated daily on week days.
Initial download of the metrics may take a while.