")
")
Open Access
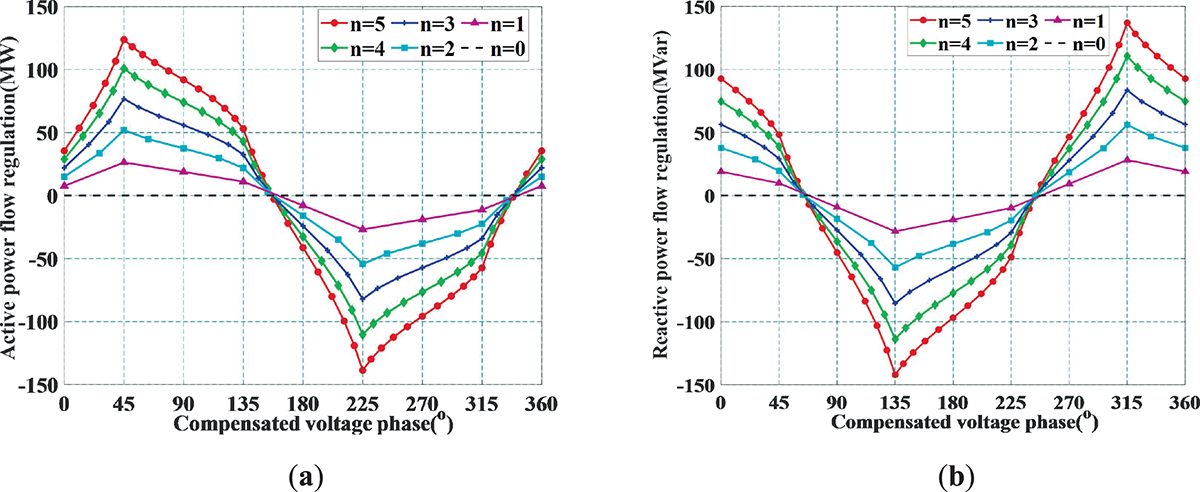
Fig. 9
Download original image
The curves depicting the relationship between power flow regulation and compensating voltage phase. (a) The variation of active power flow regulation amount with the phase of compensation voltage; (b) The variation of reactive power flow regulation amount with the phase of compensation voltage.
Current usage metrics show cumulative count of Article Views (full-text article views including HTML views, PDF and ePub downloads, according to the available data) and Abstracts Views on Vision4Press platform.
Data correspond to usage on the plateform after 2015. The current usage metrics is available 48-96 hours after online publication and is updated daily on week days.
Initial download of the metrics may take a while.