")
")
Open Access
Review
Fig. 8
Download original image
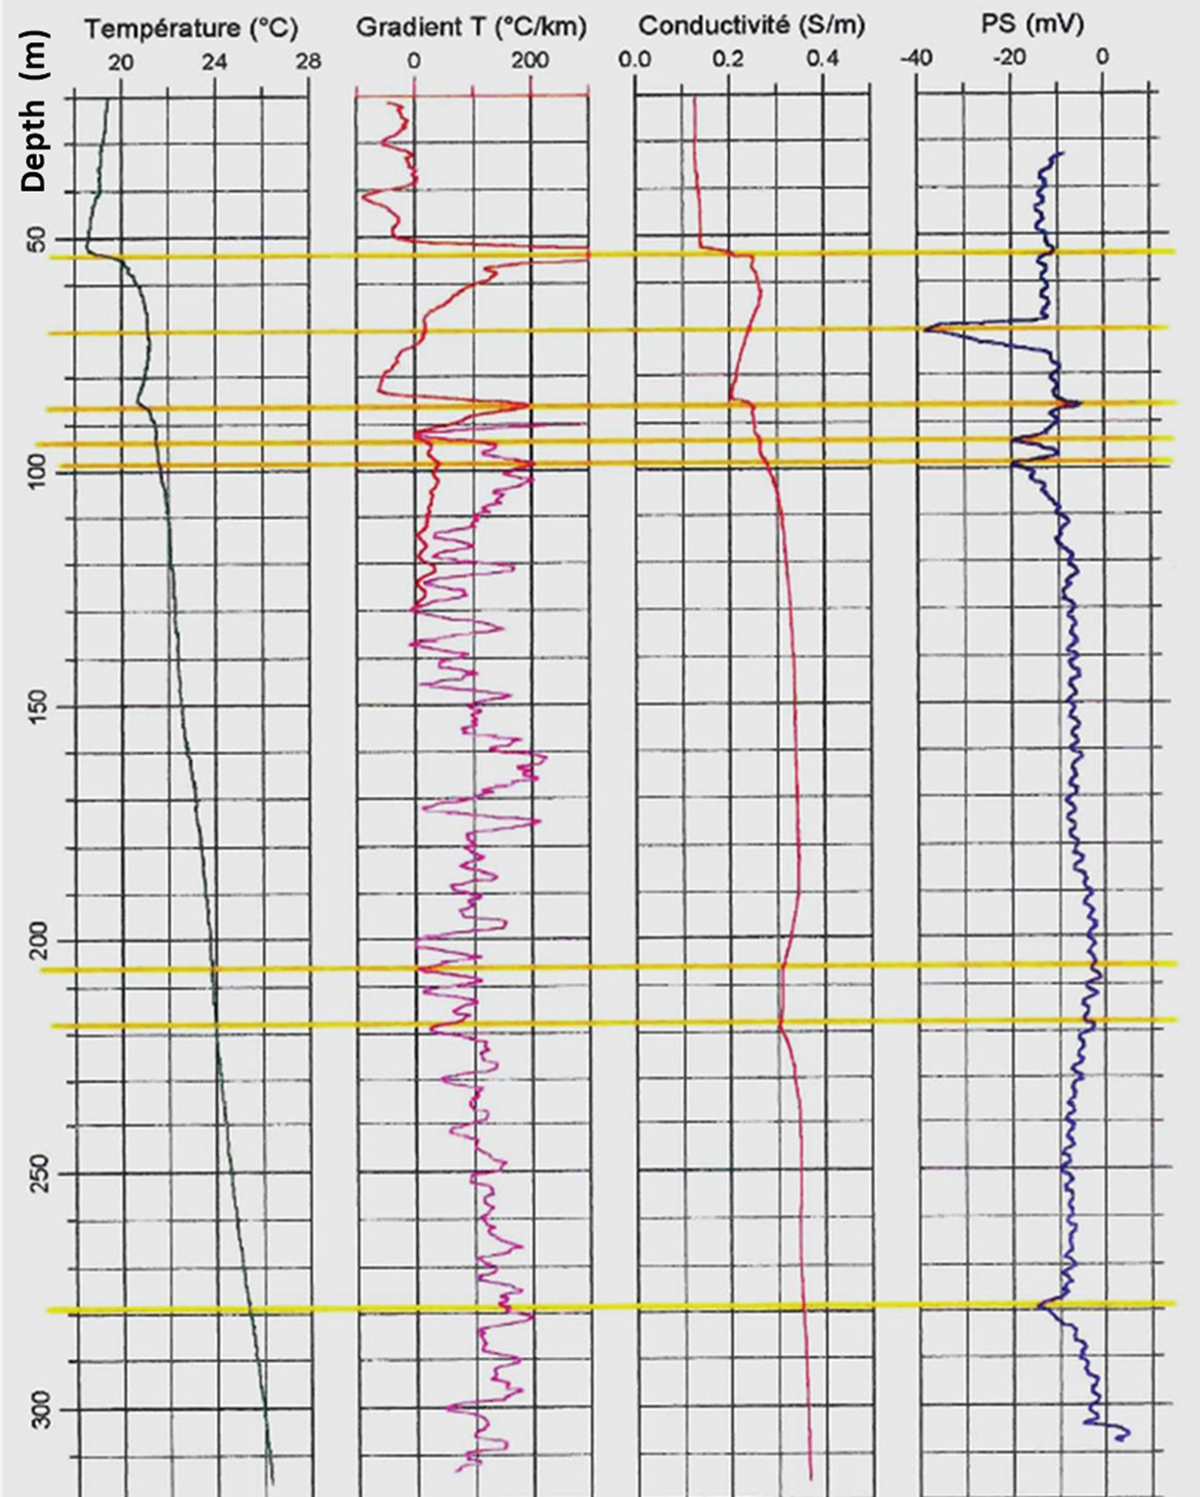
GPF-Ardèche, MM1 borehole, Wireline logs, in Measured Depth. Left to right: Celsius Temperature (Black), temperature gradient (magenta), Conductivity (red), SP (purple). The yellow bars underline the permeable depth levels of inflow or outflow.
Current usage metrics show cumulative count of Article Views (full-text article views including HTML views, PDF and ePub downloads, according to the available data) and Abstracts Views on Vision4Press platform.
Data correspond to usage on the plateform after 2015. The current usage metrics is available 48-96 hours after online publication and is updated daily on week days.
Initial download of the metrics may take a while.