")
")
| Issue |
Sci. Tech. Energ. Transition
Volume 81, 2026
Innovative Strategies and Technologies for Sustainable Renewable Energy and Low-Carbon Development
|
|
|---|---|---|
| Article Number | 10 | |
| Number of page(s) | 10 | |
| DOI | https://doi.org/10.2516/stet/2026005 | |
| Published online | 06 April 2026 | |
Regular Article
Cost-effective design of home energy management system with PV-wind and battery storage in a grid-tied microgrid
1
Centre for New Energy Transition Research (CfNETR), Federation University Australia, Mt. Helen, VIC 3353, Australia
2
School of Science, Engineering and Digital Technologies, University of Southern Queensland, Toowoomba, QLD 4350, Australia
3
Department of Electrical Engineering, College of Engineering, King Faisal University, Al-Ahsa 31982, Saudi Arabia
4
Department of Computer Science, Edith Cowan University, Joondalup WA 6027, Australia
5
School of Mechanical and Electrical Engineering, University of Electronic Science and Technology of China, PR China
* Corresponding author: This email address is being protected from spambots. You need JavaScript enabled to view it.
Received:
3
February
2025
Accepted:
28
January
2026
Abstract
The rising energy demand and the limited availability of traditional energy sources have driven the search for renewable energy alternatives. Over the past few years, more renewable energy sources and significant efforts have been carried out around the World to decrease carbon emissions in the utility sector. To support this development, microgrids have emerged as a smart component of the future power grid. Microgrids, powered by local energy resources, are the most effective for building the new power grid. In microgrids, an Energy Management System (EMS) is an essential element in scheduling the local energy flows. This paper focuses on the cost-effective design of home energy management in a grid-tied microgrid framework to reduce electricity consumption and the dependency on the utility grid for residential consumers. This scheme is synthesized through a simulator developed on a C++ platform to obtain the best energy management solutions. Three case studies with 10 residential users are considered in this research. Simulation results are provided to demonstrate the effectiveness of the proposed model. The proposed methods curtail the grid energy and cost up to 51% and 58%, respectively, in comparison to the current techniques.
Key words: Home Energy Management (HEM) / Solar PV system / Wind turbine / Battery storage system (BSS) / Utility grid / Electricity cost
© The Author(s), published by EDP Sciences, 2026
 This is an Open Access article distributed under the terms of the Creative Commons Attribution License (https://creativecommons.org/licenses/by/4.0), which permits unrestricted use, distribution, and reproduction in any medium, provided the original work is properly cited.
1 Introduction
The incorporation of alternate-source of energy (renewable energy) into residential buildings is becoming increasingly important to address rising energy demands and minimize environmental pollution. Recent studies indicate that energy consumption in the residential sector accounts for over one-third of total electricity usage. To address these high energy demands, many governments are promoting the generation of renewable energy within households, benefiting both consumers and utility providers. Residential households consist of a Home Energy Management (HEM) system, which is known as a smart home. The HEM system is crucial in these smart homes, as it efficiently manages the operation of all household appliances [1–4]. The successful development of smart homes requires advanced metering infrastructure, as well as two-way communication, information, and control technologies [5–6]. For multi-objective home energy management, the reference [7] suggests a Robust Hybrid-Stochastic (RHS) optimization strategy that takes user comfort into account while resolving uncertainties in PV output, EV charging/discharging behavior, and real-time pricing. The method’s ability to balance comfort and economic objectives under different levels of uncertainty is validated by case studies. For further optimization, there is still a research gap in integrating other developing distributed energy resources and investigating more dynamic user behavior patterns. In order to save expenses, improve grid reliability, and avoid transformer overloading, a fuzzy logic-based real-time energy management control system for smart homes is proposed in [8]. It optimizes EV charging and discharging, PV utilization, and grid power usage. The scalability and adaptability of the suggested controller across various grid topologies and locations with varied amounts of renewable integration remain unexplored. The reference [9] addresses the issues of fluctuating renewable energy generation by introducing a real-time optimal control technique for the HEM system, combining Adaptive Dynamic Programming (ADP) and predictive scheduling.
Research in [10] aims to optimize energy and reduce the total cost of distributed generators, curtail environmental emission, and improve the penetration level of renewable energy sources. A HEM controller was discussed in the literature [11] to reduce utility tariffs and minimize the peak-to-average ratio. An advanced energy management system for efficient microgrid operations was discussed in [12]. In a smart grid framework, an energy and cost minimization scheme was developed in [13] to optimize utility tariffs. Authors in [14] established an energy management system aiming to minimize the total operating cost of grid-connected microgrids for academic buildings. A comprehensive research work was carried out in [15] on a microgrid system to share surplus power with neighboring microgrids to achieve mutual cost-effective operation. Authors in [16] studied an energy management system (EMS) to minimize operational costs, peak load, and emissions. Researchers in [17] established a power distribution system in the smart grid framework to reduce peak loads and extreme power line losses in the power network. An optimal energy management at the distributed level of a microgrid system is achieved in [18] using multi-agent systems. For the best industrial microgrid scheduling [19], suggested a revolutionary techno-economic risk-averse approach that takes into account both technical and financial goals. Research in [20] analyzed power and energy management for synchronous microgrid operation that reduces energy losses and operating costs. Authors in [21] developed an intelligent scheduling plan for a hybrid microgrid to minimize the energy cost. A bat algorithm is also proposed in this literature to minimize the nonlinearity and complex nature problem of renewable energy sources. In order to facilitate the seamless functioning of interconnected microgrids, a hierarchical stochastic energy management system was presented in [22].
Despite significant advancements in Home Energy Management (HEM) systems for grid-tied microgrid frameworks, several critical research gaps remain unaddressed. Many existing studies fail to integrate emerging Distributed Energy Resources (DERs) and adequately model dynamic user behavior patterns, both of which are essential for optimizing HEM performance. Additionally, the scalability and adaptability of these systems across various grid configurations and renewable integration levels are not sufficiently explored. While predictive modeling techniques, such as Gated Recurrent Unit (GRU) neural networks, have shown promise, their accuracy in forecasting photovoltaic power generation can be further enhanced by incorporating additional environmental variables like temperature and radiation intensity. Furthermore, the design of ideal power-sharing algorithms to effectively balance energy resources and minimize operational costs has received limited attention. Lastly, economic and environmental considerations, including strategies to reduce operational costs, peak loads, emissions, and power line losses, are not comprehensively addressed in current research. Addressing these gaps is essential for developing efficient, cost-effective, and sustainable HEM systems.
This paper makes significant contributions to advancing Home Energy Management (HEM) systems in grid-tied microgrid frameworks. It proposes a robust and cost-effective power-sharing algorithm to reduce dependency on grid electricity. By effectively utilizing RES and storage systems, the proposed method minimizes utility tariffs and reduces grid energy consumption, enhancing energy efficiency and economic savings for residential customers. Unlike previous works, this research evaluates the combined impact of solar, wind, and BSS with multiple microgrid parameters, providing a comprehensive approach to energy optimization. Simulation results demonstrate a substantial reduction in grid electricity usage, achieving a decrease of up to 51% and 58% compared to existing methods. This study not only addresses critical gaps in energy management for residential applications but also sets a foundation for future research to incorporate advanced planning parameters and improve integrated component models in microgrid systems.
This article is organized as follows. The proposed microgrid architecture is explained in Section 2. Microgrid components modeling, mathematical modeling of a microgrid system, and simulation and proposed algorithm are outlined in Section 3. The simulation results and analysis of different scenarios are given in Section 4. Finally, the conclusion of this research is presented in Section 5.
2 Problem description
Aiming to lower the electricity bills, this study represents an energy management scheme for home users integrating alternative sources of energy (PV-Wind) and battery storage systems. The system includes a residential photovoltaic (PV) and wind turbine installation that generates power for household appliances. Energy from the PV-Wind system is stored in a Battery Storage System (BSS) for household appliances. The main objectives of this research are to reduce residential electricity expenses and secure the optimal design of the HEM system. Figure 1 represents the proposed microgrid architecture.
 |
Fig. 1 Proposed microgrid architecture. |
The size of a battery, solar system, and wind turbine is designed based on the load profile of a group of residential users. The main grid performs as a utility operator that supplies electric power to the consumers according to their demands. Renewable energy produces clean and green energy, aiming to reduce excessive carbon emissions. Moreover, efficient use of Renewable Energy Sources (RES) reduces the burden on the main grid in grid-connected operations. Moreover, RES integration with the main grid confirms a more sustainable energy flow. With the presence of sufficient sunlight, a PV solar system can produce a good amount of electricity throughout the day.
Meanwhile, with proper wind velocity wind generator generates sufficient electricity during the day as well as during the night. To minimize sudden electrical shutdown throughout the network Battery Energy System (BES) protects against the faults. The average load of this MG system is 2.0 kWh for 24 h duration. Moreover, to prolong the battery lifetime we consider the battery discharge rate is 60%, and the nominal battery capacity is 8 kWh [23, 24]. To support an average load of 2.0 kWh for 4 h, 8 kWh battery performs better assuming the power from the PV panel is unavailable during this time. An Energy Management System (EMS) is incorporated into this system to perform and coordinate efficient energy distribution to all community users.
3 Microgrid component modeling
3.1 Solar PV system
Renewable Energy (RE) from solar and wind sources is key to achieving sustainable power generation for a microgrid. Solar energy output depends on solar irradiation, with higher sunlight intensity leading to greater energy production. Wind energy generation relies on wind speed, as turbine efficiency and power output increase with stronger and steadier winds. The variability of solar irradiation and wind speed necessitates effective forecasting and grid integration to ensure a stable energy supply. Figure 2 shows typical solar irradiation variation over time. Solar power generation can be expressed in terms of equation (1): (1)where A is the total area of the solar panel in square meters, ηsolar is the percentage efficiency of the solar panel, H is the average solar irradiation on the solar panel without shading, and PR is the performance ratio [25, 26].
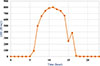 |
Fig. 2 Solar irradiation over a period of 24 h. |
3.2 Wind turbine
Wind energy is a sustainable and eco-friendly source of power, harnessed directly from natural wind flows. The production of wind energy is inherently variable, as it relies on the unpredictable nature of wind patterns [27, 28]. The mechanics involve converting kinetic energy from the wind into electrical energy using wind turbines. The turbine’s blades generate lift, causing them to rotate, and this rotational energy is transferred via a shaft to a generator, producing electricity. The energy output is typically determined by the turbine’s power curve, which relates wind speed to the corresponding power generation capacity. Figure 3 visualizes wind speed variation over time. The equation (2) describes the power output (Pwind) of a wind turbine as a function of wind speed (vwind). The turbine generates no power when the wind speed is below the cut-in speed (vcut) or above the cut-off speed (voff). Between the cut-in speed and the rated speed (vrated), the power output increases with the cube of wind speed, while at and above the rated speed, the turbine operates at its maximum rated power (Prated) until the cut-off speed. (2)
(2)
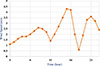 |
Fig. 3 Wind velocity over a period of 24 h. |
3.3 Battery storage system
In this research, we have considered a bank of lead-acid batteries to store energy. The reason behind this is due to high availability and low price [29]. Many researchers state that the lead acid battery has a charging efficiency of almost 65–85%, whereas the discharging efficiency is 100%. To sustain the lifespan of the battery, a minimum discharge capacity of 50% has been shown. The appliances under consideration are expected to be able to use no more than 50% of the household’s full power at any given time t [30].
3.4 Load and utility grid
In this section, we explain the load and utility grid. Figure 4 outlines three typical daily load profiles of a microgrid system. Peak load is around 3.0 kW, whereas the average and minimum load is 2.0 kW and 1.0 kW, respectively.
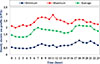 |
Fig. 4 Hourly average electricity use profile of MG users. |
The essential household appliances include items such as fans, lights, televisions, washing machines, refrigerators, and computers, among others. The load pattern continuously varies with time [31]. This study simplifies the load model by aggregating identical loads. Adopting a grid-connected community microgrid structure in an area where renewable energy systems are encouraged by the government allows for smooth energy exchange with the grid without transmission limitations. Stakeholders in the area can help keep energy costs down by putting money into renewable energy systems that power local homes and businesses.
3.5 Mathematical modelling of an MG system
Mathematical modelling means how the microgrid system copes with the power grid, home appliances, energy consumption, user preferences, and finally, home user comfort level understanding. We have considered here as an alternative source of energy, a photovoltaic solar system, and a wind turbine. Additionally, we have also considered a battery storage system for energy storage facilities for future use while all generation is blacked out. We can define renewable energy generation by the given equation: (3)
(3)
where P RE represents renewable power, P Solar indicates the solar power, and P Wind describes wind power.
 (4)where P
User defines the total user power allocation for the residential consumers. In addition, P
BATT represents the battery power storage.
(4)where P
User defines the total user power allocation for the residential consumers. In addition, P
BATT represents the battery power storage.
 (5)where P
Load indicates the total load power, and PL, PF, PT, PC, PW, and PR represent the lighting power, power consumed by a fan, television, computer, washing machine, and refrigerator, respectively.
(5)where P
Load indicates the total load power, and PL, PF, PT, PC, PW, and PR represent the lighting power, power consumed by a fan, television, computer, washing machine, and refrigerator, respectively.
 (6)
(6)
 (7)where PEXTRA represents the extra power taken from the utility grid, PRE is the power of renewable energy, PBAT is the battery power, and PLOAD is the load power. Similarly, PEX_COST defines the extra power cost, and PTARIFF illustrates the utility tariff. Equation (14) outlines the hourly power consumption.
 (8)where P
TNH accounts for the total number of hours. P
H signifies power consumption by the microgrid user per hour. Daily power consumption and relevant cost are detailed using equation (6) below:
(8)where P
TNH accounts for the total number of hours. P
H signifies power consumption by the microgrid user per hour. Daily power consumption and relevant cost are detailed using equation (6) below: (9)where P
D accounts for the power usage made by the user on a daily basis, and n is the total number of days. Weekly power consumption can be formulated by the given equation:
(9)where P
D accounts for the power usage made by the user on a daily basis, and n is the total number of days. Weekly power consumption can be formulated by the given equation: (10)where P
W
accounts for the power usage made by the user over a week, and n is the total number of weeks. Monthly power consumption can be estimated by the given equation:
(10)where P
W
accounts for the power usage made by the user over a week, and n is the total number of weeks. Monthly power consumption can be estimated by the given equation: (11)where P
M
accounts for the power usage made by the user over a month, and n is the total number of months. Yearly power consumption can be estimated by the given equation:
(11)where P
M
accounts for the power usage made by the user over a month, and n is the total number of months. Yearly power consumption can be estimated by the given equation: (12)where P
Y
accounts for the power usage made by the user over a year, and n is the total number of years.
(12)where P
Y
accounts for the power usage made by the user over a year, and n is the total number of years.
3.6 Proposed algorithm
In this section, we describe the simulation and the proposed power-sharing algorithm for a grid-connected microgrid. A detailed and effective algorithm is proposed, which outlines the step-by-step simulation execution process among the home users through the community microgrid.
3.6.1 Proposed power allocating flowchart
In this section, a power allocating flow chart is outlined with a step-by-step approach on how power is shared for the household loads for the whole community of the microgrid. The aim of this process is to reduce the grid energy usage among community users. Power grid, renewable energy sources, and battery storage systems are the key elements of this energy flow process. Figure 5 represents the power allocation flow chart for the whole simulation process. The main goal of this process is to indicate the power allocation for the residential consumers, both from renewable energy sources, considering battery storage, and from the power grid. This power allocation process effectively utilizes the renewable energy generation and battery storage system along with the power supplier (grid power) [32].
-
When the household loads become greater than or equal to the renewable energy generation, then household loads or home appliances will receive power from the battery storage system. Otherwise, the home user will take power from the renewable energy sources.
-
If the home appliances load becomes greater than or equal to the renewable energy generation and battery storage system, then the home user will receive power from the power grid. Otherwise, the home user will take power from the renewable energy sources and battery storage.
-
If the power grid is in the off-peak periods, then charge battery storage from the power grid. Otherwise, the home user will receive power from the renewable energy sources and battery storage.
-
If the power grid is in the on-peak periods, then discharge battery storage power to support the household loads. Otherwise, the home user will receive power from the renewable energy sources and battery storage.
-
If iteration ≥ I, then stop the simulation process. Otherwise, continue the iteration process until I.
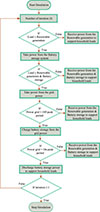 |
Fig. 5 Optimal power allocation flow chart. |
4 Simulation results and discussion
This section presents the results analysis based on the simulation. Three scenarios have been considered for this research. Each scenario has an individual power management ability. Figure 6 illustrates the flow chart of the result analysis methodology of this research. In the existing scenario, the consumers are supplied with electrical energy through the utility grid only. However, proposed 1 scenario supplies energy through wind, solar, and the local utility grid. Moreover, the proposed 2 scenarios ensure energy continuity through wind, solar, utility grid, and battery storage systems. If the number of iterations meets the simulation iteration numbers, then stop the simulation process. Otherwise, continue the simulation to execute and output the results. Simulation parameters are depicted in Table 1.
 |
Fig. 6 Flow chart of the result analysis methodology. |
Figure 7 illustrates the hourly electricity use profile of a residential consumer in kWh. To present a more realistic way the graph shows an hourly basis electricity consumption profile. Three different line graphs indicate individual significance. For example, the blue line presents the lowest electricity consumption whereas the red line shows the highest consumption. Moreover, the green line indicates the average electricity use profile.
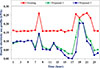 |
Fig. 7 Hourly electricity consumption profile of MG users within three scenarios. |
Figure 8 illustrates the comparison between grid electricity use and grid electricity, along with renewable electricity use such as wind and PV solar systems. Grid electricity is supplied by several utility operators, and consumers can use it according to their demand. However, renewable energy sources such as small-scale wind turbines and photovoltaic solar systems can generate electricity to support residential users along with grid electricity. In this way, users can minimize grid electricity use and save on excessive utility costs. According to the above Figure 8, the proposed 1 scenario uses 51% less grid electricity and cost compared to the existing scenario, which is reported in Table 2.
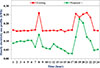 |
Fig. 8 Comparison of hourly electricity use between existing and proposed 1 scenario. |
Percentage of less grid electricity consumption and cost profile among two scenarios.
Figure 9 outlines the comparison of the hourly electricity use profile between the existing scenario and the proposed 2 scenarios. The existing scenario consumes electricity from the utility grid only. However, the proposed 2 scenario receives electricity from the utility grid, renewable energy, and battery storage systems. For this reason, proposed 2 can save more energy and money for residential customers. From Figure 9, the proposed 2 scenario consumes 58% less grid electricity and cost compared to the existing scenario, which is reported in Table 3.
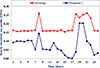 |
Fig. 9 Comparison of hourly electricity use between existing and proposed 2 scenarios. |
Percentage of less grid electricity consumption and cost profile between two scenarios.
Figure 10 describes the daily electricity consumption patterns of community microgrid users over a period of one week. Here, the user takes maximum electricity from the power grid; consequently, solar and wind generators support the home user to minimize the electricity tariffs. Moreover, a bank of battery storage systems relates to all users as backup and continuous support while all other sources are unable to meet the energy requirements. In such a way, we can estimate the daily electricity use profile that is only grid cuts the highest electricity consumption, besides the grid with PV-wind consumes a bit lower electricity due to renewable generation. However, the grid with PV-wind-battery takes the lowest electricity because of additional battery storage.
 |
Fig. 10 Daily electricity consumption profile for microgrid users within three scenarios. |
Figure 11 illustrates a graphical representation and comparative analysis between electricity and cost to get a clear idea of how electricity consumption and cost can be curtailed by utilizing renewable energy sources and battery storage devices. The line graph goes down gradually due to a significant reduction in electricity consumption and a lowering of the electricity prices. The aid of renewable energy and battery storage systems in the proposed microgrid system reduces the grid electricity use a lot. The numerical value is 51% and 58% compared to the existing scenario reported in Tables 4 and 5.
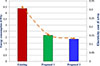 |
Fig. 11 Comparison of electricity use and cost for microgrid users within three scenarios. |
Percentage of less grid electricity use and cost profile among three scenarios.
Comparison of average electricity consumption and cost profile among three scenarios.
The above Figure 12 explains the daily, weekly, and monthly electricity consumption patterns of microgrid users and presented in Table 6. Based on the use of home appliances and electric devices, the utility operator prepares the electricity bills. The standard billing procedure is weekly or monthly around the globe. To get a clear idea of microgrid users’ billing, we fix a graphical representation. Over the line graph, there are three different lines bearing individual meaning, such as grid energy, grid with Renewable Energy Sources (RESs), and grid energy, RESs, and battery storage system.
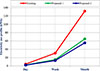 |
Fig. 12 Comparison of daily, weekly, and monthly electricity use profiles. |
Comparison of daily, weekly, and monthly electricity use within three scenarios.
Figure 13 describes the daily, monthly, and annual electricity consumption profile to get a clear concept of how utility tariffs impact our daily expenditure as well as monthly and annual which reported in Table 7. Without electrification, human civilization would never possible; thus, energy optimization is essential to curtail the total utility tariffs.
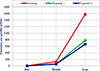 |
Fig. 13 Comparison of daily, monthly, and yearly electricity use of MG users. |
Comparison of daily, monthly, and yearly electricity use within three scenarios.
4.1 Discussion
This section describes the complete energy and cost reduction capabilities for residential microgrid users, along with less grid dependency based on several case scenarios. The Existing scenario cannot minimize energy and cost because of the lack of renewable energy sources and battery storage facilities. On the other hand, proposed 1 and proposed 2 scenarios reduce the grid electricity usage at a significant level, considering solar, wind, and battery storage systems. The percentage of less grid energy usage is tabulated in Table 8 and depicted in Figure 14.
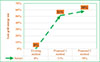 |
Fig. 14 Comparison of % less grid energy use within three scenarios. |
Percentage of less grid electricity use among three approaches.
Figure 14 represents the comparison of electricity consumption from different sources for three scenarios. The most important and vital issue is to find a cost-effective solution by comparing three scenarios in the microgrid framework.
Moreover, it is also our great concern in this research to minimize the dependency on the grid electricity use and maximize the use of renewable energy sources. Because renewable energy is most likely free and environmentally friendly, it requires some initial investment. Currently, rooftop solar panels are popular and can produce sufficient electricity to power small household appliances. Proposed 1 scenario can reduce 51% grid energy usage, and proposed scenario 2 can 58%, respectively.
5 Conclusion
This paper presents a cost-effective home energy management system for a grid-tied microgrid. The proposed system successfully reduces electricity consumption from the utility grid while maximizing the utilization of PV-Wind systems and battery storage, thereby minimizing the total cost for residential customers. The performance of the microgrid, including the contributions of solar, wind, and battery storage systems, was thoroughly evaluated under various parameters. The results demonstrate that by efficiently utilizing renewable energy sources and storage systems, the dependency on grid electricity can be significantly reduced. The proposed methods achieved reductions in grid energy consumption by up to 51% and 58% compared to the existing approaches. Future work will focus on improving the accuracy of key planning parameters for the microgrid and enhancing the models of integrated components to further optimize the system’s performance.
References
- Hu J., Shan Y., Yang Y., Parisio A., Li Y., Amjady N., Islam S., Cheng K.W., Guerrero J.M., Rodríguez J. (2024) Economic model predictive control for microgrid optimization: A review, IEEE Trans Smart Grid 15, 1, 472–484. [Google Scholar]
- Hong Y.-Y., Chang W.-C., Chang Y.-R., Lee Y.-D., Ouyang D.-C. (2017) Optimal sizing of renewable energy generations in a community microgrid using Markov model, Energy 135, 68–74. [Google Scholar]
- Yi P., Dong X., Iwayemi A., Zhou C., Li S. (2013) Real-time opportunistic scheduling for residential demand response, IEEE Trans. Smart Grid 4, 1, 227–234. [Google Scholar]
- Hu J., Zhu J., Platt G. (2011) Smart grid – The next generation electricity grid with power flow optimization and high power quality, in 2011 International Conference on Electrical Machines and Systems, Vol. 20–23, pp. 1–6. [Google Scholar]
- Xiong B., Wei F., Wang Y., Xia K., Su F., Fang Y., Gao Z., Wei Z. (2024) Hybrid robust-stochastic optimal scheduling for multi-objective home energy management with the consideration of uncertainties, Energy 290, 130047. [Google Scholar]
- Usman H.M., ElShatshat R., El-Hag A.H. (2025) Energy management for smart residential homes: A real-time fuzzy logic approach, Electric Power Systems Research 238, 111057. [Google Scholar]
- Yuan J., Zeng X., Zhou J., Li J., Lv J., Chen R., Chen K., Yang W., Zhang Y. (2025) Data-driven real-time home energy management system based on adaptive dynamic programming, Electric Power Syst. Res. 238, 111055. [Google Scholar]
- Tooryan F., Hassanzadeh Fard H., Collins E.R., Jin S., Ramezani B. (2020) Optimization and energy management of distributed energy resources for a hybrid residential microgrid, J. Energy Storage 30, 101556. [Google Scholar]
- Javaid N., Naseem M., Rasheed M.B., Mahmood D., Khan S.A., Alrajeh N., Iqbal Z. (2017) A new heuristically optimized Home Energy Management controller for smart grid, Sustain. Cities Soc. 34, 211–227. [Google Scholar]
- Lee E.K., Shi W., Gadh R., Kim W. (2016) Design and implementation of a microgrid energy management system, Sustain. 8, 11, 1–19. [Google Scholar]
- Rashid M.M., Ur M., Hasan M.M. (2018) Simulation based energy and cost optimization for home users in a community smart grid, Int. J. Renew. Energy Res. 8, 3, 1281–1287. [Google Scholar]
- Tayab U.B., Lu J., Yang F., Islam M., Zia A., Hossain J.(2019) Microgrid energy management system for academic building, in 2019 29th Australas. Univ. Power Eng. Conf. AUPEC. [Google Scholar]
- Islam M., Yang F., Amin M. (2021) Control and optimisation of networked microgrids: A review, IET Renew. Power Gener. 15, 6, 1133–1148. [Google Scholar]
- Shayeghi H., Shahryari E., Moradzadeh M., Siano P. (2019) A survey on microgrid energy management considering flexible energy sources, Energies 12, 11. [Google Scholar]
- Qi W., Palacios T.R., Granelli F. (2013) A novel architecture for the distribution section of smart grid with renewable sources and power storage, in Proceedings of the Twenty-Third International Conference on Computer Communications and Networks. [Google Scholar]
- Khan M.W., Wang J., Ma M., Xiong L., Li P., Wu F. (2019) Optimal energy management and control aspects of distributed microgrid using multi-agent systems, Sustain. Cities Soc. 44, 855–870. [Google Scholar]
- Daneshvar M., Eskandari H., Sirous A.B., Esmaeilzadeh R. (2021) A novel techno-economic risk-averse strategy for optimal scheduling of renewable-based industrial microgrid, Sustain. Cities Soc. 70, 102879. [Google Scholar]
- Parol M., Wójtowicz T., Księżyk K., Wenge C., Balischewski S., Arendarski B. (2020) Optimum management of power and energy in low voltage microgrids using evolutionary algorithms and energy storage, Int. J. Electr. Power Energy Syst. 119, 105886. [Google Scholar]
- Esapour K., Abbasian M., Saghafi H. (2021) Intelligent energy management in hybrid microgrids considering tidal, wind, solar and battery, Int. J. Electr. Power Energy Syst. 127, 106615. [Google Scholar]
- Bazmohammadi N., Tahsiri A., Anvari-Moghaddam A., Guerrero J.M. (2019) A hierarchical energy management strategy for interconnected microgrids considering uncertainty, Int. J. Electr. Power Energy Syst. 109, 597–608. [Google Scholar]
- Adika C.O., Wang L. (2014) Smart charging and appliance scheduling approaches to demand side management, Int. J. Electr. Power Energy Syst. 57, 232–240. [Google Scholar]
- Arun S.L., Selvan M.P. (2018) Intelligent residential energy management system for dynamic demand response in smart buildings, IEEE Syst. J. 12, 2, 1329–1340. [Google Scholar]
- Tooryan F., Collins E.R. (2018) Optimum size and placement of distributed generators in microgrid based on reliability concept, in 2018 IEEE Power and Energy Conference at Illinois (PECI), pp. 1–6. [Google Scholar]
- Hassanzadeh Fard H., Jalilian A. (2018) Optimal sizing and location of renewable energy based DG units in distribution systems considering load growth, Electr. Power Energy Syst. 101, 356–370. [Google Scholar]
- Justus C.G. (1978) Wind energy statistics for large arrays of wind turbines (New England and Central U.S. Regions), Sol. Energy 20, 5, 379–386. [Google Scholar]
- Farrugia R.N. (2003) The wind shear exponent in a Mediterranean island climate, Renew. Energy 28, 4, 647–653. [CrossRef] [Google Scholar]
- Dürr M., Cruden A., Gair S., McDonald J.R. (2006) Dynamic model of a lead acid battery for use in a domestic fuel cell system, J. Power Sources 161, 2, 1400–1411. [CrossRef] [Google Scholar]
- Leadbetter J., Swan L. (2012) Battery storage system for residential electricity peak demand shaving, Energy Build. 55, 685–692. [Google Scholar]
- Liu D., Xu Y., Wei Q., Liu X. (2018) Residential energy scheduling for variable weather solar energy based on adaptive dynamic programming, IEEE/CAA J. Autom. Sin. 5, 1, 36–46. [Google Scholar]
- Al Essa M.J.M. (2018) Management of charging cycles for grid-connected energy storage batteries, J. Energy Storage 18, 380–388. [Google Scholar]
- Mohsenian-Rad A.H., Wong V.W.S., Jatskevich J., Schober R. (2010)Optimal and autonomous incentive-based energy consumption scheduling algorithm for smart grid, in Innovative Smart Grid Technologies Conference, ISGT. [Google Scholar]
- Lokeshgupta B., Sivasubramani S. (2019) Multi-objective home energy management with battery energy storage systems, Sustain. Cities Soc. 47, 101458. [Google Scholar]
- Hossain M.A., Pota H.R., Squartini S., Abdou A.F. (2019) Modified PSO algorithm for real-time energy management in grid-connected microgrids, Renew. Energy 136, 746–757. [Google Scholar]
- Hossain M.A., Pota H.R., Squartini S., Zaman F., Guerrero J.M. (2019) Energy scheduling of community microgrid with battery cost using particle swarm optimisation, Appl. Energy 254, 113723. [Google Scholar]
All Tables
Percentage of less grid electricity consumption and cost profile among two scenarios.
Percentage of less grid electricity consumption and cost profile between two scenarios.
Comparison of average electricity consumption and cost profile among three scenarios.
All Figures
|
Fig. 1 Proposed microgrid architecture. |
| In the text | |
|
Fig. 2 Solar irradiation over a period of 24 h. |
| In the text | |
|
Fig. 3 Wind velocity over a period of 24 h. |
| In the text | |
|
Fig. 4 Hourly average electricity use profile of MG users. |
| In the text | |
|
Fig. 5 Optimal power allocation flow chart. |
| In the text | |
|
Fig. 6 Flow chart of the result analysis methodology. |
| In the text | |
|
Fig. 7 Hourly electricity consumption profile of MG users within three scenarios. |
| In the text | |
|
Fig. 8 Comparison of hourly electricity use between existing and proposed 1 scenario. |
| In the text | |
|
Fig. 9 Comparison of hourly electricity use between existing and proposed 2 scenarios. |
| In the text | |
|
Fig. 10 Daily electricity consumption profile for microgrid users within three scenarios. |
| In the text | |
|
Fig. 11 Comparison of electricity use and cost for microgrid users within three scenarios. |
| In the text | |
|
Fig. 12 Comparison of daily, weekly, and monthly electricity use profiles. |
| In the text | |
|
Fig. 13 Comparison of daily, monthly, and yearly electricity use of MG users. |
| In the text | |
|
Fig. 14 Comparison of % less grid energy use within three scenarios. |
| In the text | |
Current usage metrics show cumulative count of Article Views (full-text article views including HTML views, PDF and ePub downloads, according to the available data) and Abstracts Views on Vision4Press platform.
Data correspond to usage on the plateform after 2015. The current usage metrics is available 48-96 hours after online publication and is updated daily on week days.
Initial download of the metrics may take a while.