")
")
| Issue |
Sci. Tech. Energ. Transition
Volume 81, 2026
Enabling Technologies for the Integration of Electrical Systems in Sustainable Energy Conversion
|
|
|---|---|---|
| Article Number | 9 | |
| Number of page(s) | 14 | |
| DOI | https://doi.org/10.2516/stet/2026006 | |
| Published online | 10 April 2026 | |
Regular Article
Electric vehicle battery thermal management using hybrid heat pipe-cold plate cooling system
Laboratoire Matériaux, Mesures et Applications (LR11ES25), Institut National des Sciences Appliquées et de Technologie (INSAT), University of Carthage, Centre Urbain Nord, BP N° 676, 1080 Tunis, Tunisia
* Corresponding author: This email address is being protected from spambots. You need JavaScript enabled to view it.
Received:
25
April
2025
Accepted:
28
January
2026
Abstract
This study investigates the thermal performance of a hybrid Battery Thermal Management System (BTMS) designed for electric vehicles, which integrates both a heat pipe and a cold plate for enhanced heat dissipation. The experimental results demonstrate that the system is capable of effectively dissipating heat input powers up to 40 W while maintaining the battery module temperature below the critical safety threshold of 60 °C. The BTMS leverages the high thermal conductivity and passive operation of heat pipes, coupled with the efficient convective cooling provided by the water-cooled cold plate. Comprehensive thermal characterization is performed through both Computational Fluid Dynamics (CFD) simulations and infrared thermography, allowing for precise analysis of heat transfer phenomena within the system. The simulation results closely match the experimental infrared measurements, confirming the reliability and predictive capability of the numerical model. These findings underscore the system’s potential for ensuring temperature uniformity and thermal safety in next-generation electric vehicle batteries. Moreover, the integrated hybrid cooling solution provides a promising pathway toward scalable and compact BTMS architectures, meeting the evolving requirements for performance, reliability, and energy efficiency in electric mobility applications.
Key words: Battery thermal management / Electric vehicle / Heat pipes / Cold plates
© The Author(s), published by EDP Sciences, 2026
 This is an Open Access article distributed under the terms of the Creative Commons Attribution License (https://creativecommons.org/licenses/by/4.0), which permits unrestricted use, distribution, and reproduction in any medium, provided the original work is properly cited.
1 Introduction
Thermal instabilities significantly impact the performance, safety, and lifespan of lithium-ion (Li-ion) batteries, especially as energy density and charging rates increase to meet the growing demands of Electric Vehicles (EVs). These batteries are engineered to operate optimally within a narrow temperature range of 25 °C to 40 °C, ensuring high efficiency and durability [1]. Deviation from this range leads to undesirable effects: low temperatures increase internal resistance, reducing energy output and vehicle performance; high temperatures may momentarily boost performance but drastically accelerate material degradation [2–6].
One of the most critical safety issues is thermal runaway, a self-reinforcing reaction that may occur when the battery exceeds 60 °C. This phenomenon can result in fire or explosion, emphasizing the importance of robust and reliable Battery Thermal Management Systems (BTMS) to regulate cell temperatures during charging, discharging, and under high external thermal loads [1–6]. It is estimated that a single battery cell can produce around 25 W of heat during normal operation, which can accumulate rapidly in compact battery modules if not efficiently dissipated [3].
To date, air and liquid cooling systems have been the most commercially adopted strategies. Air cooling is simple but generally insufficient for high-performance EVs due to air’s low thermal capacity. Liquid cooling systems, by contrast, offer higher heat removal rates and better thermal uniformity. Their compact design and adaptability make them ideal for integrated applications [2]. However, these systems are often complex, involving multiple junctions and channels prone to leakage. Additionally, the presence of dielectric fluids or coolant mixtures raises concerns regarding environmental sustainability and maintenance requirements [4–7].
To overcome these limitations, researchers are increasingly turning to alternative and hybrid cooling technologies. Among the most promising are systems that incorporate heat pipes – passive devices that transport heat through phase change and capillary action [8–13]. Heat pipes offer exceptionally high effective thermal conductivities, can operate without moving parts, and have a lifespan exceeding 15 years, making them attractive for automotive thermal management [3–5]. Their ability to passively equalize temperature across battery modules ensures both thermal safety and uniform performance distribution.
A heat pipe is a highly efficient passive heat transfer device that operates based on the principles of phase change and capillary action. It typically consists of a sealed cylindrical tube filled with a small amount of working fluid and a capillary wick structure lining the inner wall (Fig. 1a). When heat is applied to one end of the pipe, known as the evaporator section, the working fluid absorbs the heat and evaporates, transforming into vapor. This vapor then travels through the hollow core of the pipe to the condenser section, where the surrounding environment is cooler. There, the vapor releases its latent heat and condenses back into liquid. The condensed fluid is then returned to the evaporator section through the wick structure by capillary forces, enabling continuous circulation without the need for any external power source. This cycle allows heat pipes to transport large quantities of heat with minimal temperature difference, making them ideal for thermal management applications in electric vehicle batteries.
 |
Fig. 1 Heat pipe: (a) operation principle, (b) different capillary structures. |
Inside a heat pipe, the capillary wick structure plays a crucial role in returning the condensed working fluid from the condenser to the evaporator section. Several types of wick structures exist, each with specific characteristics suited to different applications, thermal loads, and orientations (Fig. 1b). One of the most common types is the grooved wick, which consists of axial or helical grooves machined into the inner wall of the heat pipe. This design is simple, cost-effective, and offers moderate capillary pumping capability, making it suitable for horizontal or slightly inclined applications. Another widely used type is the sintered metal powder wick, formed by compacting and sintering fine metal powders (usually copper or nickel) to create a porous structure with high capillarity and excellent fluid retention. This type is ideal for applications requiring high heat flux and operation in any orientation. The screen mesh wick, made from one or more layers of fine metallic mesh, offers a good balance between capillary force and permeability and is often used in low-to-medium power applications. Lastly, composite wick structures combine two or more types, such as sintered and grooved, to optimize both liquid transport and vapor flow pathways, enhancing the overall thermal performance of the heat pipe. The choice of wick structure significantly influences the heat pipe’s performance, particularly its capillary limit, thermal resistance, and effective thermal conductivity.
Recent investigations have focused on improving the coupling between heat pipes and battery cells by optimizing the contact area, enhancing internal capillary structures, and integrating advanced materials to improve heat transfer [3–5]. Yet, while several review articles have explored various BTMS architectures [6, 7], few have delved deeply into the specific challenges, limitations, and modeling of hybrid systems involving heat pipes. Key questions remain regarding the operational boundaries of such systems, their scalability, and performance under transient thermal conditions.
In this context, the present study proposes a hybrid BTMS that combines a cylindrical copper heat pipe with a water-cooled cold plate (Fig. 2). We conduct both experimental and numerical investigations to assess its capacity to regulate cell temperatures across a range of thermal loads. Using a combination of infrared thermography and CFD simulations, the system is analyzed in terms of its heat distribution, temperature uniformity, and predictive modeling accuracy. The outcomes aim to provide a comprehensive evaluation of heat pipe-based BTMS technologies and support their integration in future high-efficiency EV platforms.
 |
Fig. 2 Cooling system for the electric battery using heat pipes and cold plates: (a) cooling system architecture, (b) cooling system integration in the EV battery. |
2 Experimental study
The experimental study was conducted on a hybrid thermal management system composed of a passive heat pipe and a water-cooled cold plate. The setup was designed to replicate the thermal conditions typically encountered in lithium-ion battery modules used in electric vehicles. The primary goal of this experimental phase is to characterize the thermal behavior of the hybrid system under various heat loads and to assess its ability to maintain cell temperatures within the safe operating range (< 60 °C).
2.1 Heat pipe description
The heat pipe is cylindrical (Fig. 3a), made of copper, and composed of helicoidal grooves (Fig. 3b) with a trapezoidal shape (Fig. 4). The heat pipe length and diameter are 280 mm and 15.88 mm, respectively. The heat pipe and groove dimensional parameters are listed in Table 1.
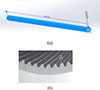 |
Fig. 3 Geometrical characteristics of the heat pipe (a) Overall dimensions, (b) detail of the capillary grooves. |
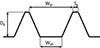 |
Fig. 4 Geometrical characteristics of grooves. |
Heat pipe dimensional parameters.
2.2 Test rig and instrumentation
The experimental setup consists of two blocks made of aluminum (Fig. 5). One block, measuring 60 × 60 × 60 mm3, accommodates four cylindrical electrical heaters, each dissipating 250 W (Fig. 5a). This block serves as a dummy cell. The second block, also measuring 60 × 60 × 60 mm3 and referred to as the cold plate (Fig. 5b), is cooled by circulating water facilitated by a pump. A refrigerated circulator bath regulates the temperature of the water entering the cooling block. Both the heating and cooling blocks are mounted on a rotating support, allowing the test of the heat pipe in different orientations (Fig. 6a). A thermal paste ensures efficient thermal conduction between the heat pipe, the heat source, and the heat sink.
 |
Fig. 5 Sketches of the heating and cooling blocks. (a) The heating block (evaporator), (b) the cooling block (condenser). |
 |
Fig. 6 Experimental setup. (a) General view, (b) view of instrumentation, (c) view of the infrared camera. |
Temperature measurements are facilitated by a TC-08 data acquisition unit, enabling the monitoring and recording of temperatures (Fig. 6b). Along the heat pipe, ten K-type thermocouples are positioned to capture the temperature distribution and its temporal evolution (Fig. 7). Moreover, an infrared camera is employed to evaluate further and validate the results obtained (Fig. 6c). The infrared camera allows for non-contact temperature measurements, providing a complementary method to the thermocouple-based temperature monitoring system. The infrared camera captures thermal images of the entire experimental setup, including the heat pipe, heating block, cooling block, and surrounding components. Heat distribution patterns and potential thermal gradients can be visualized and compared with the data collected from the thermocouples by analyzing these thermal images. The integration of the infrared camera adds an extra layer of analysis and validation, offering a more comprehensive understanding. This approach helps ensure the accuracy and reliability of the experimental results by cross-referencing temperature data obtained from thermocouples and infrared imaging. This setup systematically evaluates the cooling system’s thermal behavior under various conditions, providing insights into its performance characteristics. The characteristics of the instruments are listed in Table 2.
 |
Fig. 7 Location of the thermocouples. |
Characteristics of the instruments.
This methodology enables the validation of both the heat dissipation performance of the hybrid system and the agreement between experimental and numerical results. Ultimately, it supports the optimization of the system’s thermal design for future applications in electric vehicle battery packs.
2.3 Uncertainty analysis
To ensure the reliability and accuracy of the experimental data, a comprehensive uncertainty analysis was performed. This analysis quantifies the possible deviations in the measured and calculated values due to limitations in instrumentation, measurement techniques, and calibration errors. The primary quantities of interest include temperature, thermal resistance, heat flux, and heat transfer coefficients.
The total thermal resistance is calculated according to (1)
(1)
Tev and Tc are the average temperatures of the evaporator and condenser sections, respectively. ΔT is the mean evaporator-condenser temperature difference, and Q is the heat load.
The uncertainty is expressed as (2)
(2)
The uncertainty of the temperature is calculated as follows (3)
(3)
uTr is the reading uncertainty from the thermocouple, uTc is the uncertainty due to calibration, uTd is the uncertainty due to the drift of the thermocouple reading, uTacq is the acquisition card reading uncertainty, uTca is the acquisition card resolution uncertainty, and uTcon is the connection error uncertainty. Accounting for all these uncertainties, it is found that (4)
(4)
Given that the heat load is calculated using the formula  , uncertainty on Q is expressed as
 (5)
(5)
V and R are the voltage and the electrical resistance, respectively.
For the voltage, the uncertainty is calculated as follows (6)
(6)
uVc is the voltmeter calibration correction uncertainty, uVd is the voltmeter drift uncertainty, and uVr is the voltmeter resolution uncertainty.
Accounting for all these uncertainties, it is found that (7)
(7)
 (8)
(8)
The evaporator thermal resistance is determined as (9)
(9)
Tad is the average temperature of the adiabatic zone.
The uncertainty on Rthev is calculated as follows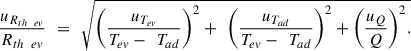 (10)
(10)
The condenser thermal resistance is determined (11)
(11)
so, the uncertainty on Rthc is calculated as follows (12)
(12)
The evaporation heat transfer coefficient, hev, is defined as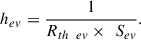 (13)
(13)
Sev is the evaporator heat transfer area.
The evaporation heat transfer coefficient uncertainty is calculated as follows (14)
(14)
The condensation heat transfer coefficient, hc, is expressed as (15)
(15)
Sc is the condenser heat transfer area.
The condensation heat transfer coefficient uncertainty is calculated as follows (16)
(16)
3 Tests results
The thermal behavior of the hybrid cooling system was assessed by measuring the temperature distribution along the heat pipe under various heat loads. The test conditions were maintained with a horizontal orientation of the heat pipe and a constant heat sink (cooling water) temperature of 20 °C.
Figure 8 presents the wall temperature distribution along the heat pipe for different heat input powers ranging from 10 W to 50 W. The temperature profile can be divided into three distinct regions:
-
Evaporator zone: Near the heat source, a steep temperature gradient is observed, indicating active phase change and strong heat absorption.
-
Adiabatic zone: The central region shows nearly constant temperature, confirming minimal axial heat loss and effective vapor transport.
-
Condenser zone: The temperature drops significantly due to efficient heat removal by the water-cooled cold plate.
 |
Fig. 8 Axial temperature distribution along the heat pipe (cold water temperature = 20 °C). |
For heat loads below 40 W, the maximum temperature remains under the critical safety threshold of 60 °C, which is suitable for battery safety. However, above 40 W, the temperature at the evaporator increases sharply, indicating the onset of capillary limit and dry-out conditions within the heat pipe. This marks a performance boundary beyond which the system’s passive cooling capability becomes compromised.
Figure 9 shows the variation of overall thermal resistance Rtht, as well as the evaporator and condenser thermal resistances Rthev and Rthc, for the applied heat load Q. The overall thermal resistance decreases with increasing heat load until 40 W, due to improved phase change dynamics and enhanced fluid circulation. Beyond 40 W, Rtht begins to increase again, confirming the degradation of heat pipe performance under dry-out conditions. The evaporator resistance curve exhibits a minimum point, suggesting an optimal operating zone where evaporation is most efficient. In contrast, the condenser thermal resistance continuously decreases, reflecting improved condensation rates with higher heat input.
 |
Fig. 9 Thermal resistance variations vs. Q. |
Figure 10 illustrates the evolution of the evaporation and condensation heat transfer coefficients, hev and hc, as a function of heat input. Condensation coefficients are consistently higher than evaporation coefficients, which is typical due to better thermal contact and condensation occurring over a larger area. The curves further validate that the bottleneck in thermal performance lies primarily in the evaporation process.
 |
Fig. 10 Evaporation and condensation heat transfer coefficients vs. Q. |
To further evaluate the efficiency of the heat pipe, its effective thermal conductivity λeff is compared with that of a solid copper rod (λcopper = 380 W/m). Figure 11 presents the ratio λeff/λcopper versus Q. The ratio increases with the heat input, reaching a maximum of 4.5 at 40 W, indicating the significant enhancement offered by the phase-change mechanism within the heat pipe. This result highlights that, under optimal conditions, the heat pipe can outperform solid copper by over four times in heat transfer efficiency. These results confirm that the hybrid cooling system can effectively manage battery heat loads up to 40 W, maintaining safe operating temperatures. Above this threshold, system performance becomes limited by fluid transport constraints within the heat pipe, suggesting the need for design optimization in high-power applications.
 |
Fig. 11 Effective thermal conductivity variations vs. Q |
4 Modeled system
To complement the experimental study and gain deeper insight into the system’s thermal behavior, a numerical model was developed using commercial CFD SolidWorks. The objective was to replicate the heat distribution observed in the hybrid cooling system and validate the model against the experimental and infrared measurements.
4.1 Geometry and material properties
The geometry used in the simulation mirrors the actual experimental setup. It includes the aluminum heating block, copper heat pipe, and water-cooled cold plate. The key geometric dimensions are identical to those described in the experimental section. The thermal properties of the materials used in the simulations are listed in Table 3. The heat pipe is not modeled as a multiphase component, but rather as a solid rod with an effective thermal conductivity (λeff) derived from the experimental measurements. This simplification captures the net thermal performance while avoiding the complexity of modeling phase change dynamics directly.
Material thermal properties and assembly.
4.2 Boundary conditions
The model includes three types of boundary conditions to replicate realistic thermal behavior (Table 4):
-
Dirichlet condition: A fixed temperature of 20 °C is applied to the water circulation zones in the condenser (cold plate).
-
Neumann condition: A heat flux corresponding to the electrical input is applied to the evaporator zone (heating block).
-
Cauchy condition (convective): Applied to the external surfaces of the assembly to simulate heat exchange with the ambient environment. A convective heat transfer coefficient of 5 W/m2 K and an ambient temperature of 25 °C are used.
Boundary conditions.
4.3 Meshing
The entire system was discretized using 3D tetrahedral solid elements with curvature-based meshing to better capture geometrical details. Three different mesh densities [coarse (Fig. 12a), medium (Fig. 12b), fine (Fig. 12c)] were tested to assess the mesh sensitivity and ensure simulation stability and accuracy. The fine mesh, selected for final analysis, provides the best compromise between accuracy and computational efficiency. The mesh metrics are summarized in Table 5.
 |
Fig. 12 Meshing used for simulations: (a) coarse mesh, (b) medium mesh, (c) fine mesh. |
Meshing characteristics.
5 Comparison between experimental results and model simulations
To evaluate the reliability and predictive capability of the SolidWorks thermal model, simulation results were directly compared to experimental temperature profiles under different heat loads. The comparison allows us to assess the model’s accuracy in predicting temperature distribution along the heat pipe and identify key discrepancies related to modeling assumptions.
Figure 13 presents the axial temperature distributions obtained from simulations (blue curves) and experimental measurements (red curves) for five different heat input powers: 10 W, 20 W, 30 W, 40 W, and 50 W. In each case, both simulation and experimental profiles exhibit the characteristic shape of a heat pipe system: a sharp temperature drop in the condenser region, a plateau in the adiabatic zone, and a temperature rise in the evaporator region.
 |
Fig. 13 Simulated versus experimental results for different heat loads (20 °C). |
At lower power inputs (≤ 40 W), the simulation results match closely with the experimental data, especially in terms of maximum temperature and spatial temperature gradient. The model correctly predicts the thermal behavior, showing that the effective thermal conductivity approach used to simulate the heat pipe is valid under normal operating conditions. For the highest heat load (50 W), a noticeable gap appears between the simulated and experimental maximum temperatures. The simulated peak temperature is lower than the measured one. This deviation is primarily attributed to the following:
-
The dry-out phenomenon occurring inside the actual heat pipe at high power is not accounted for in the simulation.
-
The evaporation and condensation phase changes are not explicitly modeled. Instead, the heat pipe is treated as a uniform material with a fixed effective thermal conductivity, which does not capture degradation of capillary return or fluid transport failure.
-
Thermal contact resistances, manufacturing imperfections, and surface roughness are not modeled, but may affect the real system.
Despite these simplifications, the model maintains good agreement in the overall temperature trend and accurately predicts the cooling system’s behavior for loads up to 40 W.
This comparison validates the use of effective thermal conductivity as a reasonable approximation in simulations of hybrid BTMS, especially when phase change modeling is impractical due to computational cost. However, the results also emphasize the importance of incorporating more advanced multi-phase heat transfer models for applications involving higher thermal loads or critical performance thresholds. In future work, coupling with multiphysics simulation tools or integrating two-phase flow models could enhance the prediction accuracy beyond 40 W and capture dry-out and capillary limitations.
6 Comparison between infrared measurements and model simulations
To further validate the simulation model and enhance the credibility of the experimental observations, a comparison was conducted between infrared (IR) thermal images and the corresponding numerical simulation outputs. This cross-validation provides a visual and quantitative assessment of the hybrid cooling system’s thermal behavior.
Figure 14 presents side-by-side comparisons between IR images (left) and simulated thermal maps (right) for various heat inputs. Each thermal map illustrates the spatial distribution of temperature from the evaporator zone to the condenser region. Key visual observations include:
-
A high-temperature zone concentrated near the evaporator (right side, typically shown in white/yellow on IR and red in simulation);
-
A steady temperature gradient across the adiabatic zone;
-
A cooler region at the condenser end (left side, purple/blue on IR and simulation).
 |
Fig. 14 Simulated versus Infrared temperature measurements (20 °C). |
The similarity in thermal profiles between the IR images and simulations confirms the general accuracy of the heat transfer modeling and highlights the physical realism of the temperature distributions produced by the CFD simulations.
Table 6 summarizes the maximum temperatures recorded by three methods: thermocouples, IR, and simulations for heat loads ranging from 10 W to 50 W. The values demonstrate a strong agreement between the IR measurements and simulation predictions. Deviations remain within ± 2 °C across the tested heat load range. Minor differences are attributed to:
-
Surface emissivity variations affecting IR readings;
-
Slight misalignment or timing lag between data acquisition methods;
-
Simplified boundary conditions in simulations.
Comparison between simulated and infrared maximum temperatures (20 °C).
The strong correlation between simulated and IR data confirms that the hybrid cooling model effectively replicates the physical behavior of the system. The consistent thermal gradient and accurate peak temperature estimation highlight the model’s value as a predictive design tool.
Moreover, the use of IR imaging provides a reliable method to detect spatial inhomogeneities, identify potential hot spots, and validate model assumptions, making it an essential complement to pointwise sensor measurements.
Test measurements were carried out with a cold water temperature of 30 °C (Fig. 15). The comparative results between cooling fluid temperatures of 20 °C and 30 °C reveal the critical impact of heat sink temperature on the thermal regulation efficiency of the hybrid cooling system (Table 7). At every tested heat input level, the system operating with a lower sink temperature (20 °C) consistently maintained lower maximum surface temperatures across both thermocouple and infrared (IR) measurements. For instance, at 50 W, the peak temperature measured by thermocouples reached 83.9 °C at a 30 °C sink temperature, while it remained significantly lower at 77.8 °C when the sink temperature was 20 °C. This ~6 °C reduction illustrates the system’s sensitivity to cooling fluid temperature and highlights the improved thermal margin achieved under colder coolant conditions. Additionally, the temperature differences become more pronounced as the heat load increases, indicating that the benefit of a lower sink temperature scales with thermal demand. While performance differences at 20 W are minimal (less than 2 °C), the gap widens at higher loads, emphasizing the importance of optimizing coolant conditions to prevent reaching the capillary or dry-out limit of the heat pipe. These results underscore the need to manage heat sink temperature proactively, especially under high power operation, to ensure reliable and safe battery operation.
 |
Fig. 15 Axial temperature distribution along the heat pipe (cold water temperature = 30 °C). |
Thermocouple versus IR temperature measurements.
The infrared thermal images captured during the experiments serve as a crucial tool for evaluating the spatial temperature distribution across the hybrid cooling system and validating the accuracy of both the thermocouple measurements and numerical simulations. These images reveal critical thermal gradients and enable the identification of localized hot spots that may not be fully detected by discrete point sensors.
A deeper inspection of the IR images across different heat sink temperatures (20 °C vs. 30 °C) and heat loads (20–50 W) shows distinct thermal zones that evolve as the system approaches its thermal limits (Fig. 16). At lower loads (20–30 W), the thermal maps display well-defined heat transfer behavior, with a gradual temperature gradient from the evaporator to the condenser. The uniformity and symmetry in the images under these conditions indicate efficient phase change within the heat pipe and effective heat extraction by the cold plate.
 |
Fig. 16 Infrared temperature measurements (20 °C vs. 30 °C). |
However, at higher heat loads, particularly at 40 W and 50 W, the IR images reveal a more pronounced thermal asymmetry and concentration of heat in the evaporator zone. At a heat sink temperature of 30 °C, this thermal concentration is more intense and less diffuse, suggesting reduced condensation efficiency and a diminished thermal gradient across the system. The bright zones in the evaporator region become broader and more saturated, which visually signifies the onset of dry-out or partial failure in capillary return phenomena that lead to degraded heat pipe performance.
Additionally, the IR images at 20 °C show a more elongated and progressive thermal distribution, with sharper transitions between regions. This indicates better thermal coupling between components and more stable operation within the capillary limit of the heat pipe. The IR thermal signatures at lower sink temperatures also exhibit narrower hot regions, confirming the cold plate’s improved ability to maintain a lower temperature baseline for condensation.
Overall, IR thermography not only validates temperature measurements but also provides valuable spatial insights into heat pipe dynamics, enabling the detection of early thermal anomalies and the visualization of performance degradation under thermal stress. These observations reinforce the importance of IR imaging as a diagnostic and design optimization tool for battery thermal management systems.
7 Conclusion
The experimental and numerical investigations conducted in this study demonstrate the effectiveness of a hybrid Battery Thermal Management System (BTMS) that integrates both heat pipes and a cold plate for Electric Vehicle (EV) applications. The system successfully maintains battery module temperatures within safe operational limits across a wide range of thermal loads, offering a promising passive–active solution for next-generation electric mobility platforms. Key conclusions are as follows:
The hybrid system is capable of dissipating heat loads up to 40 W while keeping the maximum surface temperature below 60 °C, which is considered the safety threshold to prevent thermal runaway in lithium-ion batteries.
-
The overall thermal resistance decreases with increasing heat input, until the capillary limit of the heat pipe is reached. Beyond this point (i.e., for loads > 40 W), dry-out effects reduce thermal performance, confirming the importance of staying within the heat pipe’s operating range.
-
The effective thermal conductivity of the heat pipe was found to be up to 4.6 times greater than that of solid copper, highlighting its superiority in conducting heat via phase-change mechanisms.
-
Infrared thermography and K-type thermocouple measurements both validated the thermal performance of the system and showed strong agreement with SolidWorks simulation results. The numerical model reliably predicted temperature distributions and peak values, with deviations generally within ±2 °C.
-
Modeling the heat pipe as a material rod with an effective conductivity proved sufficient for steady-state operation up to moderate heat loads. However, for high-power scenarios, integrating advanced multiphase flow models would provide a more realistic simulation of dry-out behavior and fluid transport limitations.
Overall, the findings confirm that the hybrid BTMS combining heat pipes and cold plates can provide a compact, scalable, and energy-efficient cooling strategy for EV battery packs. This approach addresses many of the limitations of conventional liquid cooling systems, such as complexity and leakage risk, while ensuring reliable thermal regulation.
Future work will focus on:
-
Transient thermal analysis under dynamic driving conditions;
-
Multi-cell module configurations for system-level integration;
-
Optimization of heat pipe geometry and working fluids to extend the capillary limit and enhance performance at higher power levels.
This hybrid cooling concept lays a solid foundation for future BTMS designs that meet the increasingly stringent demands of energy density, safety, and reliability in the electric transportation sector.
References
- Singh R., Lapp G., Velardo J., Long P.-T., Mochizuki M., Akbarzadeh A., Date A., Mausolf K., Busse K. (2021) Battery cooling options in electric vehicles with heat pipes, Front. Heat Mass Transf. 16, 1, 1–8. https://doi.org/10.5098/hmt.16.2 [Google Scholar]
- Gabsi I., Saad I., Maalej S., Zaghdoudi M.C. (2024) Thermal management of Li-ion batteries in electric vehicles by nanofluid-filled loop heat pipes, Sci. Technol. Energy Transit. 79, 1–17. https://doi.org/10.2516/stet/2024019. [Google Scholar]
- Mbulu H., Laoonual Y., Wongwises S. (2021) Experimental study on the thermal performance of a battery thermal management system using heat pipes, Case Stud. Therm. Eng. 26, 101029. https://doi.org/10.1016/j.csite.2021.101029. [Google Scholar]
- Luo Y., Tang Y., Zhang X., Wang H., Zhou G., Bai P. (2022) A novel composite vapor chamber for battery thermal management system, Energy Convers. Manag. 254, 115293. https://doi.org/10.1016/j.enconman.2022.115293. [Google Scholar]
- Mohamed Nasir F., Abdullah M.Z., Ismail M.A. (2023) Effect of heat pipe’s configuration in managing the temperature of EV battery, CFD Lett. 15, 3, 22–34. https://doi.org/10.37934/cfdl.15.3.2234. [CrossRef] [Google Scholar]
- Huang Y., Tang Y., Yuan W., Fang G.-Y., Yang Y., Zhang X.-Q., Wu Y.-P., Yuan Y.-H., Wang C., Li J.-G. (2021) Challenges and recent progress in thermal management with heat pipes for lithium-ion power batteries in electric vehicles, Sci. China Technol. Sci. 64, 5, 919–956. https://doi.org/10.1007/s11431-020-1714-1. [Google Scholar]
- Ghaeminezhad N., Wang Z., Ouyang Q. (2023) A review on lithium-ion battery thermal management system techniques: a control-oriented analysis, Appl. Therm. Eng. 219, 119497. https://doi.org/10.1016/j.applthermaleng.2022.119497. [CrossRef] [Google Scholar]
- Oh I.-T., Lee J.-S., Han J.-S., Lee S.-W., Kim S.-J., Rhi S.-H. (2023) Li-ion battery immersed heat pipe cooling technology for electric vehicles, Electronics 12, 24, 4931. https://doi.org/10.3390/electronics12244931. [Google Scholar]
- Vachhani M., Sagar K.R., Patel V.M., Mehta H.B. (2023) Enhancing battery thermal management: a study on the feasibility of dual-evaporator loop heat pipe technology, J. Therm. Anal. Calorim. 148, 13639–13654. https://doi.org/10.1007/s10973-023-12628-w. [Google Scholar]
- Sharifi N., Millard C., Etufugh U., Shabgard H. (2024) Hybrid thermal management method of Li-ion batteries using heat pipes and PCM for electric vehicles, in Proceedings of the ASME 2024 International Mechanical Engineering Congress and Exposition. Volume 9: Heat Transfer and Thermal Engineering. Portland, Oregon, USA. November 17–21, 2024. V009T11A019, ASME. https://doi.org/10.1115/IMECE2024-144452. [Google Scholar]
- Xin Q., Yang T., Zhang H., Zeng J., Xiao J. (2023) Simulation and optimization of lithium-ion battery thermal management system integrating composite phase change material, flat heat pipe and liquid cooling, Batteries 9, 6, 334. https://doi.org/10.3390/batteries9060334. [Google Scholar]
- Weragoda D.M., Tian G., Burkitbayev A., Lo K.-H., Zhang T. (2023) A comprehensive review on heat pipe based battery thermal management systems, Appl. Therm. Eng. 224, 120070. https://doi.org/10.1016/j.applthermaleng.2023.120070. [Google Scholar]
- Bernagozzi M., Georgoulas A., Miché N., Marengo M. (2023) Heat pipes in battery thermal management systems for electric vehicles: a critical review, Appl. Therm. Eng. 219, 119495. https://doi.org/10.1016/j.applthermaleng.2022.119495. [Google Scholar]
All Tables
All Figures
|
Fig. 1 Heat pipe: (a) operation principle, (b) different capillary structures. |
| In the text | |
|
Fig. 2 Cooling system for the electric battery using heat pipes and cold plates: (a) cooling system architecture, (b) cooling system integration in the EV battery. |
| In the text | |
|
Fig. 3 Geometrical characteristics of the heat pipe (a) Overall dimensions, (b) detail of the capillary grooves. |
| In the text | |
|
Fig. 4 Geometrical characteristics of grooves. |
| In the text | |
|
Fig. 5 Sketches of the heating and cooling blocks. (a) The heating block (evaporator), (b) the cooling block (condenser). |
| In the text | |
|
Fig. 6 Experimental setup. (a) General view, (b) view of instrumentation, (c) view of the infrared camera. |
| In the text | |
|
Fig. 7 Location of the thermocouples. |
| In the text | |
|
Fig. 8 Axial temperature distribution along the heat pipe (cold water temperature = 20 °C). |
| In the text | |
|
Fig. 9 Thermal resistance variations vs. Q. |
| In the text | |
|
Fig. 10 Evaporation and condensation heat transfer coefficients vs. Q. |
| In the text | |
|
Fig. 11 Effective thermal conductivity variations vs. Q |
| In the text | |
|
Fig. 12 Meshing used for simulations: (a) coarse mesh, (b) medium mesh, (c) fine mesh. |
| In the text | |
|
Fig. 13 Simulated versus experimental results for different heat loads (20 °C). |
| In the text | |
|
Fig. 14 Simulated versus Infrared temperature measurements (20 °C). |
| In the text | |
|
Fig. 15 Axial temperature distribution along the heat pipe (cold water temperature = 30 °C). |
| In the text | |
|
Fig. 16 Infrared temperature measurements (20 °C vs. 30 °C). |
| In the text | |
Current usage metrics show cumulative count of Article Views (full-text article views including HTML views, PDF and ePub downloads, according to the available data) and Abstracts Views on Vision4Press platform.
Data correspond to usage on the plateform after 2015. The current usage metrics is available 48-96 hours after online publication and is updated daily on week days.
Initial download of the metrics may take a while.