")
")
| Issue |
Sci. Tech. Energ. Transition
Volume 80, 2025
|
|
|---|---|---|
| Article Number | 14 | |
| Number of page(s) | 8 | |
| DOI | https://doi.org/10.2516/stet/2024111 | |
| Published online | 24 January 2025 | |
Regular Article
Advanced energy management strategy for microgrids with integrated battery storage and renewable generation
1
IFP Energies Nouvelles, 1–4 Avenue de Bois-Préau, 92852 Rueil-Malmaison, France
2
IFP School, 228–232 Avenue Napoléon Bonaparte, 92852 Rueil-Malmaison Cedex, France
3
Université Gustave EIFFEL, Laboratoire LICIT-Eco7, Campus de Lyon, Cité des mobilités, 25, avenue François Mitterrand, Case24, 69675 Bron Cedex, France
* Corresponding author: This email address is being protected from spambots. You need JavaScript enabled to view it.
Received:
31
May
2024
Accepted:
28
December
2024
Abstract
As electric mobility gains popularity, Electric Vehicles (EVs) and their batteries are becoming more attractive due to their size and energy density advantages. However, the electric grid has not undergone similar improvements, potentially impacting power stability and affecting EV energy usage and availability. The key challenge lies in managing increasing power demands from a fully EV fleet. To address this, efforts are needed to analyze the integration of EVs into the grid and optimize power distribution. In this paper, an innovative Energy Management Strategy (EMS) is proposed to effectively control energy loads, energy sources, and EVs, incorporating Vehicle-to-Grid (V2G) capability. The EMS optimizes energy flow and storage based on time of day, potential energy production, and the cost of grid electricity. The integration of this EMS results in significant benefits, with approximately 12% savings in electricity bills compared to a reference strategy.
Key words: Electric vehicles / Renewable energy sources / Vehicle-to-grid / Smart grid / Microgrid / Energy management strategy / Optimization
© The Author(s), published by EDP Sciences, 2025
 This is an Open Access article distributed under the terms of the Creative Commons Attribution License (https://creativecommons.org/licenses/by/4.0), which permits unrestricted use, distribution, and reproduction in any medium, provided the original work is properly cited.
1 Introduction
Global actions are taken to reduce CO2 emissions in response to the threats of climate change. The Paris Agreement [1] signed by 196 countries during COP21 in 2015 sets forth action plans to reduce emissions, with the aim of limiting the global average temperature increase. This commitment has spurred two major trends in the energy and transportation sectors. On one hand, there has been a significant increase in the adoption of Renewable Energy Sources (RESS), such as wind and PhotoVoltaic (PV), which, being intermittent, necessitate energy storage systems. On the other hand, vehicle electrification is experiencing remarkable growth, with Electric Vehicle (EV) batteries becoming more efficient and affordable. Notably, EV sales doubled between 2020 and 2021 [2]. While the development of EVs is no longer a challenge, attention has shifted to the grid’s capacity to meet the surging demand for energy. Recent studies, such as one conducted in India [3], reveal that peak energy demand exceeds double the off-peak demand, highlighting the need for large-scale storage systems. In response, smart grid technology has emerged as a viable solution to enhance reliability, reduce peak power demand, and minimize overall energy consumption. Initially, the concept of a smart grid was relatively abstract, with limited theoretical studies and practical applications. However, ongoing efforts in the literature have sought to clarify the concept and delineate its characteristics and limitations. For instance, a review of smart grid visions was conducted in [4] to achieve a comprehensive global understanding. A smart grid combines power systems with information and communication technologies to efficiently generate, transport, distribute, and consume electricity. It has the capacity to accommodate diverse power sources, including renewables, in a decentralized manner, allowing two-way energy flows (V2G), and operates with predictive and adaptive capabilities, incorporating self-monitoring and self-restoration features [5]. The integration of smart grid and electric vehicles (V2G) is extensively reviewed in [4], encompassing infrastructure, communication, and control aspects. V2G technology enables the storage of excess energy using EVs as storage systems, thereby mitigating the fluctuating and inconsistent power delivery associated with renewable energy sources. V2G services span various applications, including ancillary services, spinning reserves, load following, bulk storage, distributed storage, bulk supply, frequency regulation, and demand-side management and load shedding [6]. Notably, DC fast charging plays a pivotal role in achieving efficient V2G, though concerns arise due to potential battery aging and relay failures, as batteries constitute a significant portion of an EV’s cost [4]. Additionally, V2G technology has some drawbacks, such as infrastructure investment costs [3]. To address the battery aging issue of V2G, new Lithium-ion-phosphate batteries capable of sustaining frequent charging and discharging cycles have been developed. Moreover, the additional infrastructure costs can be offset by the revenue generated by selling energy back to the grid. Adopting smart charging schemes can also minimize the negative impacts of uncontrolled EV charging on the grid and reduce costs [4, 7, 8]. A comparison between V2G smart charging and zero-intelligence charging, considering accurate pricing schemes, empirical driving profiles, and EV specifications, demonstrated impressive cost savings, reaching up to 44.8% [9]. While previous studies have focused on microgrid modeling rather than the entire grid, this paper presents an innovative approach to assess the economic and energy consumption benefits of integrating V2G technology in a smart microgrid, taking into account component efficiencies and using renewable energies as electricity sources. Furthermore, this research uniquely explores a realistic application in the city of Lyon, France. The concept of energy management in microgrids has been a subject of significant research interest, with various studies exploring energy management strategies involving renewable energy sources, batteries, and other storage technologies. Pascual et al. [10] examined the energy management strategy (EMS) of a residential microgrid incorporating renewable generation and demand forecasting, considering the power delivery by batteries and generators within the microgrid. García Vera et al. [11] conducted a literature review on energy management in microgrids utilizing renewable energy sources, discussing various strategies, including those involving battery energy storage. Kafetzis et al. [12] proposed energy management strategies based on hybrid automata for islanded microgrids, aiming to reduce dependence on fossil fuel generators in remote areas by integrating renewable sources, batteries, and hydrogen. Murty and Kumar [13] focused on multi-objective energy management in microgrids with hybrid energy sources and battery energy storage systems, optimizing the energy storage system by considering factors such as battery configuration and back-up period. Pascual et al. [14] presented an EMS for an electro-thermal residential microgrid using renewable-based generation, incorporating weather forecasting for renewable generation and demand-side management techniques. Xiang et al. [15] addressed robust energy management in microgrids with uncertain renewable generation and load, choosing high-rate discharge batteries as storage devices for the microgrid. Li et al. [16] optimized the energy management system of an industrial microgrid with high-penetration renewables, utilizing an energy management system to allocate the dispatch of generation sources in the microgrid. Lin et al. [17] proposed an EMS for microgrids using enhanced bee colony optimization, considering renewable energy and battery storage to optimize the microgrid schedule. Zhang et al. [18] emphasized the significance of robust energy management in smart grids, particularly in microgrids with high-penetration renewables and distributed generation. Wang et al. [19] developed an EMS for a microgrid integrated with hybrid energy storage, including lithium batteries, to optimize the energy management of the distributed generation system. These studies collectively contribute to advancing energy management strategies for microgrids, offering valuable insights into the integration of renewable sources, batteries, and other energy storage technologies. Moreover, on the industry side, companies like Schneider Electric have introduced cloud-based platforms (ecostruxure Microgrid Advisor) for dynamic monitoring and control of microgrids [9]. Electricity of France (EDF) has developed a V2G solution primarily targeting industries and government fleets [20]. Renault Group is also actively working on tools to provide smart charging schemes for Renault Zoe owners across Europe [21]. In conclusion, this paper aims to assess the benefits of integrating V2G technology in a smart microgrid in terms of economy and energy consumption, considering component efficiencies and the utilization of renewable energy sources. The study’s innovative aspect lies in its application to the city of Lyon-France, it is a simulation study grounded in real-world data and conditions to predict and optimize energy management in Lyon’s microgrid system. The integration of V2G and smart grid technology holds immense promise for advancing sustainable energy practices and meeting the challenges of increasing energy demands.
While rule-based EMSs offer a pragmatic and straightforward approach, recent literature has demonstrated the advantages of advanced methodologies like optimization-based EMS, Model Predictive Control (MPC), and decentralized control approaches. These methods provide dynamic adaptability to fluctuating energy demand and the intermittent nature of renewables, significantly improving efficiency and scalability [22–24]. Future work will aim to integrate these insights to enhance system performance.
2 Methodology
2.1 Model
As illustrated in Figure 1, a Simulink model of a smart grid was developed based on components found in MATLAB-Simulink [25]. The components were sized based on a real system currently being implemented in Lyon, France by Université Gustave Eiffel.
 |
Fig. 1 Proposed system architecture. |
The smart grid model has renewable energy sources including a PV and wind farm. To be as close to reality as possible irradiance and wind profile variation throughout the day are considered, additionally some parameters can be varied to get differences between seasons and localization. The system also includes an accumulator, storing the excess renewable energy and using it whenever possible to support the load demand coming from the vehicles and the residence. Moreover, a number of vehicle batteries are considered to model the vehicles charging and V2G exchange. The Nissan Leaf battery characteristics were considered, as it is a vehicle that supports V2G and is already available in the market [26].
This model includes physical connections as well as controlling commands for the energy distribution. The electric network is connected to the rest of the components and acts as an infinite source of energy that balances the flow of power at every time step.
Efficiencies of the different elements used in the system are considered to simulate a model as close as possible to reality. For instance, the batteries are modeled with the apparent and reactive powers.
2.2 Strategy and scenario
A rule-based EMS is also implemented to decide the energy flow and storage between the different components. This EMS considers the price variation throughout the day in Lyon, illustrated in Figure 2 [27].
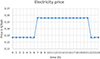 |
Fig. 2 Electricity price profile. |
The EMS controls the residential load demand according to statistics done in the city of Lyon that displays the electricity consumption profile. It also manages the EV load but this time according to the electricity price scheme as well as the users’ demands.
2.2.1 Scenarios
Several scenarios can be considered to model a variety of behaviors, which validate and assess the benefits of the model. In this paper, the scenarios considered are illustrated in Figure 3. The first scenario corresponds to the weekly vehicle usage, where the owners leave to work. While in the weekend scenario, half of the owners and vehicles leave their place for the weekend and the rest of the vehicles are always plugged in.
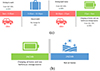 |
Fig. 3 Scenario considered – (a) weekdays; (b) weekend. |
2.3 System sizing and energy loads
The system sizing and characteristics, as well as energy consumption are illustrated in Table 1 and 2, respectively.
System characteristics and sizing.
Energy consumption.
2.3.1 Loads in the model
In the model, the following simplifications of the loads take place:
• For the residential load
Figure 4 represents the profile describing the residential Load demand. On this graph, we have the power demand factor that is multiplied by the nominal power, which is 1 × 0.6 [Mw].
 |
Fig. 4 Residential load. |
In our analysis, we have taken into consideration a presumed peak demand period during the nighttime hours, extending until 8 am. As the sun rises and residents depart from their homes, the energy demand diminishes to its minimum level. Following this, around 5 pm, as residents return with the sunset, we anticipate another peak in energy demand.
• For the EV load
The load from EVs is influenced by both the State-of-Charge (SOC) of the vehicle’s battery and the availability of the vehicle in the household. We have considered that the vehicle is absent between 8 am and 5 pm. The SOC target is calculated according to the distance traveled. More details are provided in Section 3.
• For the solar energy and wind energy loads
These two loads are calculated based on the wind profile and the sun’s irradiance.
3 Energy management strategy
This part treats the logic followed to obtain an optimal energy path. The EMS currently within the model follows a rule-based type of logic. This rule-based logic follows a hierarchy of needs related to SOC and the direction of energy flow.
The EMS’s rule-based logic can be divided into three main different decision tree sections: The EV Command decision tree, The SOC decision tree, and The ACC Load Management decision tree. Decision trees allow a logical path to initiate and terminate charging. They also allow the possibility to use the EV as a source of energy for whichever energy needs may arise. These three subsystems are simplified and shown below.
The model includes two EMS. One with a reference V2G charging and the other with an enhanced V2G. The reference EMS does not take into consideration the electricity price profile throughout the day. Instead, the vehicle charges whenever there is a demand. The two EMS are then compared to assess their benefits. Solar energy and wind energy are the renewable sources in the studied smart grid. Again, and in the aim of being close to reality, solar and wind profile variation throughout the day are considered as well as the differences between seasons and localization. The system also includes an accumulator, storing the excess of renewable energy and using it whenever possible to support the load demand coming from the vehicles and the residence. Energy flow is decided based on renewable energy availability and current energy costs supplied by the electric grid (Fig. 5). The load profile includes the SOC of the battery and availability of the vehicle in the household. The target SOC is calculated according to the travelled distance.
 |
Fig. 5 User interface. |
3.1 Initialization subsystem
When an owner plugs their vehicle into the charger, the user interface shown in Figure 6.
 |
Fig. 6 EV command decision tree. |
With this interface, the user can select if they want to charge the vehicle without the help of the EMS, give an expected departure time, the distance that they will travel, and the emergency distance. The latter is the minimum distance needed to get to the nearest hospital.
Based on user-inputted variables, the system calculates the target and emergency SOCs. Starting from equation (1) that calculates the force of traction needed for the vehicle to move forward according to its acceleration speed, the slope if any, the tires properties and the aerodynamics of the vehicle.
The traction power is then calculated according to equation (2) and finally the energy needed to reach the destination indicated in the user interface is therefore computed. Finally, the SOC is determined based on the battery properties [26]. (1)
(1)
Ftraction: Traction force;
Faero: Aerodynamic force calculated according the vehicle’s properties SCx;
Frolling: Rolling force calculated according the wheels rolling coefficient;
Facceleration: Acceleration force. (2)
(2)
Ptraction: Traction power;
V: Vehicle speed.
Finally, the interface allows the driver to override the entire system and charge the vehicle.
3.2 EV command decision tree
The EV command tree, shown in Figure 5, is fundamental and its main purpose is to decide whether the vehicle should be charged or discharged.
In this decision tree, the battery’s SOC is controlled by monitoring the current SOC and user demand. Vehicle charging is then initiated or terminated based on these factors. If initiated, energy flow is decided based on renewable energy availability and current energy costs supplied by the electric grid.
3.3 SOC and accumulator command decision trees
Figures 7 and 8 present the secondary decision trees consisting of the SOC and Accumulator load.
 |
Fig. 7 SOC target decision tree. |
 |
Fig. 8 Accumulator load management decision tree. |
These two subsystems calculate and monitor the needed time to charge based on the current SOC and the available energy, which has been accumulated up until that timestep within the accumulator. The SOC target subsystem is fundamental to the charging of the EV in relation to a user’s needs. The accumulator load management subsystem will check and dictate if the energy needed for charging an EV will be directed from the accumulator or from the renewable energy sources.
For more clarity, Table 3 summarizes the role of the several decision trees described in Figures 5–8.
Summary of the several decision trees.
4 Results and discussion
4.1 Power distribution
Based on the previously defined scenarios and following the EMS logic, the obtained power distribution curves are illustrated in Figures 9 and 10. As discussed earlier, the main objective is to satisfy the load demand while minimizing as much as possible the use of the grid.
 |
Fig. 9 Power distribution – weekday scenario. |
 |
Fig. 10 Power Distribution – weekend scenario. |
The weekday curve can be divided into three main parts. The first part shows a high load demand from both the vehicle and the residential loads. It is mostly satisfied by the grid, since starting from time 0 there is no stored energy in the accumulator and the power provided by the renewable energy sources is insufficient. As a result, there is no excess power to be stored in the accumulator. For the second section, the load demand is significantly lower, while the renewable energy production reaches its peak, so the grid power is not needed. Excess renewable energy is stored in the accumulator. Moving on to the final section, the load demand increases again and exceeds the renewable energy power generation, resulting in the complete use of the accumulated energy until its depletion, where the grid takes over.
The weekend scenario showed similar results, except for the third section where there was almost no need for the grid, as the accumulated energy was enough to satisfy the demand.
It is also worth noting that the utility grid pricing effect can be seen by the increase in grid usage at late hours, from 21:00 to 05:00, due to its lower price point, resulting in additional savings and explaining the peaks in the grid usage. This effect is evident, especially during the weekday scenario where grid usage is more at use.
4.2 Cost and energy savings and frequency regulation
Based on the smart grid model and EMS developed, the enhanced EMS is compared to a reference one to assess the benefits induced by implementing a smart charging V2G. Compared to the enhanced EMS, the reference one charges the vehicle without considering the electricity price.
As indicated in Figure 11, cost and energy savings are achieved when implementing the enhanced EMS. In fact, it showed a 12.24% reduction in the electricity bill and an 11.26% reduction in the energy consumption, compared to the reference one.
 |
Fig. 11 Cost and energy savings between the reference EMS and the enhanced EMS. |
The enhanced EMS takes into consideration the electricity demand peaks where it is mostly costly. Therefore, the enhanced EMS avoids these peaks and supplies power then. The percentages are calculated according to the electricity costs taken from the reference [27]. And for the power results on the same figure are calculated according to the simulation.
Another major achievement is the stabilization of the grid’s frequency. This regulation could ensure a balanced electricity supply. In fact, the frequency varies depending on the difference between the supply and demand of power. As a result, the proposed EMS would regulate it, allowing a quasi-stable power delivery.
It is important to note that this frequency regulation induces additional cost savings for the user, as the grid will have to pay for it, and this was not included in the cost calculation of the study.
5 Conclusions and perspectives
An EMS is proposed for a microgrid with battery storage and renewable generation. The usage of this EMS results in the optimization of energy usage and cost savings. This is done by prioritizing the usage of renewable energy and the usage of the electric grid at lower price points/low-demand timeframes.
The proposed EMS finds a better path to distribute energy with the use of a rule-based logic concept. Checking a hierarchy of needs, the EMS will choose whether the EV charges or not based on the current SOC. By simply plugging in their vehicle, a user benefits from 12.24% of cost savings.
Although the proposed EMS has shown promising results in terms of cost and energy savings, future work will focus on integrating advanced methodologies such as MPC and hierarchical optimization. These approaches, as demonstrated in the studies conducted by [22, 24], provide dynamic and decentralized control capabilities, enabling more robust and efficient management of renewable energy and demand-side variations.
Future perspectives include the further optimization of the EMS itself. Currently, a rule-based logic is being used, but an exact method such as dynamic programming logic or PMP would further optimize the model. The addition of differentiating scenarios with various other conditions and parameters will lead to a more encompassing result. Such conditions can include different EV usage profiles, additional renewable energy sources, and the addition of extra loads on the smart grid such as an industrial/commercial complex. These additions will lead to a more “real-life” simulation of the smart grid. EV-related parameters such as battery aging and charging/discharging losses will also fine-tune the model for a more accurate result.
References
- COP21: the key points of the Paris agreement. Retrieved from https://www.diplomatie.gouv.fr/en/french-foreign-policy/climate-and-environment/2015-paris-climate-conference-cop21/cop21-the-paris-agreement-in-four-key-points/ (accessed Jan. 05, 2020). [Google Scholar]
- Paoli L., Gül T. (2022) Electric cars fend off supply challenges to more than double global sales – analysis, IEA. Retrieved June 17, 2022, from https://www.iea.org/commentaries/electric-cars-fend-off-supply-challenges-to-more-than-double-global-sales. [Google Scholar]
- Shariff S.M., Iqbal D., Saad Alam M., Ahmad F. (2019) A state of the art review of electric vehicle to grid (V2G) technology, IOP Conf. Ser. Mater. Sci. Eng. 561, 1, 012103. https://doi.org/10.1088/1757-899x/561/1/012103. [CrossRef] [Google Scholar]
- Mwasilu F., Justo J.J., Kim E.K., Do T.D., Jung J.W. (2014) Electric vehicles and smart grid interaction: a review on vehicle to grid and renewable energy sources integration, Renew. Sustain. Energy Rev. 34, 501–516. https://doi.org/10.1016/j.rser.2014.03.031. [CrossRef] [Google Scholar]
- Mohamed M.A., Eltamaly A.M. (2018) Modeling and simulation of smart grid integrated with hybrid renewable energy systems, 1st edn. Springer, Cham. [CrossRef] [Google Scholar]
- Sovacool B.K., Kester J., Noel L., Zarazua de Rubens G. (2020) Actors, business models, and innovation activity systems for vehicle-to-grid (V2G) technology: a comprehensive review. Renew. Sustain. Energy Rev. 131, 109963. https://doi.org/10.1016/j.rser.2020.109963. [CrossRef] [Google Scholar]
- Wellisch D., Lenz J., Faschingbauer A., Pöschl R., Kunze S. (2015) Vehicle-to-grid AC charging station: an approach for smart charging development, IFAC-PapersOnline 48, 4, 55–60. https://doi.org/10.1016/j.ifacol.2015.07.007. [CrossRef] [Google Scholar]
- Wali K., Koubaa R., Krichen L. (2019) Cost benefit smart charging schedule for V2G applications, in: 2019 16th International Multi-Conference on Systems, Signals & Devices (SSD), Istanbul, Turkey, 21–24 March. https://doi.org/10.1109/ssd.2019.8893171. [Google Scholar]
- Schuller A., Dietz B., Flath C.M., Weinhardt C. (2014) Charging strategies for battery electric vehicles: economic benchmark and V2G potential, IEEE Trans. Power Syst. 29, 5, 2014–2022. https://doi.org/10.1109/tpwrs.2014.2301024. [CrossRef] [Google Scholar]
- Pascual J., Barricarte J., Sanchis P., Marroyo L. (2015) Energy management strategy for a renewable-based residential microgrid with generation and demand forecasting, Appl. Energy 158, 12–25. https://doi.org/10.1016/j.apenergy.2015.08.040. [CrossRef] [Google Scholar]
- García Vera Y.E., Dufo-López R., Bernal-Agustín J.L. (2019) Energy management in microgrids with renewable energy sources: a literature review, Appl. Sci. 9, 3854. https://doi.org/10.3390/app9183854. [CrossRef] [Google Scholar]
- Kafetzis A., Ziogou C., Panopoulos K.D., Papadopoulou S., Seferlis P., Voutetakis S. (2020) Energy management strategies based on hybrid automata for islanded microgrids with renewable sources, batteries and hydrogen, Renew. Sustain. Energy Rev. 134, 110118. https://doi.org/10.1016/j.rser.2020.110118. [CrossRef] [Google Scholar]
- Murty V.V.S.N., Kumar A. (2020) Multi-objective energy management in microgrids with hybrid energy sources and battery energy storage systems, Prot. Control Mod. Power Syst. 5, 2. https://doi.org/10.1186/s41601-019-0147-z. [CrossRef] [Google Scholar]
- Pascual J., Arcos-Aviles D., Ursúa A., Sanchis P., Marroyo L. (2021) Energy management for an electro-thermal renewable-based residential microgrid with energy balance forecasting and demand side management, Appl. Energy 295, 117062. https://doi.org/10.1016/j.apenergy.2021.117062. [CrossRef] [Google Scholar]
- Xiang Y., Liu J., Liu Y. (2016) Robust energy management of microgrid with uncertain renewable generation and load, IEEE Trans. Smart Grid 7, 2, 1034–1043. https://doi.org/10.1109/TSG.2014.2385801. [Google Scholar]
- Li H., Eseye A.T., Zhang J., Zheng D. (2017) Optimal energy management for industrial microgrids with high-penetration renewables, Prot. Control Mod. Power Syst. 2, 12. https://doi.org/10.1186/s41601-017-0040-6. [CrossRef] [Google Scholar]
- Lin W.-M., Tu C.-S., Tsai M.-T. (2016) Energy management strategy for microgrids by using enhanced bee colony optimization, Energies 9, 5. https://doi.org/10.3390/en9010005. [Google Scholar]
- Zhang Y., Gatsis N., Giannakis G.B. (2013) Robust energy management for microgrids with high-penetration renewables, IEEE Trans. Sustain. Energy 4, 4, 944–953. https://doi.org/10.1109/TSTE.2013.2255135. [CrossRef] [Google Scholar]
- Wang J., Wang M., Li H., Qin W., Wang L. (2018) Energy management strategy for microgrid including hybrid energy storage, in: 2018 Asian Conference on Energy, Power and Transportation Electrification (ACEPT), Singapore, 30 October–02 November, IEEE, pp. 1–6. https://doi.org/10.1109/ACEPT.2018.8610715. [Google Scholar]
- V2G, a powerful tool for decarbonization, 2022, EDF. Retrieved November 2, 2022, from https://www.edf.fr/en/the-edf-group/inventing-the-future-of-energy/electric-mobility-for-today-and-tomorrow/edf-launches-europes-first-bi-directional-charging-demonstrator/v2g-a-powerful-tool-for-decarbonization. [Google Scholar]
- Vehicle-to-grid: The new generation electric vehicle, Renault Group. Retrieved November 2, 2022 from https://www.renaultgroup.com/en/news-on-air/news/vehicle-to-grid-the-main-advantage-of-the-electrical-grid/. [Google Scholar]
- Sarker E., Halder P., Seyedmahmoudian M., Jamei E., Horan B., Mekhilef S., Stojcevski A. (2021) Progress on the demand side management in smart grid and optimization approaches, Int. J. Energy Res. 45, 36–64. https://doi.org/10.1002/er.563164. [CrossRef] [Google Scholar]
- Huang Y., Wang W., Hou B. (2019) A hybrid algorithm for mixed integer nonlinear programming in residential energy management, J. Clean. Prod. 226, 940–948. https://doi.org/10.1016/j.jclepro.2019.04.062. [CrossRef] [Google Scholar]
- Javaid N., Hafeez G., Iqbal S., Alrajeh N., Alabed M.S., Guizani M. (2018) Energy efficient integration of renewable energy sources in the smart grid for demand side management, IEEE Access 6, 77077–77096. https://doi.org/10.1109/access.2018.2874645. [CrossRef] [Google Scholar]
- MATLAB & Simulink (2021) 24-hour simulation of a vehicle-to-grid (V2G) system. Mathworks France. Retrieved from https://fr.mathworks.com/help/physmod/sps/ug/24-hour-simulation-of-a-vehicle-to-grid-v2g-system.html;jsessionid=1efe1800413b84b480e945d1b338#responsive_offcanvas (accessed September 29, 2021). [Google Scholar]
- Nissan leaf battery real specs – pushevs, Pushevs–Push Electric Vehicles Forward, 2021. Retrieved November 3, 2022, from https://pushevs.com/2018/01/29/2018-nissan-leaf-battery-real-specs/. [Google Scholar]
- Tariffs of electricity for French houses. EDF Prices. Retrieved November 3, 2022, from https://www.french-property.com/guides/france/utilities/electricity/tariff. [Google Scholar]
All Tables
All Figures
|
Fig. 1 Proposed system architecture. |
| In the text | |
|
Fig. 2 Electricity price profile. |
| In the text | |
|
Fig. 3 Scenario considered – (a) weekdays; (b) weekend. |
| In the text | |
|
Fig. 4 Residential load. |
| In the text | |
|
Fig. 5 User interface. |
| In the text | |
|
Fig. 6 EV command decision tree. |
| In the text | |
|
Fig. 7 SOC target decision tree. |
| In the text | |
|
Fig. 8 Accumulator load management decision tree. |
| In the text | |
|
Fig. 9 Power distribution – weekday scenario. |
| In the text | |
|
Fig. 10 Power Distribution – weekend scenario. |
| In the text | |
|
Fig. 11 Cost and energy savings between the reference EMS and the enhanced EMS. |
| In the text | |
Current usage metrics show cumulative count of Article Views (full-text article views including HTML views, PDF and ePub downloads, according to the available data) and Abstracts Views on Vision4Press platform.
Data correspond to usage on the plateform after 2015. The current usage metrics is available 48-96 hours after online publication and is updated daily on week days.
Initial download of the metrics may take a while.