Fig. 4

Download original image
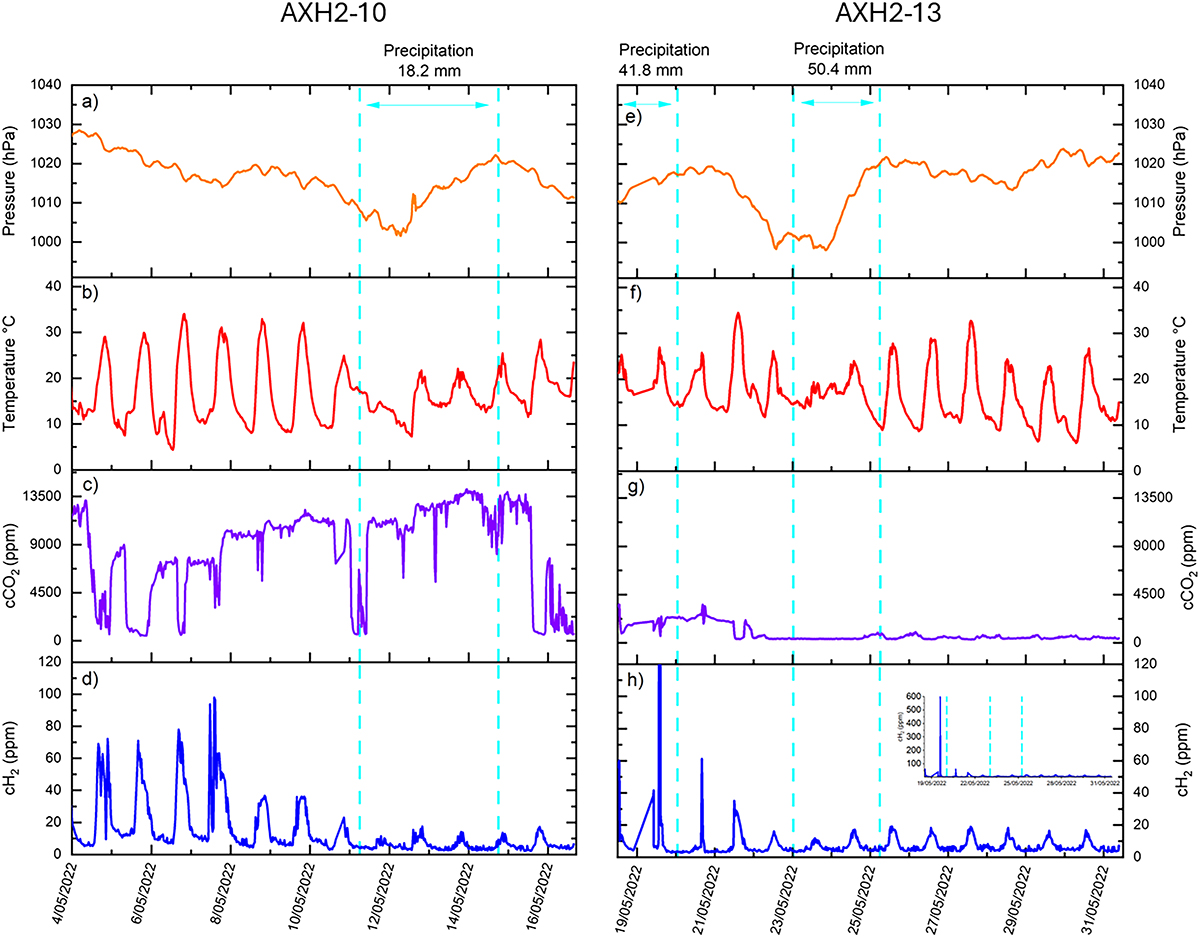
Autonomous monitoring results at the AXH2-10 location (33°0′33″S, 115°51′5″E) from the 4th of May 2022 to the 17th of May 2022 and at the AXH2-13 location (33°0′18″S, 115°50′59″E) from the 18th of May 2022 to the 31st of May 2022 a) AXH2-10 atmospheric pressure (hPa). b) AXH2-10 temperature (°C). c) AXH2-10 carbon dioxide concentration (ppm). d) AXH2-10 hydrogen concentration (ppm – temperature corrected). e) AXH2-13 atmospheric pressure (hPa). f) AXH2-13 temperature (°C). g) AXH2-13 carbon dioxide concentration (ppm). h) AXH2-13 hydrogen concentration (ppm- temperature corrected) shown with restricted range 0–120 ppmin the main image and with full range 0–600 ppm cH2 in the inset, demonstrating the scale of the spike observed on 19th May 2022. Blue dashed lines indicate periods of precipitation measured at the Bunbury Weather Station, Western Australia.
Les statistiques affichées correspondent au cumul d'une part des vues des résumés de l'article et d'autre part des vues et téléchargements de l'article plein-texte (PDF, Full-HTML, ePub... selon les formats disponibles) sur la platefome Vision4Press.
Les statistiques sont disponibles avec un délai de 48 à 96 heures et sont mises à jour quotidiennement en semaine.
Le chargement des statistiques peut être long.


