")
")
| Issue |
Sci. Tech. Energ. Transition
Volume 80, 2025
Emerging Advances in Hybrid Renewable Energy Systems and Integration
|
|
|---|---|---|
| Article Number | 6 | |
| Number of page(s) | 8 | |
| DOI | https://doi.org/10.2516/stet/2024106 | |
| Published online | 06 January 2025 | |
Review Article
Research on anomaly detection and correction of power metering data based on machine learning algorithm
State Grid Jibei Electric Power Company Limited Center of Metrology, Beijing, 100055, China
* Corresponding author: This email address is being protected from spambots. You need JavaScript enabled to view it.
; This email address is being protected from spambots. You need JavaScript enabled to view it.
Received:
6
September
2024
Accepted:
19
November
2024
Abstract
Electric energy measurement is the basis of marketization of electric energy. If the power metering device is abnormal, it will directly affect the economic interests of both sides. At present, the electric energy measurement data of power grid enterprises has generally adopted the mode of remote centralized collection. The existing methods of abnormal detection and location of electric energy metering are mainly through the analysis of the abnormal data alarm issued by the electric energy acquisition system and the on-site inspection of the metering device. With the continuous expansion of the scale of electric power data, the existing methods highlight the shortcomings of low accuracy and low efficiency. In order to explore the optimal solution to the above problems, this paper constructs a multi-model fusion anomaly detection method of electric energy measurement data based on machine learning, and gives the anomaly correction scheme of electric energy measurement data. The results show that the fusion model has the best performance in the actual situation, with Area Under Curve (AUC) reaching 0.9653 and True Positive Rate (TPR) exceeding 0.64 under the condition of zero False Positive Threshold (FPT). The comprehensive performance is better than that of other single models.
Key words: Machine learning / Electric energy measurement data / Anomaly detection / Correction / Multi-model fusion
© The Author(s), published by EDP Sciences, 2025
 This is an Open Access article distributed under the terms of the Creative Commons Attribution License (https://creativecommons.org/licenses/by/4.0), which permits unrestricted use, distribution, and reproduction in any medium, provided the original work is properly cited.
1 Introduction
Electricity metering is the basis of electricity market operation. Electric energy is a kind of commodity, and the trading behavior of commodity should be subject to market supervision. However, due to its own characteristics, it can not be charged before consumption like traditional commodities, and its entire sales and use behavior is completed at the same time. The non-storable nature of electricity poses difficulties for conventional market supervision and pricing techniques because of grid limits, network effects, real-time supply and demand balancing, and highly controlled pricing. Unlike commodities like oil or metals, these variables complicate price fixing and control, leading to regional price disparities. Whether the electricity energy charging is reasonable is directly related to the economic interests of the electricity production department, the sales and supply department and the electricity customers. With the beginning of a new round of market-oriented reform of China’s energy industry, power grid enterprises will face greater pressure from all aspects of society, and to improve the quality of power supply service and ensure the high quality of power supply has become a top priority for power grid enterprises. Power grid businesses will face pressure to innovate in infrastructure and technology due to the growing demands of customers and regulatory agencies for sustainability and dependability. To raise the calibre of their services, they will spend money on automated systems, smart grid technologies, predictive maintenance, and more precise monitoring systems. Power grid businesses may enhance consumer transparency and dependability under the current reform conditions by integrating renewable energy sources, digitizing their operations, and introducing demand response programs and customer-centric services. The power measurement data is not only the basic condition for the smooth development of the marketing work of the power grid company, but also the indispensable basic data for the operation and data analysis of the power grid. Power grid businesses can use voltage stability, customer feedback, energy loss reduction, and reliability measures to measure changes in the quality of the power supply. These measurements, which monitor voltage swings, power outages, complaint resolution rates, and energy loss reduction, show advancements in theft prevention and grid efficiency. And the metering equipment belongs to the power secondary equipment, if there is a serious failure, it will also lead to the safe operation of its associated primary equipment is affected, resulting in power grid security accidents, resulting in power supply interruption. Inaccurate power measurement can result in operational inefficiencies, revenue losses, and grid imbalance. Blackouts, equipment damage, and imbalances in supply and demand can all result from it. Unfair billing and increased operating expenses might result from theft concealed by inaccurate billing. Measurement errors may potentially hamper grid optimization attempts. However, from the reality point of view, due to the influence of human factors and non-human factors, the stability and accuracy of the operation of the electric energy metering device have been tested more and more.
Zhuang et al. reduces the data to two dimensions using PCA (Principal Component Analysis) and then uses the Local Outlier Factor (LOF) algorithm. Based on the local density deviation of a data point relative to its neighbors, the Local Outlier Factor (LOF) method finds abnormalities. For it to function, the density surrounding a data point must be measured and compared to that of its neighbors. Because of its non-parametric, unsupervised detection and local sensitivity, LOF benefits power-use datasets with changing data density and big, unlabeled datasets. To identify outlier objects (abnormal power data that are different from normal power data). It can be seen that most of the current machine learning methods used in the measurement anomaly diagnosis are relatively simple [1]. Several factors are used in power metering anomaly identification, including energy consumption patterns, peak demand, power factor, load variability, temporal aspects, and user profile data. These offer context for finding irregularities in particular user segments and aid in recognizing departures from typical consumption, possible theft, or meter manipulation. Coma-Puig et al. have compared many common machine learning methods, such as Bayesian classifier, KNN (K-Nearest Neighbor), SVM (Support Vector Machine), etc. It is found that with sufficient calibration samples, the accuracy rate of these different methods can reach 90% [2]. Zhang et al. proposed an anomaly diagnosis model based on deep neural network, which can directly input the data collected by the original sensor without feature selection and signal processing [3]. A model’s performance, scalability, learning curve, efficiency, and resource management must all be assessed through incremental data testing. Contrasting performance with various data sizes helps find plateaus and gains, maximizes resource utilization, and finds overfitting and underfitting. The model can process the original data of the sensor with high dimensions, and reduce the work of feature selection through data segmentation and network classification. It reduces the difficulty of training, but it requires enough correctly calibrated anomaly samples. Kou and Cui used the characteristics of recurrent neural network processing time series data and decision tree for fault diagnosis of automatic meter reading system, and integrated recurrent neural network and decision tree through traditional Adaboost method to improve the performance of fault diagnosis [4]. When many machine learning techniques are combined and work well together, feature engineering is superior, and there is enough amount and quality of data to enable efficient training, prevent overfitting, and capture various elements of the data. Neural networks paired with density and distance measures provide multiple benefits for anomaly identification. They improve each other’s sensitivity and robustness to noise, making it possible to identify outliers in dense data areas. Divina et al. applied the integration method to short-term load prediction by integrating multiple weak learners to achieve a robust integration model [5]. The robustness of models against noise or incomplete data may be improved by employing strategies like k-fold cross-validation, outlier identification and removal, imputation for missing data, data augmentation, and ensemble approaches. These techniques can lower bias, eliminate noisy data points, and improve generalization.
Liu et al. proposed a network traffic anomaly detection model, quantified network traffic feature attributes by entropy, and then used k-means algorithm to cluster abnormal traffic to obtain the detection model [6]. Wu and Zhang uses an improved k-means clustering algorithm to compare the density of each object with the average density of all objects [7]. If the density of the data object is less than the average density of the data set, and the distance from the object to its cluster center is greater than the average distance from all objects in the cluster to the cluster center, The object is considered to be an abnormal object. Ren et al. combined with the fault location inference knowledge base, proposed a feature information representation method, and built a secondary device fault location model by using the characteristics of recurrent neural network, which is good at processing timing information [8].
Both machine learning and deep learning methods can achieve more satisfactory results when the number of labeled samples is sufficient, the sample distribution is uniform, and the sample noise is small [9]. Large datasets are needed for training deep learning models like Convolutional Neural Networks (CNN) and Long Short-Term Memory (LSTM), which work well with sequence or picture data. Smaller datasets or ones lacking intrinsic temporal or spatial features are not suited for them because of their high computing cost and interpretive complexity. Because of its interpretability and balance, SVM and Random Forest are better suited for datasets. Thirusubramanian, through enhanced algorithms and anomaly detection, artificial intelligence (AI) has greatly improved financial fraud detection in Internet of Things contexts. This work aims to develop reliable fraud detection models by investigating the technique, datasets, and assessment metrics needed for adaptive learning, which incorporates automated reaction mechanisms and regular retraining [10]. Naresh assesses the performance of four machine learning models – Gradient Boosting, Random Forest, Polynomial Regression, and Linear Regression – to forecast e-commerce trends, enhance inventory management, refine marketing strategies, and improve demand prediction accuracy using a hybrid approach [11]. Naresh, a framework for hybrid machine learning, has been created to identify instances of financial fraud in the digital economy, namely on e-commerce sites. The system continually monitors and adjusts to new fraud behaviour by utilizing neural networks, decision trees, and support vector machines to increase detection accuracy and reliability [12]. However, in the scenarios where the data samples are insufficient and the data cannot be expanded by traditional data enhancement methods, the above methods have problems such as low model classification accuracy and poor performance. Therefore, this paper proposes a multi-model fusion of power metering data anomaly detection method for the power metering anomaly problem.
The innovation of this paper is as follows: firstly, the advantages and disadvantages of the machine learning algorithms SVM and RandomForest are analyzed, and the problems of high dimensional data, poor anti-noise ability and poor fitting ability exist in the process of checking the anomaly of the energy measurement data by using a single model are pointed out [13]. In order to further improve the detection performance, a multi-model fusion method for anomaly detection of electric energy measurement data is obtained by summing the probability results calculated by different models according to different weights. Then, by designing incremental model, the performance of different models in different data amounts is analyzed, and the effect of model fusion is proved. Finally, the abnormal data set is established, the criterion is set, the performance of the fusion model is compared with that of the single model, and the corresponding research conclusion is drawn.
2 Electric energy metering machine learning algorithm
2.1 SVM
SVM (Support Vector Machine) is a type of classification problem designed to solve specific data vectors, the algorithm is essentially to find the obvious support vectors between the vectors involved in the computation, which can be utilized to delineate the obvious blocks between the data [14]. The purpose of this paper is to classify whether or not the electricity measurement is abnormal, and the SVM’s excellent ability to utilize the samples can still be useful even if the sample size of users is small enough.
In the above formula, the SVM essentially optimizes the distance of its support vector boundary while ensuring that the predicted class is the same as the actual class. Even if the data is not linearly separable in the existing space, it can be mapped to a higher dimensional space by designing a kernel function to find support vectors.
From the above formula, it can be seen that SVM is strictly based on the user data vector itself to find support vectors, but it is difficult to discretely data the data in the optimal form under the actual use of user electricity, which leads to the obvious fluctuation of SVM performance [15]. In addition, corresponding to its excellent performance in the case of small sample size, SVM consumes an exaggerated amount of resources in large-scale training, so the simple SVM algorithm is difficult to adapt to complex power consumption data. This paper will make up for its shortcomings in vector expression and data sample size by combining the following two algorithms, so that the algorithm can be applied to different scenarios.
2.2 Random forest
RandomForest uses an integrated structure with a decision tree as the base model, which is an integrated learning algorithm statistical theory based on a decision tree, which utilizes Bootsrap sampling to draw k different samples from the initial sample, here the training sample and the initial sample require the same sample size, and then builds a corresponding decision tree model for each of the k samples to obtain the corresponding k classification results, and use the decision tree to model each sample one by one [16]. The Random Forest approach trains many decision trees on various data subsets through ensemble learning. Random selections of training data and features are used, together with bootstrapping, to generate a variety of models and an ensemble learning procedure to combine predictions and increase resilience and accuracy by offsetting individual tree faults. The influence of individual noisy characteristics is lessened by Random Forest’s averaged predictions from several decision trees, making it resilient to noise. Nevertheless, dimensionality reduction methods such as PCA are required when dealing with high-dimensional data.
In the formula, Ent(D) is the information entropy of the current node, p is the statistical probability, Gain(D, a) is the learning information gain, D is the current node, and a is the partition dimension.
The integration of random forest is also the basis for better anti-noise ability than a single decision tree. Compared to a single decision tree, Random Forest produces more stable results by reducing noise influence, selecting random features for each split, averaging predictions to smooth out noisy predictions, and building multiple decision trees using bootstrapped data samples. Therefore, under the premise of obvious noise of actual industrial data, the adoption of random forest can combine the advantages of decision tree and avoid the troubles caused by data itself [17]. Of course, the advantage of random forest lies in its ability to generalize missing data. Considering the statistical errors of electric meter data and the uncertainties such as special power failure, such errors can be offset as much as possible by adding random forest. But at the same time, random forest usually does not have a particularly obvious advantage in the case of high dimensions.
3 A multi-model fusion algorithm for anomaly detection of electrical energy metering data
The idea of multi-model fusion algorithm for anomaly detection of electric energy measurement data constructed in this paper is to sum the probability results calculated by different models according to different weights. The multi-model fusion strategy enhances anomaly detection performance in intricate datasets such as power theft by combining predictions from machine learning models, such as SVM and RF. This approach strengthens each model’s unique shortcomings while improving overall robustness, accuracy, and generalisability to increase effectiveness. The multi-model fusion approach combines the advantages of each model to enhance detection performance. It provides a range of viewpoints, improved accuracy through model voting or averaging, and resilience to noise and fluctuating data. Random Forest employs ensemble diversity to handle complicated datasets, whereas SVM concentrates on well-defined decision boundaries.
In the formula, S is the final output probability, Msvm(X) is the probability output of SVM algorithm, Mrdf(X) is the probability output of Random Forest algorithm, and ω is its corresponding weight. The best algorithms for anomaly detection are SVM and Random Forest because of their interpretability, resilience against outliers, efficacy in high-dimensional environments, and unambiguous decision bounds. SVM works well with complicated datasets and has good outlier handling capabilities. Random Forest is easier to perceive and comprehend than Neural Networks and Gradient Boosting.
And balance these differences by weight, try to make the single model play their own advantages, and pull the balanced data from the classification boundary to the obvious classification interval, so that the fuzzy data of the original single model can be corrected [18]. In order to train the model below, the basic training process built in this paper is shown in Figures 1 and 2. Effective preprocessing, including managing missing data, outlier identification, and cleaning, guaranteed the model’s success. Automated scripts were utilized to impute missing values, identify outliers, and guarantee dataset integrity using mean/median imputation, k-nearest neighbours, and Random Forest techniques.
 |
Fig. 1 SVM model basic construction training process. |
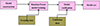 |
Fig. 2 Basic training flow of random forest model. |
To verify the fit of the model to the data for different data volumes, this paper proposes an incremental learning approach so as to obtain the minimum requirement of the data volume in order to determine the weights of the model fusion in real electricity consumption data with different data volumes [19].
4 Experimental analysis
4.1 Build the dataset
All the data sets used in this experiment were collected from the public database of the laboratory, and part of them consisted of the electricity consumption data of 1000 users during 2021–2023, and the collection frequency was half an hour. Because all the data were collected with the consent of the users, the data were benign users, and there was no stealing of electricity. According to the generation method of electric theft data, electricity consumption examples of electric theft users are generated to assist the experiment for analysis. The unbalanced situations in electricity theft detection datasets sometimes call for creating synthetic data to enhance model training. Creating realistic synthetic samples entails modelling tampered meter data and adding anomalous patterns using methods like SMOTE or GANs. The specific generation method is as follows:

Using the above formula, multiply the data sample by random values in the same range, so that the smart meter does not record the measurement value or the record value is 0 for a randomly selected time, where the start time is from 0 to 23 minus the minimum duration, which is 4 h in this formula [20]. Finally, the time of the sample data is inverted within 24 h.
After the data is collected, the process as shown in Figure 3 is used to process the data. Combined with the power theft data generation method, the data for network training and verification is generated. The 535 benign data set samples were divided into 458 samples for training and 77 samples for testing. One sample was randomly drawn every 7 consecutive days for the test set and the other 6 training sets. Again, for each abnormal load, 535 samples are generated. To sum up, the test set contains 3287 samples with a scaling range [−1, 1]. Min-max normalization is a scaling technique that prevents dominance in algorithms and assures uniform feature contribution to a model’s learning process by scaling data into a predetermined range, usually [0, 1]. It is appropriate for datasets and models that are sensitive to data magnitude.
 |
Fig. 3 Data processing flowchart. |
4.2 Evaluation criteria
In this paper, we use the Receiver Operating Characteristic (ROC) curve as an evaluation criterion for the performance of the model, FPR is the horizontal axis of the curve, True Positive Rate (TPR) is the vertical axis of the curve [21]. The formula is as follows:
The above formulas are the horizontal and vertical coordinates of the ROC curve, and FP, TN, and TP represent the negative samples of wrong, negative samples of right, and positive samples of right, respectively. AUC (Area Under Curve) represents the area under the ROC curve. AUC value is used to judge the strengths and weaknesses of classifiers, i.e., prediction models:
4.3 Result analysis
4.3.1 Single model analysis
Before analyzing the fusion model, first analyze the performance of the single model on the data set using the incremental method. Due to their susceptibility to scale, SVMs have speed, feature scaling, and scalability limits. Fusion models minimize overfitting in noisy data and strike a compromise between SVM’s advantages and Random Forest’s effectiveness. By generalizing to previously unknown data, this model enhances performance. Scaling, normalization, feature selection, and addition of additional features were among the feature engineering approaches used to optimize the dataset for Random Forest and SVM. Methods including correlation analysis and recursive feature elimination were applied to lower dimensionality, increase classification accuracy, and find anomalies. The incremental accuracy rate of SVM model is shown in Figure 4, and the incremental accuracy rate of Random Forest model is shown in Figure 5.
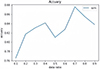 |
Fig. 4 Increment accuracy rate of SVM model. |
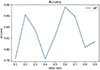 |
Fig. 5 Incremental accuracy rate of random forest model. |
From Figure 4, it can be seen that the SVM model can still achieve ideal results under the condition of training with only 10% training data to 90% training data, indicating that the SVM is still competent for basic objectives under the condition of small samples, and is suitable for work when there is not enough user data in the initial stage of the establishment of the sampling equipment [22]. Generally, SVM is relatively stable when the amount of data increases, that is to say, when the amount of data increases slightly, SVM will not become a burden, and can still provide strong support for the fusion model.
From Figure 5, the random forest model achieves the same training effect as SVM when only 10% of the training data is trained to 90% of the training data, so it can be analyzed that the dimensionality information of the extracted data is still within the scope of the decision tree and will not cause serious noise resulting in unadaptability [23]. At the same time, it is found that the training effect is slightly decreased when the data is 40%. It can be seen that some samples tend to have a big impact on the model. Therefore, when the data is not perfect enough, the random forest cannot independently perform the recognition task, and auxiliary models are still needed. The fusion model exceeds individual models in accuracy because it combines the robust classification of Random Forest with the exact decision bounds of SVM. However, it requires more computing power because two different models must be used for prediction and training. Nevertheless, because of its ensemble variety, it may generalize more effectively than individual models.
4.3.2 Result analysis of multi-model fusion
Since SVM and random forest algorithm with relatively stable performance are not sensitive to perturbations of data set changes, they are equipped with 1/2 and 1/3 weights respectively. For the first time, the performance of the project with such an allocation exceeded the historical best of the two single models, as shown in Table 1.
The optimal accuracy of the three models.
The historical best accuracy of SVM, random forest and fusion model is 88.1%, 87.7% and 90.4%, respectively. The reason may be that there are many adjacent data in the data vector, that is, purely from the data law, the model is close to the probability judgment of the existing data. Therefore, in the case of using more model voting, the relatively confident model can balance the doubtful data to a large extent [24]. In settings with dense populations, model voting can lead to less sensitive detection, outcomes that are too smooth, and bias in favour of the dominant class. Higher false negatives come from its tendency to ignore minute variations over smooth data and favour the dominant class unfairly. For example, the probability of the existing data being divided into positive and negative samples on SVM is 0.51 and 0.49, but such probability is significantly separated in random forest due to the existence of large information gain. For example, the probability of positive and negative samples is 0.2 and 0.8, so if only two models are considered, they will eventually be divided into negative samples in the actual environment. The actual result will be more inclined to the confident model, so when the two models are trained as much as possible, the tolerance of the worse samples will be lower, so as to achieve further optimization of the actual effect. The actual data also proves the feasibility of the idea designed in this paper. The optimal AUC values of the three models are shown in Table 2, and the ROC curve of the fusion model in actual conditions is shown in Figure 6.
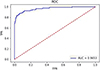 |
Fig. 6 ROC curve of fusion model. |
The optimal AUC values of the three models.
The ROC curve of the fusion model in the actual situation has the best performance, with AUC reaching 0.9653 and TPR exceeding 0.64 in the case of zero False Positive Threshold (FPT). The comprehensive performance is better than that of other individual models.
In order to further verify the performance of the fusion model presented in this paper, random verification was carried out on the data of normal and abnormal power users. Single user data included two groups of normal and abnormal power users, including the peak, normal, valley, load, line loss, voltage, current and power factor of electricity consumption [25]. The two groups of data are determined by the experienced staff as A group of normal user A and a household as abnormal user B. The two groups of data are respectively determined by the three models described above. The determination results are shown in Table 3.
Judgment results of the three models.
As can be seen from the data in the table, for the correct data, the three models are judged correct, but for the known abnormal customer data, RandomForest judged to be normal, and the staff according to the experience of judgment is contrary to the situation, so immediately arrange the work plan, go to the user A and B, the actual scene investigation, after the scene situation and data carefully compared, found that user A is a normal power customer, user B is an abnormal power customer, and through the previous analysis of the highest rate of the fusion model proposed in this article, two different cases of the user are judged correct, so selected as the optimal model in line with the actual needs of a single user to determine the situation.
5 Power measurement data anomaly correction scheme
The main causes of abnormal power measurement data are human factors and non-human factors. For the abnormal power measurement data detected, the following programs can usually be adopted to correct it. Machine learning techniques that handle noise and unpredictability in power measurement data include Random Forests and SVM. Random Forests filter out noise by averaging forecasts from numerous decision trees, SVMs utilize margin optimization and kernel functions to detect outliers, and Deep Learning models such as LSTM may find trends in data on power usage.
5.1 Inspection and detection of electric energy metering devices
The inspection and testing of electric energy metering devices mainly includes the pre-operation verification and filing of electric energy meters and mutual inductors [26]. The first verification and periodic verification after operation, fault handling, verification work after the replacement of main equipment. The specific content of the above work is clearly stipulated in the “JJG448-Electric Energy Measurement Technical Management Regulations”, which should be carried out in strict accordance with the requirements. This work is the most direct means to check and determine the abnormal measurement.
5.2 Electric energy remote acquisition system data analysis and early warning
The electric energy remote acquisition system has been fully built in the power grid enterprise, and has the ability to achieve 100% full collection. Through the comparative analysis between the collected data and the limit value, the early warning of the electric energy can be realized.
5.3 Power inspection work
Electricity inspection work is divided into periodic and temporary, periodic work is generally arranged and executed according to the user’s voltage level and power consumption, temporary work is arranged and carried out quickly because of sudden safety accidents, major activities and received reports [27]. Compared with the previous single means of looking for abnormal power customers, with the help of the data early warning of the electric energy remote acquisition system, the efficiency of the power inspection has been greatly improved.
5.4 Processing of abnormal power consumption behavior and charge catch-up
For the abnormal power consumption behavior verified on site, the staff will analyze the cause of the anomaly and determine whether it is man-made or non-human anomaly [28]. If the anomaly is caused by humans, people should be investigated for responsibility, take photographs on the scene, fill in the relevant documents for accident identification, and be signed by the responsible person, sent to the electricity accounting team for electricity loss recovery; If it is not man-made anomaly, it should first eliminate the fault point, ensure the operation of the main equipment, carry out remedial measures in a timely manner, restore the normal operation of the measuring device, minimize the scope of abnormal data marketing, analyze the anomaly afterwards, and carry out targeted investigation and rectification of the same equipment according to the anomaly.
6 Conclusion
To sum up, the abnormal measurement of power in the power grid is directly related to the actual economic interests of both sides of the power supply. How to accurately and quickly locate the metering point where the abnormal measurement occurs in the abnormal detection of power measurement data is the key to improve the solution and processing of the entire power measurement anomaly. Based on the advantages and disadvantages of SVM and Random Forest big data analysis methods, this paper adopts machine learning method to propose a multi-model fusion abnormal detection method of electric energy metering data, which deeply integrates the two machine learning algorithms, improves the discrimination and positioning accuracy of abnormal electricity consumption data, and verifies the performance of the model by using actual user data. The verification results show that the fusion model has the best performance in the actual situation.
In this paper, machine learning algorithm is used to give an anomaly detection method of electric energy measurement data, although certain research results have been achieved, but the problem of electric energy measurement anomaly involves two different fields of technology and management, and in practical application, the two are interrelated and inseparable, and this paper mainly discusses this problem from the technical aspect, the practical application effect is still unknown. With the construction of the ubiquitous power Internet of Things, the power metering device is still the key to data collection, with the upgrade of the terminal equipment, the collected data will be diversified, bringing more detailed analysis of user behavior.
Funding
No funds, grants were received by any of the authors.
Conflicts of interest
The authors report no declarations of interest.
Data availability statement
All data generated or analyzed during this study are included in the manuscript.
Author contribution statement
All author have contributed to the design and methodology of this study, the assessment of the outcomes and the writing of the manuscript.
References
- Zhuang C., Zhang B., Hu J., Li Q., Zeng R. (2016) Abnormal consumption pattern detection of power users based on unsupervised learning, Proc. CSEE 36, 2, 379–387. [Google Scholar]
- Coma-Puig B., Carmona J., Gavalda R., Alcoverro S., Martin V. (2016) Fraud detection in energy consumption: a supervised approach, in: 2016 IEEE International Conference on Data Science and Advanced Analytics (DSAA), IEEE, pp. 120–129. [CrossRef] [Google Scholar]
- Zhang R., Peng Z., Wu L., Yao B., Guan Y. (2017) Fault diagnosis from raw sensor data using deep neural networks considering temporal coherence, Sensors 17, 3, 549. [CrossRef] [PubMed] [Google Scholar]
- Kou Y., Cui G. (2017) Machine learning-based models for fault detection in automatic meter reading systems, in: 2017 IEEE International Conference on Security, Pattern Analysis, and Cybernetics (SPAC), IEEE, pp. 684–689. [CrossRef] [Google Scholar]
- Divina F., Gilson A., Goméz-Vela F., García Torres M., Torres J. F. (2018) Stacking ensemble learning for short-term electricity consumption forecasting, Energies 11, 4, 949. [CrossRef] [Google Scholar]
- Liu M., Chen W., et al. (2019) Research on a network traffic anomaly detection model based on K-means algorithm, Wirel. Internet Technol. 16, 18, 25–27. [Google Scholar]
- Wu R., Zhang A. (2020) Power data anomaly detection algorithm based on improved K-means, Journal of East China Normal University (Natural Science Edition) 2020, 4, 79–87. [Google Scholar]
- Ren B., Zheng Y., Wang Y., Sheng S., Li J., Zhang H., Zheng C. (2021) Research on fault location of secondary equipment of intelligent substation based on deep learning, Power Grid Technol. 45, 2, 713–721. [Google Scholar]
- Li X., Qi Z., Kang Z., Su Z. (2018) Power operation and maintenance data cleaning method based on isolated forest algorithm and BP neural network algorithm, Electr. Appl. 37, 16, 72–78. [Google Scholar]
- Thirusubramanian G. (2021) Machine learning-driven AI for financial fraud detection in IoT environments, Int. J. Hum. Resour. Manage. Organ. Behav. 9, 4, 9–25. [Google Scholar]
- Naresh K.R.P. (2023) Forecasting e-commerce trends: utilizing linear regression, polynomial regression, random forest, and gradient boosting for accurate sales and demand prediction, Int. J. Hum. Resour. Manage. Organ. Behav. 11, 3, 11–26. [Google Scholar]
- Naresh K.R.P. (2021) Optimized hybrid machine learning framework for enhanced financial fraud detection using e-commerce big data, Int. J. Manage. Res. Rev. 11, 2, 18–35. [Google Scholar]
- Mokhtari S., Abbaspour A., Yen K. K., Sargolzaei A. (2021) A machine learning approach for anomaly detection in industrial control systems based on measurement data, Electronics 10, 4, 407. [CrossRef] [Google Scholar]
- Takiddin A., Ismail M., Zafar U., Serpedin E. (2022) Deep autoencoder-based anomaly detection of electricity theft cyberattacks in smart grids, IEEE Syst. J. 16, 3, 4106–4117. [CrossRef] [Google Scholar]
- Singh V. K., Govindarasu M. (2021) A cyber-physical anomaly detection for wide-area protection using machine learning, IEEE Trans. Smart Grid 12, 4, 3514–3526. [CrossRef] [Google Scholar]
- Copiaco A., Himeur Y., Amira A., Mansoor W., Fadli F., Atalla S., Sohail S. S. (2023) An innovative deep anomaly detection of building energy consumption using energy time-series images, Eng. Appl. Artif. Intell. 119, 105775. [CrossRef] [Google Scholar]
- Choi K., Yi J., Park C., Yoon S. (2021) Deep learning for anomaly detection in time-series data: Review, analysis, and guidelines, IEEE Access 9, 120043–120065. [CrossRef] [Google Scholar]
- Siniosoglou I., Radoglou-Grammatikis P., Efstathopoulos G., Fouliras P., Sarigiannidis P. (2021) A unified deep learning anomaly detection and classification approach for smart grid environments, IEEE Trans. Netw. Serv. Manage. 18, 2, 1137–1151. [CrossRef] [Google Scholar]
- Sial A., Singh A., Mahanti A. (2021) Detecting anomalous energy consumption using contextual analysis of smart meter data, Wirel. Netw. 27, 4275–4292. [CrossRef] [Google Scholar]
- Himeur Y., Alsalemi A., Bensaali F., Amira A. (2020) A novel approach for detecting anomalous energy consumption based on micro-moments and deep neural networks, Cogn. Comput. 12, 6, 1381–1401. [CrossRef] [Google Scholar]
- Castellani A., Schmitt S., Squartini S. (2020) Real-world anomaly detection by using digital twin systems and weakly supervised learning, IEEE Trans. Ind. Inform. 17, 7, 4733–4742. [Google Scholar]
- Sater R. A., Hamza A. B. (2021) A federated learning approach to anomaly detection in smart buildings, ACM Trans. Internet Things 2, 4, 1–23. [CrossRef] [Google Scholar]
- Yamauchi M., Ohsita Y., Murata M. (2020) Anomaly detection in smart home operation from user behaviors and home conditions, IEEE Trans. Consum. Electron. 66, 2, 183–192. [CrossRef] [Google Scholar]
- Chen L., Lao K. W., Ma Y., Zhang Z. (2022) Error modeling and anomaly detection of smart electricity meter using TSVD+ L method, IEEE Trans. Instrum. Meas. 71, 1–14. [CrossRef] [Google Scholar]
- Katyare P., Joshi S. S. (2022) Electricity anomalies detection and automation in smart meter system, in: Senjyu T., Mahalle T., Perumal T., Joshi A. (eds), IOT with Smart Systems. Smart Innovation, Systems and Technologies, vol. 251, Springer, Singapore, pp. 453–462. [CrossRef] [Google Scholar]
- Kardi M., AlSkaif T., Tekinerdogan B., Catalão JPS (2021) Anomaly detection in electricity consumption data using deep learning, in: 2021 IEEE International Conference on Environment and Electrical Engineering and 2021 IEEE Industrial and Commercial Power Systems Europe (EEEIC/I &CPS Europe), IEEE, pp. 1–6. [Google Scholar]
- Carratù M., Gallo V., Iacono S. D., Sommella P., Bartolini A., Grasso F., Ciani L., Patrizi G. (2023) A novel methodology for unsupervised anomaly detection in industrial electrical systems, IEEE Trans. Instrum. Meas. 17, 7, 4733–4742. [Google Scholar]
- Li S., Pandey A., Hooi B., Faloutsos C., Pileggi L. (2021) Dynamic graph-based anomaly detection in the electrical grid, IEEE Trans. Power Syst. 37, 5, 3408–3422. [Google Scholar]
All Tables
All Figures
|
Fig. 1 SVM model basic construction training process. |
| In the text | |
|
Fig. 2 Basic training flow of random forest model. |
| In the text | |
|
Fig. 3 Data processing flowchart. |
| In the text | |
|
Fig. 4 Increment accuracy rate of SVM model. |
| In the text | |
|
Fig. 5 Incremental accuracy rate of random forest model. |
| In the text | |
|
Fig. 6 ROC curve of fusion model. |
| In the text | |
Current usage metrics show cumulative count of Article Views (full-text article views including HTML views, PDF and ePub downloads, according to the available data) and Abstracts Views on Vision4Press platform.
Data correspond to usage on the plateform after 2015. The current usage metrics is available 48-96 hours after online publication and is updated daily on week days.
Initial download of the metrics may take a while.