")
")
| Issue |
Sci. Tech. Energ. Transition
Volume 80, 2025
|
|
|---|---|---|
| Article Number | 13 | |
| Number of page(s) | 15 | |
| DOI | https://doi.org/10.2516/stet/2024107 | |
| Published online | 27 January 2025 | |
Regular Article
Research on frequency stability control method of multi-energy system considering grid-connected parameters of electric hydrogen energy coupling equipment
1
School of Electrical Engineering, Shenyang University of Technology, Shenyang 110870, Liaoning, China
2
Energy Technology Center, Aalborg University, Aalborg, DK-9220, Denmark
* Corresponding author: This email address is being protected from spambots. You need JavaScript enabled to view it.
Received:
4
July
2024
Accepted:
19
November
2024
Abstract
Renewable energy coupling hydrogen production technology can overcome the weakness of randomness and intermittence for renewable energy to a certain extent. However, due to the long-distance and reverse distribution of renewable energy generating units and the main network, there will be a risk of oscillation instability when a high proportion of power electronic hydrogen production system is interconnected with the power grid. Firstly, the impedance model of the electric hydrogen production system is established. The oscillation characteristics of hydrogen production system interconnected with power grid are analyzed. Secondly, the influence of electrolytic hydrogen system on the stability of multi-energy system is analyzed. The instability problems caused by input power fluctuation and hydrogen production rate change are studied. Then, an oscillation suppression strategy for renewable energy hydrogen production system based on power allocation is proposed. It is used to enhance the stability of the multi-energy system of the electrolytic water hydrogen production system. Finally, through the establishment of renewable energy electrolysis hydrogen experimental simulation system. The system frequency stability under different renewable energy output fluctuations and different impedance conditions of the system is verified. The simulation results show that the proposed multi-energy hydrogen production control method based on power allocation can ensure the stability of the system under the fluctuation of renewable energy output.
Key words: Hydrogen production / Sub-synchronous oscillation / Frequency adaptive / Oscillation characteristic
© The Author(s), published by EDP Sciences, 2025
 This is an Open Access article distributed under the terms of the Creative Commons Attribution License (https://creativecommons.org/licenses/by/4.0), which permits unrestricted use, distribution, and reproduction in any medium, provided the original work is properly cited.
1 Introduction
In recent years, the global energy landscape has been undergoing a significant transformation towards a more sustainable and renewable future. The integration of multiple energy sources, such as solar, wind, and hydrogen, has emerged as a promising approach to enhance energy efficiency, reduce greenhouse gas emissions, and promote energy independence. Multi-energy systems, which combine various energy generation, storage, and conversion technologies, play a crucial role in achieving these goals by enabling the synergistic utilization of diverse energy resources.
Among the different components of multi-energy systems, the electrolytic hydrogen system stands out as a key technology for energy storage and conversion. Electrolytic hydrogen production involves the electrolysis of water using electricity generated from renewable sources to produce hydrogen gas, which can be stored and utilized for various applications, including power generation, transportation, and industrial processes. The flexibility and scalability of electrolytic hydrogen systems make them well-suited for integrating intermittent renewable energy sources and balancing energy supply and demand in multi-energy systems [1].
The large-scale development and utilization of renewable energy such as wind energy and solar energy has become the key direction of green and low-carbon energy transformation in the world. Coupling hydrogen production technologies such as wind power and photovoltaic can overcome the weakness of randomness and intermittency of wind power to a certain extent [2].
However, the dynamic characteristics of electrolytic hydrogen systems present challenges to the stability and reliability of multi-energy systems. The nonlinear and time-varying behavior of electrolytic hydrogen production, influenced by factors such as fluctuating input power, varying electrolyzer efficiency, and changing hydrogen demand, can lead to system instabilities and performance degradation. Therefore, developing effective stability control methods tailored to the unique characteristics of electrolytic hydrogen systems is essential to ensure the optimal operation of multi-energy systems [3].
In the context of domestic research on stability control methods for multi-energy systems with electrolytic hydrogen systems, several studies have been conducted to investigate the dynamic behavior and control strategies of such systems. Researchers have explored the modeling and simulation of electrolytic hydrogen production processes, the integration of electrolytic hydrogen systems with renewable energy sources, and the design of control algorithms to optimize system performance. For example, Reference [4] proposed a predictive control strategy for coordinating the operation of electrolytic hydrogen systems in multi-energy systems, considering uncertainties in renewable energy generation and hydrogen demand.
Reference [5] developed a robust control approach based on adaptive fuzzy logic for stabilizing multi-energy systems with electrolytic hydrogen systems under varying operating conditions. Reference [6] proposed a model predictive control approach for coordinating the operation of electrolytic hydrogen systems with variable renewable energy sources in microgrid applications. Additionally, Reference [7] investigated the impact of electrolytic hydrogen systems on the stability of multi-energy systems and proposed a hierarchical control framework to improve system resilience and performance. These international studies demonstrate the importance of considering the dynamic interactions between energy sources, conversion devices, and loads in multi-energy systems with electrolytic hydrogen technologies. Collaborative research efforts and knowledge exchange between domestic and international researchers can further accelerate the development and implementation of advanced stability control methods for multi-energy systems [8].
Reference [9] proposed an efficiency optimization strategy in the scenario of new energy hydrogen production, and constructed an optimal scheduling model under the optimal hydrogen production efficiency. The particle swarm optimization is used to optimize the solution. The simulation analysis proves that the proposed method can effectively improve the hydrogen production capacity and income of the system. Reference [10] proposed a complementary structure for the operation of multi-type electrolytic cell systems. By improving the configuration ratio of different types of electrolytic cells in the system, the energy characteristics and economy of the overall electrolysis system under fluctuating power supply are improved. In terms of improving the efficiency of hydrogen production. Reference [11] proposed a hydrogen production efficiency improvement strategy based on piecewise fuzzy control. An optimal scheduling model under the improvement of hydrogen production efficiency is constructed. The artificial bee colony algorithm is used to solve the problem, which ensures the efficiency of the electrolytic cell and the safety of hydrogen production. Reference [12] studied the characteristics of hydrogen production from electrolytic water and proposed a coordinated hydrogen production strategy for hydrogen production mode allocation and energy storage day-ahead planning.
This research aims to investigate stability control methods for multi-energy systems based on the characteristics of electrolytic hydrogen systems. By analyzing the dynamic interactions between different energy sources, conversion devices, and loads in a multi-energy system, this study seeks to design robust control strategies that can enhance system stability, mitigate disturbances, and improve overall performance. The focus is on leveraging the inherent capabilities of electrolytic hydrogen systems to enhance the resilience and efficiency of multi-energy systems in the face of varying operating conditions and uncertainties.
The main research of this paper is as follows: Section 2 outlines the working principles and characteristics of electrolytic hydrogen production systems, highlighting their role in multi-energy systems. The impact of electrolytic hydrogen production system on the stability of multi-energy system is analyzed, and the impedance characteristics of electrolytic water-to-hydrogen system are modeled. Section 3 proposes a power allocation stability control method for the characteristics of the electrolytic hydrogen production system. Section 4 describes the simulation model developed to validate the proposed control method and presents the simulation results. The practical application of the stability control method is demonstrated in an actual multi-energy system. Finally, Section 5 summarizes the main research results of this paper and looks forward to future research directions.
By addressing the stability challenges associated with electrolytic hydrogen systems in multi-energy systems, this research aims to contribute to the advancement of sustainable energy systems and facilitate the transition towards a low-carbon and resilient energy future.
2 Impedance modeling of electrolytic water to hydrogen plant
2.1 Circuit and control structure of electrolyzed water to hydrogen equipment
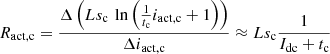
Since the hydrogen production capacity of the electrolyzer is related to the DC current magnitude, the rectifier will be controlled by constant DC. The trigger pulse Pn applied to the nth thyristor is generated by the trigger angle α and the nth voltage reference phase angle θn through the phase control module where α is obtained by current control. In the current control loop, idc and  are the electrolyzer operating current and its reference value, respectively. Gim(s) is a first-order low-pass filter for detecting the DC current. HPI(s) is a PI regulator of the DC current control loop. θn is generated by the three-phase voltages ua, ub, and uc of the common coupling point (PCC) through the phase-locked loop control. The control is performed by a phase-locked loop. Among them, HPLL(s) is the transfer function of the phase-locked loop. ud and uq are the d-axis and q-axis voltages. ω1 is the industrial frequency angular velocity. abc/dq is the coordinate transformation link. θn(0) is the hysteresis phase of the nth thyristor. mod is the remainder operation module. 1/s is the integration link. The control structure of the electrolyzed water to hydrogen plant is shown in Figure 1.
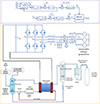 |
Fig. 1 Control structure of water electrolysis hydrogen production device. |
2.2 Small-signal impedance model of electrolytic baths
Applying a DC voltage between the electrodes of an electrolyzer can cause the transfer of ions and electrons in the electrolyte. Redox reactions occur at the positive and negative electrodes, respectively. The water molecules are decomposed into hydrogen and oxygen. Each electrolyzer stack consists of L electrolyzer monoblocks. The total electrolyzer reversible voltage urev is determined by the Gibbs energy of the electrolysis process and the number of electrolyzer monomers and can be expressed as [13]: (1)where: ΔG is the Gibbs free energy; T is the operating temperature; ΔH is the enthalpy change; ΔS is the entropy change; z is the number of electrons to be transferred to produce 1 mole of hydrogen; F is Faraday’s constant.
Compared to the effect of temperature on the reversible voltage, the effect of pressure is negligible. Therefore, equation (1) can be organized to have a function of temperature as follows: (2)where: u0, u1, u2, u3 are voltage empirical coefficients; T0 is the absolute temperature. The DC current flowing through the electrolyte during the chemical reaction will produce an overvoltage that reduces the efficiency of the electrolyzer, causing irreversible energy loss. Therefore, the electrolyzer terminal voltage should be expressed as the sum of the reversible voltage and the overvoltage.
 (3)where: uohm is the ohmic overvoltage, which corresponds to the ohmic phenomenon in the cell; uact,a and uact,c are the anodic activation overvoltage and cathodic activation overvoltage, which correspond to the activation phenomenon of the anodic and cathodic reactions, respectively.
2.2.1 Ohm overvoltage
The ohmic phenomenon in the electrolysis process is mainly caused by the resistance of the electrolytic cell assembly to the charge flow. According to Ohm’s law, uohm is proportional to the current flowing through the electrolytic cell, which can be expressed as [14]: (4)where: iE is the instantaneous current flowing through the electrolytic cell; A is the surface area of electrolytic cell; r1, r2, r3, r4 are the area specific resistance coefficients of the electrolytic cell monomer.
Since the ohmic overvoltage will immediately respond to the change of the current, the ohmic resistance Rohm under the small signal disturbance can be calculated as: (5)
(5)
2.2.2 Activation overvoltage
In the activation phenomenon, when the redox reaction rate changes, the electrolyte interface that undergoes load transfer will appear as a dielectric medium, resulting in overcharge on the electrode surface, which needs to be compensated by the accumulation of polar opposite ions in the electrolyte. These two opposite charges are called the double-layer effect, which is the main reason for the dynamic response of the electrolytic cell. The electrical properties of the two-layer effect and the charge transfer related to the activation process can be represented by the RC network [15, 16].
According to the modified Tafel equation, the activation overvoltage is a nonlinear function of the activation current, which can be expressed as: (6)
(6)
 (7)where: sc, sa, ta, tc are temperature-dependent Tafel empirical coefficients; uact,a and uact,c are the anode activation overvoltage and cathode activation overvoltage, respectively; iact,a and iact,c are the activation currents involved in the anode and cathode activation processes, respectively.
According to equations (6) and (7), the activation resistance at a specific steady-state operating point can be calculated by applying a small current perturbation Δiact: (8)
(8)
 (9)where: Idc is the DC steady state value of idc; Ract,a and Ract,c are the activation resistances modeling the activation process of anode and cathode, respectively. Combining the above equation and also considering the series coupling of the anode and cathode of the electrolyzer, the small-signal impedance model ZE(s) of the alkaline electrolyzer can be obtained.
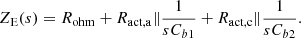 (10)
(10)
In the formula: Cbl and Cb2 are double-layer capacitors that simulate the dynamic charge accumulation behavior of anode and cathode, respectively. The capacitance value can be considered to be independent of the operating conditions of the electrolytic cell, and is set to a constant value here [17].
When s = 0, the double-layer capacitor can be considered as open circuit. The DC voltage source usr can be equivalent to the resistor usr/Idc, and the activation resistor is obtained by dividing the uact and Idc. (11)
(11)
 (12)
(12)
where: Ract0,a and Ract0,c are the anode activation resistance and cathode activation resistance in the DC state, respectively. In summary, combined with the DC side filter circuit, the electrolytic cell equivalent circuit shown in Figure 2 can be obtained.
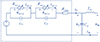 |
Fig. 2 Electrolytic cell equivalent circuit. |
Where udc is the DC side voltage of the hydrogen production equipment. According to the equivalent circuit of the electrolytic cell, the DC port impedance Zdc(s) of the hydrogen production equipment can be obtained: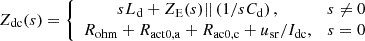 (13)
(13)
2.3 AC impedance model of water electrolysis hydrogen production equipment
The udc frequency domain expression can be calculated by convolution between the mapping function and the secondary voltage of the transformer.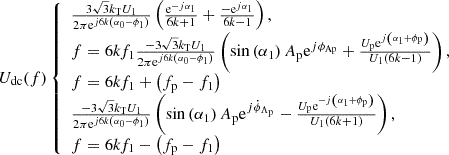 (14)
(14)
where: α1 = α0 + π/3. Combining formula (14) and formula (9), the frequency domain component of Idc(f) can be obtained by dividing Udc(f) and Zdc(f), and then the frequency domain expression of AC side current Ia is calculated by convolution theorem.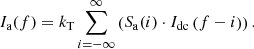 (15)
(15)
Substituting fp and fp − 2f1 into equation (15), the perturbation component Ia (fp) and the frequency coupling component Ia (fp − 2f1) of Ia in the frequency domain can be obtained. Then, Ia (fp) and Ia (fp − 2f1) are divided by the frequency domain expression 0.5 Upe
jφp
of the disturbance voltage respectively, and the positive sequence admittance Y11(s) and its frequency coupling term Y21(s) of the AC port of the electrolytic water hydrogen production equipment can be obtained. The expression is shown in formula (16) [18, 19].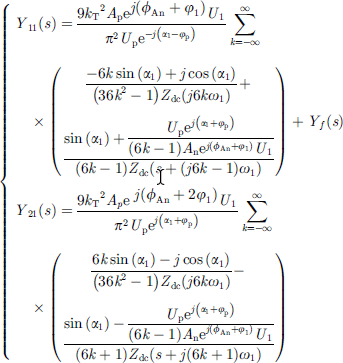 (16)
(16)
The AC harmonic current generated by the six-pulse thyristor rectifier bridge is mainly concentrated at the 5th and 7th fundamental frequencies. In this regard, the filter circuit uses two sets of single-tuned filters to filter out the 5th and 7th harmonic currents respectively. For higher harmonic currents of 11th and above, a high-pass filter is used to filter them, as shown in Yf(s) in equation (17). Among them, R5, L5, and C5 are the resistance, inductance, and capacitance of five times single tuned filter respectively. R7, L7, and C7 are the resistance, inductance, and capacitance of seven times single tuned filter, respectively. R11, L11, and C11 are the resistance, inductance, and capacitance of the 11 high-pass filter. (17)
(17)
By setting the small signal voltage disturbance as a negative sequence disturbance, the negative sequence admittance Y22 (s) and its frequency coupling term Y12 (s) of the electrolytic water hydrogen production equipment can be obtained.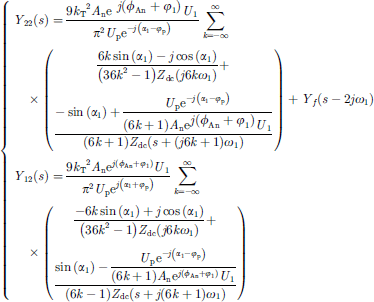 (18)
(18)
3 Stability analysis of renewable energy hydrogen production system
For multiple hydrogen production equipment in the system, two hydrogen production equipments are taken as an example. The admittance matrix of the hydrogen production equipment is merged into YHY, combined with the renewable energy generation grid-connected impedance model YDFIG that also needs to consider the frequency coupling effect, the admittance matrix YRH of the wind power hydrogen production system can be obtained.![Mathematical equation: $$ {\mathbf{Y}}_{\mathrm{RH}}=\left[\begin{array}{cc}{Y}_{\mathrm{R}11}& {Y}_{\mathrm{R}12}\\ {Y}_{\mathrm{R}21}& {Y}_{\mathrm{R}22}\end{array}\right]={\mathbf{Y}}_{\mathrm{DF}F\mathrm{G}}+{\mathbf{Y}}_{\mathrm{HY}} $$](/articles/stet/full_html/2025/01/stet20240212/stet20240212-eq20.gif) (19)
(19)
where: YR11, YR21, YR22, and YR12 represent the positive sequence admittance, positive sequence admittance coupling term, negative sequence admittance, and negative sequence admittance coupling term of the impedance model of renewable energy power generation hydrogen production system, respectively.
Capacity matching design of electric hydrogen production participating in system frequency modulation.
When the system frequency changes, the rotor speed of the synchronous unit has a coupling relationship with the grid frequency. The frequency change is limited to a very small range. Because the system frequency rise and fall is similar. The increase in frequency is less than the decrease, so only the downward fluctuation of frequency is analyzed below. The energy source of the inertia response of the synchronous unit is the kinetic energy of the rotor. It is assumed that the grid frequency decreases from 50 Hz to f1. In the process of frequency modulation, the speed change of the synchronous unit is f1/50 ~ 1 pu. The rotor kinetic energy released by the synchronous unit is: (20)
(20)
According to the law of conservation of energy, the electric hydrogen production system has the same inertia response characteristics as the traditional power plant. The energy released by the inertia response process should be equivalent to the synchronous unit: (21)
(21)
In the formula: PN is the rated power of generator. It is assumed that the time for the wind-storage hydrogen power station to participate in the system inertia response is consistent with the inertia time constant of the synchronous generator set. That is, TJ = Δt, then the power required for the wind storage hydrogen production power station to complete the inertia response is: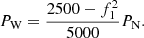 (22)
(22)
It can be seen from the power frequency characteristic curve of the synchronous unit that when the system frequency drops to f1. The power support provided by the droop characteristic is: (23)where: K is the droop coefficient of the generator. In summary, if the electric hydrogen production power station has the same primary frequency modulation effect as the traditional power plant, the total amount of frequency modulation power to be provided is:
 (24)where: PP2H is the load shedding power of the electric hydrogen production response to primary frequency modulation and PSC is the power released by the energy storage device in response to primary frequency modulation. The total power required to complete the primary frequency modulation of the electricity hydrogen production system is PWSP. It is jointly undertaken by the energy storage device and the electric hydrogen production device.
3.1 Equivalent SISO impedance model and oscillation characteristics analysis
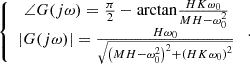
According to the formula (19), the wind power hydrogen production system is a typical multi-input multi-output system. In order to analyze its grid-connected stability more intuitively, it needs to be equivalent to a Single-Input Single-Output (SISO) system. Because the frequency coupling effect cannot be ignored, this paper adopts the SISO impedance model transformation method which is equivalent to the generalized Nyquist criterion in judging the critical stable point. The non-diagonal elements of the admittance matrix YRH of the wind power hydrogen production system are transformed to the main diagonal line together with the grid impedance. The specific conversion process is as follows: (25)where: Zgn = (s − 2jω1)Lg, which represents the negative sequence impedance of the power grid. ZSISO is the equivalent SISO impedance of the renewable energy power generation hydrogen production system. Figure 3 shows the equivalent SISO impedance Bode diagram of the wind power hydrogen production system when the impedance is 0.5 and 0.2 respectively under the rated operating conditions of each unit. The black line in the diagram represents the power grid impedance bode diagram. It can be seen from Figure 4 that due to the addition of the active controller, there is an obvious negative resistance band in the hydrogen production system of renewable energy generation. When the equivalent SISO amplitude-frequency characteristic curve intersects with the grid impedance characteristic curve in the negative resistance frequency band. When the phase difference between the intersection point and the grid impedance exceeds 180°, it will lead to oscillation instability. When the SCR is 0.5, the intersection phase at 78 Hz is in the negative resistance region, and the phase difference between the equivalent SISO impedance at the intersection and the grid impedance reaches 198°. It shows that 78 Hz and 22 Hz resonance will be generated at this time. When SCR is 0.2, the intersection point at 98 Hz is located in the passive region within positive and negative 90°. It shows that the hydrogen production system of renewable energy power generation is in a stable state at this time. Therefore, with the decrease of SCR, the intersection point of the amplitude-frequency characteristic curve in the middle frequency band will move towards the negative resistance region with a difference of 180° from the grid impedance. The interconnected system composed of renewable energy power generation hydrogen production device and inductive weak grid is prone to oscillation.
 |
Fig. 3 Impedance Bode diagram under different short circuit ratio. |
 |
Fig. 4 Control flow chart. |
With the decrease of T, the intersection point where the equivalent SISO impedance amplitude-frequency characteristic curve and the grid impedance amplitude-frequency characteristic curve may oscillate gradually shifts from the negative resistance region to the passive region. The interconnected system tends to be stable. It shows that when T increases, the reversible voltage and overvoltage are reduced to varying degrees. The hydrogen production power decreases, which affects the trigger angle of the rectifier and weakens the equivalent resistance of the electrolytic cell. As a result, the renewable energy power generation hydrogen production system exhibits stronger negative resistance and capacitance near the intersection point, making the system prone to oscillation.
3.2 Design of SSO suppressor based on adaptive quasi-resonant controller
The SSO frequency variation has a great influence on the oscillation suppression strategy. Therefore, this section uses a frequency adaptive algorithm to improve the quasi-resonant controller, thereby suppressing the oscillation component in the DC bus voltage and output power of the hydrogen production system for renewable energy generation.
The classical quasi-resonant controller is shown in equation (26) [20–23].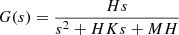 (26)
(26)
where: H = 2KR ωc, K = 1/KR, M = ω0 2/2KR ωc, KR, ω0, ωc are the gain coefficient, the resonant frequency, and the cut-off frequency.
In equation (26), the parameter M is related to the resonant frequency, so it is necessary to design an adaptive algorithm to realize the real-time adjustment of the parameter M. The adaptive quasi-resonant controller is shown in Figure 5.
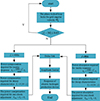 |
Fig. 5 Adaptive resonance control. |
The input signal of the adaptive quasi-resonant controller is vin = Asin(ω0
t). According to the formula (22), the output vout is expressed as:![Mathematical equation: $$ {v}_{\mathrm{out}}=A|G(\mathrm{j}\omega )|\mathrm{sin}\left[{\omega }_0t+{\angle G}(\mathrm{j}\omega )\right] $$](/articles/stet/full_html/2025/01/stet20240212/stet20240212-eq28.gif) (27)
(27)
 (28)
(28)
According to equation (28), when the input signal frequency is ω0, the output signal vout = (A/K)sin(ω0 t). Let K = 1, then the input and output are consistent. When the frequency changes, the difference between vin and vout can be approximated as a linear relationship in a small range. Therefore, the PI controller can be used to track the difference between vin and vout without error, and so to achieve the requirement of adaptive resonant frequency.
The control unit equation of the electric hydrogen production device is: (29)where: Del is the control signal of the electric hydrogen production system; Kp1 and Kp2 are the proportional regulation gain and integral regulation gain of the current loop, respectively; Ielref and Iel are the reference value and feedback value of the electrolytic cell current, respectively; Ueldc is the voltage value of the DC bus of the electric hydrogen production system.
In summary, considering the working characteristics of the electrolytic cell itself, combined with the control unit equation of the electric hydrogen production device, the control strategy of the electric hydrogen production system is established as follows:
Let the total power required for primary frequency modulation be PWSP. When the load reduction response of the electric hydrogen production device responds to the power command, the change of inertia due to factors such as temperature has a response delay characteristic. Therefore, the reference power value of the electric hydrogen production device is obtained through the delay link. The limiter makes the electric hydrogen production device participate in the system frequency modulation in the working range. The power command that the electric hydrogen production device needs to bear is PP2H. The ratio of the actual voltage Uel at both ends of the electrolytic cell produces a reference current instruction Ielref. The control signal Del of the electric hydrogen production device is obtained by PI control of the difference between the Ielref and the actual current Iel.
Combined with the above mentioned electric hydrogen production and super capacitor energy storage device control strategy. The multi-energy cooperative control strategy of the electric hydrogen production power station is established, and the overall control flow chart is shown in Figure 4.
It can be seen from Figure 4 that when the system frequency changes, the phase-locked loop first feeds back the system frequency change value. 0.03 Hz is the system frequency adjustment dead zone limit setting.
3.3 Electrolyzer hydrogen production system array power distribution method
Conventional electrolyzer hydrogen production equipment start-stop controls are electrolyzer array sequentially start to the rated power, electrolyzer rated power PEL,e, start-stop process is as shown in Figure 6.
 |
Fig. 6 Characteristic curve of electric hydrogen production. |
Considering the characteristics of hydrogen production by water electrolysis, an electrolyzer array operation method taking into account the characteristics of the electrolyzer is proposed. The rated power is 25 kW, and its power efficiency and hydrogen production by water electrolysis are shown in Figure 4. When the hydrogen production by water electrolysis power is low, the hydrogen production by water electrolysis efficiency changes rapidly with the increase of power, and the maximum hydrogen production by water electrolysis efficiency is 89%. The maximum hydrogen production by water electrolysis power is 12 kW (at the top dotted line). When the power is higher than the maximum efficiency point, the hydrogen production by water electrolysis efficiency gradually decreases until 63%. Using the conventional start-stop method to first ensure that the single row tank is at rated power will lead to low hydrogen production by water electrolysis efficiency. In order to ensure the safety and high efficiency of the electrolysis hydrogen production by water electrolysis system in the system, the hydrogen production by water electrolysis power segmentation interval is taken as the premise, and the hydrogen production by water electrolysis power to improve the efficiency is formulated in the corresponding interval by blurring the difference between the average value of the input power and the optimal efficiency of hydrogen production by water electrolysis power. Reasonable distribution of output power is realized by constant dynamic adjustment through feedback comparison [20, 24, 25]. The flow chart of hydrogen production based on electrolyzer characteristics is shown in Figure 7. The number of electrolyzer arrays is set to L (L = 50). Where: Pin is the input average power, Peg is the input total power, Pel is the total power of the electrolyzer, PPEMEL,e is the rated power of the electrolyzer, PPEMEL,h is the power of the maximum efficiency of the electrolyzer, and PPEMEL,min is the minimum start-stop power of the electrolyzer. If the power is lower than this power, there will be a safety risk, the specific start-stop mode can be expressed as follows:
-
When the hydrogen production power Pin < PPEMEL,min, all electrolyzers run intermittently. That is, PPEMEL,i = 0 and total hydrogen production power PPEMEL = 0.
-
When hydrogen production by water electrolysis power PPEMEL,min < Pin < PPEMEL,h. The first k electrolyzers run at maximum efficiency point power (PPEMEL,s = PPEMEL,h, s ∈ [k + 1, L]), the remaining electrolyzers run intermittently, and the total hydrogen production power PPEMEL = kPPEMEL,h.
-
When the hydrogen production power Pin = PPEMEL,h. the electrolyzers run at the highest efficiency point power (PPEMEL,i = PPEMEL,h, i ∈ [1, L]), and the total hydrogen production power PPEMEL = LPPEMEL,h.
-
When the hydrogen production power PPEMEL,h < Pin < PPEMEL,e. The first k electrolyzers operate at rated power (PPEMEL,i = PPEMEL,e, i ∈ [1, k]), and the second L-k electrolyzers operate at the highest efficiency point power (PPEMEL,s = PPEMEL,e, s ∈ [k + 1, L]), the total hydrogen production power PPEMEL = kPPEMEL,e + (L-k)PPEMEL,h.
-
When the hydrogen production power Pin = PPEMEL,e. the electrolyzer runs at rated power (PPEMEL,i = PPEMEL,e, i ∈ [1, L]) and the total hydrogen production power PPEMEL = NPPEMEL,e.
-
When the hydrogen production power PPEMEL,e < Pin < 1.2PPEMEL,e. the first k electrolyzers are operated at overload power (PPEMEL,i = 1.2PPEMEL,e, i ∈ [1, k]), the last L-k electrolyzers are operated at rated power (PPEMEL,s = PPEMEL,e, s ∈ [k + 1, L], and the total hydrogen production power PPEMEL = kPPEMEL,e + (L-k)PPEMEL,h.
-
When the hydrogen production power Pin = 1.2PPEMEL,e. the electrolyzer is operated at overload power (PPEMEL,i = 1.2PPEMEL,e, i ∈ [1, L]) and the total hydrogen production power PPEMEL = 1.2PPEMEL,e.
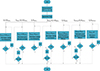 |
Fig. 7 Multiple electrolyzer hydrogen production power allocation process. |
4 Experiments and simulations
Different impedance operating conditions of the hydrogen production unit were considered during the testing of the electric hydrogen production control system. The effects of system high voltage ride-through and low voltage ride-through on hydrogen production due to fluctuations in renewable energy generation are tested. In order to verify the correctness of the above discussion, this paper builds a time-domain simulation model of a renewable energy hydrogen production system connected to an inductively weak grid as shown in Figure 8.
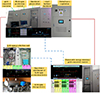 |
Fig. 8 Experimental platform for connecting inductive weak grids to hydrogen production systems from renewable energy sources. |
The simulation is carried out under the condition of large and small output of renewable energy in the system. Under different impedance conditions of the hydrogen production device, the influence of renewable energy fluctuation on the system voltage is as follows:
1) The experiment of high power low voltage ride through caused by renewable energy power generation under different impedances is carried out. The experimental results are shown in Figures 9 and 10.
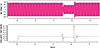 |
Fig. 9 Impedance is 0.25, three-phase voltage drop in high power operation. |
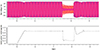 |
Fig. 10 Impedance is 0.55, two-phase voltage drop in high power operation. |
It can be seen from Figure 8 that in the test of large renewable energy output and simulated low voltage ride through characteristics. The start-up of the model is completed before 4.5 s. Increase the output of renewable energy at 5 s. At 5.4 s, the power reaches 0.9 times of the rated capacity. The three-phase voltage of the power grid drops to 20% at 7.5 s ~ 8.125 s. At 7.5 s, it enters the low voltage ride through state. At 8.2 s, it is out of the low voltage ride through state. It is not off-grid within 625 ms after entering low voltage ride through. When the negative impedance characteristics of the hydrogen production system of renewable energy power generation and the grid oscillate, the proposed control method does not cause the system to be disconnected from the grid.
It can be seen from Figure 10 that in the test of large renewable energy output and simulated low voltage ride through characteristics. The start-up of the model is completed before 4.5 s. Increase the output of renewable energy at 5 s. At 5.4 s, the power reaches 0.9 times of the rated capacity. At 7.5 s ~ 8.125 s, the two-phase voltage of power grid A and B drops to 20%. At 7.5 s, it enters the low voltage ride through state. At 8.2 s, it is out of the low voltage ride through state, and it is not out of the network within 625 ms after entering the low voltage ride through. The power distribution control of renewable energy generation does not cause the system to be off-grid.
2) The experiment of high power and high voltage crossing caused by renewable energy power generation is carried out. The experimental results are shown in Figure 10.
It can be seen from Figure 11 that the experiment of simulating high voltage ride through characteristics when the renewable energy output is large. The start-up of the model is completed before 4.5 s. Increase the output of renewable energy at 5 s. At 5.4 s, the power reaches 0.9 times of the rated capacity. At 7.5 s ~ 8 s, the three-phase voltage of the power grid rises to 130%. At 7.5 s, it enters the high voltage ride through state. At 8 s, it is out of the high voltage crossing state. It is not disconnected within 500 ms after entering high voltage ride through. The power distribution control of renewable energy generation does not cause the system to be off-grid.
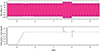 |
Fig. 11 Impedance is 0.25, high power operation and three-phase voltage rise. |
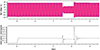 |
Fig. 12 Impedance is 0.25, low power operation and three-phase voltage drop. |
3) The experiments of low power low voltage and low power high voltage ride through caused by renewable energy power generation under different impedances are carried out. The experimental results are shown in Figures 11–13.
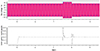 |
Fig. 13 Impedance is 0.25, low power operation and three-phase voltage rise. |
It can be seen from Figure 12 that in the test of simulated low voltage ride through characteristics with low renewable energy output, the model starts up before 4.5 s. The renewable energy output is increased at 5 s, and the power reaches 0.2 times of the rated capacity at 5.1 s. The three-phase voltage of the power grid drops to 20% at 7.5 s ~ 8.125 s. At 7.5 s, it enters the low voltage ride through state. At 8.15 s, it is out of the low voltage ride through state, and it is not off-grid within 625 ms after entering the low voltage ride through. The power distribution control of renewable energy generation does not cause the system to be off-grid.
It can be seen from Figure 13 that in the test of simulated high voltage ride through characteristics with low renewable energy output, the model starts up before 4.5 s. Increase the output of renewable energy at 5 s. The power reaches 0.2 times of the rated capacity at 5.1 s. At 7.5 s ~ 8s, the three-phase voltage of the power grid rises to 130%. At 7.5 s, it enters the high voltage ride through state. At 8 s, it is out of the high voltage ride through state, and it is not out of the network within 500 ms after entering the high voltage ride through. The power distribution control of renewable energy power generation does not cause the system to be disconnected.
It can be seen from Figure 14 that in the test of simulated high voltage ride through characteristics with low renewable energy output, the model completes the start-up before 4.5 s. The power is increased at 5 s. At 5.1 s, the power reaches 0.2 times of the rated capacity. At 7.5 s ~ 8 s, the three-phase voltage of the power grid rises to 130%. At 7.5 s, it enters the high voltage ride through state. At the 8th s, it breaks away from the high voltage crossing state and does not break away from the network within 5 s after entering the high voltage crossing. The power distribution control of renewable energy power generation does not cause the system to be disconnected.
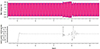 |
Fig. 14 Impedance is 0.55, low power operation and three-phase voltage rise. |
In the electrolytic water to hydrogen system, the impedance of the electrolyzer, electrolyte, electrolytic load and other components will change with the change of frequency. The power allocation control method based on multiple electrolytic water hydrogen production equipment proposed in this paper can be obtained through the above simulation analysis. It can ensure the stable operation of the system in case of low-voltage ride-through or high-voltage ride-through of renewable energy.
A multi-energy system electric hydrogen production simulation system model is established to verify the effectiveness of the method proposed in this paper as shown in Figure 15. The influence of impedance characteristics of hydrogen production system on the grid frequency is a complex issue. In this paper, the proposed method is used to analyze the impact of the impedance characteristics of hydrogen production from electrolytic water on the system frequency. Separately set in the electric hydrogen production equipment output power under different circumstances of the grid node frequency changes. Through the simulation results can be seen that the system frequency is convergence trend, not found destabilized sub-synchronous oscillation phenomenon. When W1, W2, W3, W4 operating state changes, the system impedance fluctuations in the case of system frequency changes are shown in Figures 16–19, respectively.
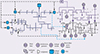 |
Fig. 15 Multi-energy electric hydrogen production system. |
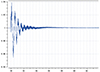 |
Fig. 16 The impedance change of W1 corresponds to the grid frequency. |
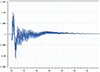 |
Fig. 17 The impedance change of W2 corresponds to the grid frequency. |
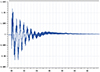 |
Fig. 18 The impedance change of W3 corresponds to the grid frequency. |
 |
Fig. 19 The impedance change of W4 corresponds to the grid frequency. |
Through the analysis of the above simulation results, it can be seen that the proposed control strategy can effectively improve the frequency response characteristics of the actual multi-energy system. For a large number of electric hydrogen production equipment system frequency improvement effect is remarkable.
5 Conclusion
In this paper, a renewable energy hydrogen production system based on power distribution and stability control of multi-energy system is proposed, and its effectiveness in suppressing sub-synchronous oscillation of new energy grid-connected system is analyzed. The main work is summarized as follows:
-
The electrical dynamic model of hydrogen production system is constructed. Its joint simulation with renewable energy power generation system is realized. It lays a foundation for further exploring the influence of hydrogen production system on the dynamic characteristics of power grid.
-
The power grid strength and the operating conditions of the hydrogen production system will have an impact on the stability of the wind power hydrogen production system. Among them, the lower the short circuit ratio of the power grid and the smaller the working current of the hydrogen production equipment, the easier it is for the interconnected system to produce resonance.
-
Increasing the proportional gain of the phase-locked loop or reducing the proportional gain of the current loop can effectively improve the stability of the wind power hydrogen production system under the inductive weak grid.
Funding
This work was supported by the National Key Research and Development Program of China under Grant No. 2017YFB0902100.
References
- Neuwirth M., Fleiter T., Manz P., Hofmann R. (2022) The future potential hydrogen demand in energy-intensive industries – a site-specific approach applied to Germany, Energy Convers. Manag. 252, 115052. https://doi.org/10.1016/j.enconman.2021.115052. [CrossRef] [Google Scholar]
- Moritz M., Schonfisch M., Schulte S. (2023) Estimating global production and supply costs for green hydrogen and hydrogen-based green energy commodities, Int. J. Hydrogen Energy 48, 9139–9154. https://doi.org/10.1016/j.ijhydene.2022.12.046. [CrossRef] [Google Scholar]
- Egerer J., Farhang-Damghani N., Grimm V., Runge P. (2024) The industry transformation from fossil fuels to hydrogen will reorganize value chains: big picture and case studies for Germany, Appl. Energy 358, 122485. https://doi.org/10.1016/j.apenergy.2023.122485. [CrossRef] [Google Scholar]
- Bach H., Bergek A., Bjørgum Ø., Hansen T., Kenzhegaliyeva A., Steen M. (2020) Implementing maritime battery-electric and hydrogen solutions: a technological innovation systems analysis, Transp. Res. D Transp. Environ. 87, 102492. https://doi.org/10.1016/j.trd.2020.102492. [CrossRef] [Google Scholar]
- Berna-Escriche C., Vargas-Salgado C., Alfonso-Solar D., Escriva-Castells A. (2022) Hydrogen production from surplus electricity generated by an autonomous renewable system: scenario 2040 on grand canary island, Spain, Sustainability 14, 11884. https://doi.org/10.3390/su141911884. [CrossRef] [Google Scholar]
- María Villarreal Vives A., Wang R., Roy S., Smallbone A. (2023) Techno-economic analysis of large-scale green hydrogen production and storage, Appl. Energy 346, 121333. https://doi.org/10.1016/j.apenergy.2023.121333. [CrossRef] [Google Scholar]
- Marocco P., Ferrero D., Martelli E., Santarelli M., Lanzini A. (2021) An MILP approach for the optimal design of renewable battery-hydrogen energy systems for off-grid insular communities, Energy Convers. Manag. 245, 114564. https://doi.org/10.1016/J.ENCONMAN.2021.114564. [CrossRef] [Google Scholar]
- Marocco P., Novo R., Lanzini A., Mattiazzo G., Santarelli M. (2023) Towards 100% renewable energy systems: the role of hydrogen and batteries, J. Energy Storage 57, 106306. https://doi.org/10.1016/J.EST.2022.106306. [CrossRef] [Google Scholar]
- Massaro M.C., Biga R., Kolisnichenko A., Marocco P., Monteverde A.H.A., Santarelli M. (2023) Potential and technical challenges of on-board hydrogen storage technologies coupled with fuel cell systems for aircraft electrification, J. Power Sources 555, 232397. https://doi.org/10.1016/j.jpowsour.2022.232397. [CrossRef] [Google Scholar]
- Reksten A.H., Thomassen M.S., Møller-Holst S., Sundseth K. (2022) Projecting the future cost of PEM and alkaline water electrolysers; a CAPEX model including electrolyser plant size and technology development, Int. J. Hydrogen Energy 47, 38106–38113. https://doi.org/10.1016/j.ijhydene.2022.08.306. [CrossRef] [Google Scholar]
- Burton N.A., Padilla R.V., Rose A., Habibullah H. (2021) Increasing the efficiency of hydrogen production from solar powered water electrolysis, Renew. Sustain. Energy Rev. 135, 110255. https://doi.org/10.1016/j.rser.2020.110255. [CrossRef] [Google Scholar]
- Hurtubia B., Sauma E. (2021) Economic and environmental analysis of hydrogen production when complementing renewable energy generation with grid electricity, Appl. Energy 304, 117739. https://doi.org/10.1016/j.apenergy.2021.117739. [CrossRef] [Google Scholar]
- Locatelli G., Boarin S., Fiordaliso A., Ricotti M.E. (2018) Load following of Small Modular Reactors (SMR) by cogeneration of hydrogen: a techno-economic analysis, Energy 148, 494–505. https://doi.org/10.1016/j.energy.2018.01.041. [CrossRef] [Google Scholar]
- Bhandari R., Shah R.R. (2021) Hydrogen as energy carrier: techno-economic assessment of decentralized hydrogen production in Germany, Renew. Energy 177, 915–931. https://doi.org/10.1016/j.renene.2021.05.149. [CrossRef] [Google Scholar]
- Correa G., Marocco P., Munoz P., Falagüerra T., Ferrero D., Santarelli M. (2022) Pressurized PEM water electrolysis: dynamic modelling focusing on the cathode side, Int. J. Hydrogen Energy 47, 4315–4327. https://doi.org/10.1016/j.ijhydene.2021.11.097. [CrossRef] [Google Scholar]
- Genovese M., Cigolotti V., Jannelli E., Fragiacomo P. (2023) Current standards and configurations for the permitting and operation of hydrogen refueling stations, Int. J. Hydrogen Energy 48, 19357–19371. https://doi.org/10.1016/j.ijhydene.2023.01.324. [CrossRef] [Google Scholar]
- Gül M., Akyüz E. (2023) Techno-economic viability and future price projections of photovoltaic-powered green hydrogen production in strategic regions of Turkey, J. Clean. Prod. 430, 139627. https://doi.org/10.1016/j.jclepro.2023.139627. [CrossRef] [Google Scholar]
- Hassan Q., Abdulateef A.M., Hafedh S.A., Al-samari A., Abdulateef J., Sameen A.Z., Salman H.M., Al-Jiboory A.K., Wieteska S., Jaszczur M. (2023) Renewable energy-to-green hydrogen: a review of main resources routes, processes and evaluation, Int. J. Hydrogen Energy 48, 17383–17408. https://doi.org/10.1016/j.ijhydene.2023.01.175. [CrossRef] [Google Scholar]
- Hofrichter A., Rank D., Heberl M., Sterner M. (2023) Determination of the optimal power ratio between electrolysis and renewable energy to investigate the effects on the hydrogen production costs, Int. J. Hydrogen Energy 48, 1651–1663. https://doi.org/10.1016/J.IJHYDENE.2022.09.263. [CrossRef] [Google Scholar]
- Zainal B.S., Ker P.J., Mohamed H., Ong H.C., Fattah I.M.R., Rahman S.M.A., Nghiem L.D., Mahlia T.M.I. (2023) Recent advancement and assessment of green hydrogen production technologies, Renew. Sustain. Energy Rev. 189, 113941. https://doi.org/10.1016/j.rser.2023.113941. [Google Scholar]
- Ueckerdt F., Bauer C., Dirnaichner A., Everall J., Sacchi R., Luderer G. (2021) Potential and risks of hydrogen-based e-fuels in climate change mitigation, Nat. Clim. Change 11, 384–393. https://doi.org/10.1038/s41558-021-01032-7. [CrossRef] [Google Scholar]
- Sollai S., Porcu A., Tola V., Ferrara F., Pettinau A. (2023) Renewable methanol production from green hydrogen and captured CO2: a techno-economic assessment, J. CO2 Util. 68, 102345. https://doi.org/10.1016/j.jcou.2022.102345. [Google Scholar]
- Roben F.T.C., Schone N., Bau U., Reuter M.A., Dahmen M., Bardow A. (2021) Decarbonizing copper production by power-to-hydrogen: a techno-economic analysis, J. Clean. Prod. 306, 127191. https://doi.org/10.1016/j.jclepro.2021.127191. [CrossRef] [Google Scholar]
- Rechberger K., Spanlang A., Sasiain Conde A., Wolfmeir H., Harris C. (2020) Green hydrogen-based direct reduction for low-carbon steelmaking, Steel Res. Int. 91, 2000110. https://doi.org/10.1002/srin.202000110. [CrossRef] [Google Scholar]
- Ma S., Liu Z., Zheng J.N., Wu Z., Li N., Guan X., Han J.N., Yang M., Song Y. (2024) Natural gas hydrate decomposition characteristics at the exploitation anaphase via sediment warming, Energy Fuels 38, 15, 14334–14342. https://doi.org/10.1021/acs.energyfuels.4c02709. [CrossRef] [Google Scholar]
All Figures
|
Fig. 1 Control structure of water electrolysis hydrogen production device. |
| In the text | |
|
Fig. 2 Electrolytic cell equivalent circuit. |
| In the text | |
|
Fig. 3 Impedance Bode diagram under different short circuit ratio. |
| In the text | |
|
Fig. 4 Control flow chart. |
| In the text | |
|
Fig. 5 Adaptive resonance control. |
| In the text | |
|
Fig. 6 Characteristic curve of electric hydrogen production. |
| In the text | |
|
Fig. 7 Multiple electrolyzer hydrogen production power allocation process. |
| In the text | |
|
Fig. 8 Experimental platform for connecting inductive weak grids to hydrogen production systems from renewable energy sources. |
| In the text | |
|
Fig. 9 Impedance is 0.25, three-phase voltage drop in high power operation. |
| In the text | |
|
Fig. 10 Impedance is 0.55, two-phase voltage drop in high power operation. |
| In the text | |
|
Fig. 11 Impedance is 0.25, high power operation and three-phase voltage rise. |
| In the text | |
|
Fig. 12 Impedance is 0.25, low power operation and three-phase voltage drop. |
| In the text | |
|
Fig. 13 Impedance is 0.25, low power operation and three-phase voltage rise. |
| In the text | |
|
Fig. 14 Impedance is 0.55, low power operation and three-phase voltage rise. |
| In the text | |
|
Fig. 15 Multi-energy electric hydrogen production system. |
| In the text | |
|
Fig. 16 The impedance change of W1 corresponds to the grid frequency. |
| In the text | |
|
Fig. 17 The impedance change of W2 corresponds to the grid frequency. |
| In the text | |
|
Fig. 18 The impedance change of W3 corresponds to the grid frequency. |
| In the text | |
|
Fig. 19 The impedance change of W4 corresponds to the grid frequency. |
| In the text | |
Current usage metrics show cumulative count of Article Views (full-text article views including HTML views, PDF and ePub downloads, according to the available data) and Abstracts Views on Vision4Press platform.
Data correspond to usage on the plateform after 2015. The current usage metrics is available 48-96 hours after online publication and is updated daily on week days.
Initial download of the metrics may take a while.