")
")
| Issue |
Sci. Tech. Energ. Transition
Volume 80, 2025
Decarbonizing Energy Systems: Smart Grid and Renewable Technologies
|
|
|---|---|---|
| Article Number | 12 | |
| Number of page(s) | 11 | |
| DOI | https://doi.org/10.2516/stet/2024102 | |
| Published online | 20 January 2025 | |
Regular Article
Study on the whole lifecycle energy consumption scenarios of expressway
1
Gezhouba Group Transportation Investment Co., Ltd., Qiaokou Road, Qiaokou District, Wuhan 430000, Hubei Province, China
2
Transport Planning and Research Institute, Ministry of Transport, Shuguang Xili, Chaoyang District, Beijing 100028, China
3
Laboratory of Transport Pollution Control and Monitoring Technology, Shuguang Xili, Chaoyang District, Beijing 100028, China
4
Beijing Jiaotong University, No. 3 Shangyuancun, Haidian District, Beijing 100044, China
* Corresponding author: This email address is being protected from spambots. You need JavaScript enabled to view it.
Received:
10
August
2023
Accepted:
13
November
2024
Abstract
This paper constructs a set of energy consumption scenarios for typical expressway construction, operation and maintenance phases, and analyses the energy demand under each scenario. Firstly, a comprehensive lifecycle energy consumption framework for expressway is established, detailing the energy consumption scenarios during construction, operation, and maintenance phases. Secondly, based on literature review and scenario assumptions, the study examines the energy consumption levels under different scenarios and analyses the proportion of energy consumption in each scenario. The results show that the ratio of energy consumption during the construction, operation and maintenance phases of expressway is about 5:10:3. The energy consumption during the construction phase is the highest for the construction of expressway trunk lines, accounting for about 80.6% of the total energy consumption. During the operation phase, fuelling and refuelling stations consume the most energy, accounting for about 71.4%. The energy consumption of expressway trunk lines is the highest during maintenance phase, which accounting for about 70%. This analysis facilitates a deeper understanding of the characteristics of the integration between transportation and energy networks, and assists the transportation sector in achieving carbon peak and carbon neutrality goals in a scientifically sound manner.
These authors contributed equally to this work and should be considered co-first authors.
© The Author(s), published by EDP Sciences, 2025
 This is an Open Access article distributed under the terms of the Creative Commons Attribution License (https://creativecommons.org/licenses/by/4.0), which permits unrestricted use, distribution, and reproduction in any medium, provided the original work is properly cited.
1 Introduction
As an essential sector for pollution reduction and carbon emission reduction in China, the field of transportation has garnered increasing attention for its energy-saving and carbon-reduction initiatives. In recent years, with the profound integration of transportation and energy development, the clean energy supply system for expressway has become a significant measure for energy conservation and carbon reduction in the road sector. In 2023, the sales volume of new energy vehicles in China reached 9.5 million units, accounting for over 60% of the global share. A cumulative total of 20,000 charging piles have been constructed in the service areas of expressways. With the rapid development of new energy vehicles, the energy consumption performance during the operation of expressway has attracted widespread concern. The level of energy consumption on expressways has a profound impact on the construction of self-sufficient energy systems for expressway infrastructure. This study systematically categorizes and analyses the energy consumption scenarios throughout the entire lifecycle of expressway, providing a detailed breakdown of the distribution and proportion of energy use during the construction, operation, and maintenance phases. This analysis facilitates a deeper understanding of the characteristics of the integration between transportation and energy networks, and assists the transportation sector in achieving carbon peak and carbon neutrality goals in a scientifically sound manner.
The energy footprint of expressway is a multifaceted issue that encompasses their construction, operation, and maintenance phases. Understanding the energy dynamics at each stage is crucial for sustainable infrastructure planning and carbon emission reduction strategies. Various researchers have investigated energy consumption in transportation. Song et al. (2014) examined shifts in the transportation sector in Shanghai from 2000 to 2010 and their implications for transportation energy consumption and efficiency. Jia et al. (2010) developed a calculation model based on vehicle operation to analyse China’s transportation energy consumption levels. Different methodologies have been employed to study energy consumption in highway systems, focusing on diverse aspects of highway construction, operation, and maintenance. Artificial Neural Networks (ANN) has been developed to predict highways energy consumption (Cansiz et al., 2022). Life Cycle Assessment method has been adopted to quantitatively analyse the energy consumption of bridge-based expressways in South China (Lv et al., 2018). The Analytic Hierarchy Process combined with fuzzy synthetic evaluation was applied to establish and calculate an energy consumption index system for highway transportation infrastructure, providing a rapid evaluation method (Qi et al., 2020). A dynamic model of road transportation energy demand system in Beijing was built to analyze the relationship between urban road transportation energy demand and economy and passenger transportation (Zhang et al., 2019). Principal Component Analysis was utilized to identify and analyze the main influencing factors of energy consumption in highway service areas, elucidating the relationship between energy consumption and factors such as building scale and traffic flow (Shi-Yong et al., 2021). Additionally, real-world data collection and analysis were conducted to study the energy consumption patterns of electric vehicles on highways, examining the impact of driving conditions and operational scenarios (Liang et al., 2023). Several studies have revealed energy consumption variations during different phases of expressway development. The energy consumption during the construction phase is primarily attributed to the building of trunk lines and tunnels. Lu (2011) developed a statistical model highlighting the energy-intensive nature of highway construction. Zou and Cheng (2019) provided empirical data on energy consumption during the construction of a specific highway segment, emphasizing the substantial energy draw from tunnel and trunk line projects. Mao et al. (2023) conducted a quantitative evaluation on the energy consumption and carbon emissions during the asphalt pavement regeneration process. During the operation phase, the energy landscape shifts towards the use of infrastructure and the vehicles themselves. Tang (2013) and Li (2016) explored the energy consumption of expressways during operation, including the energy required for traffic management systems, lighting, and other operational necessities. Guo et al. (2022) have proposed a new method for measuring energy consumption during the operational phase of highways, specifically within service areas. Their findings indicate significant energy consumption, primarily from electricity, which suggests areas for targeted energy efficiency improvements. The maintenance phase, often understated, is nonetheless substantial in terms of energy use. Pan (2011) and Shen (2017) conducted research on the energy consumption and carbon emissions associated with highway maintenance, revealing that routine upkeep and repairs contribute significantly to the overall lifecycle energy consumption.
This study expands the existing body of knowledge by constructing a set of energy consumption scenarios for a typical expressway, offering a thorough breakdown of energy use during construction, operation, and maintenance, while considering the impact of new energy vehicles on expressway energy consumption, thereby providing foundational support for research on expressway clean energy systems.
2 Methodology
2.1 Lifecycle-based energy consumption scenarios of expressway
According to the ISO 14044:2006 standard, Life Cycle Assessment (LCA) is a systematic framework employed to evaluate various aspects associated with product development and its potential impacts throughout the entire life cycle – from raw material acquisition and processing to manufacturing, use, and ultimately disposal (i.e., cradle to grave) (ISO 2006). This paper utilizes a life cycle assessment approach to analyze energy consumption scenarios related to the entire life cycle of expressway. Within this framework, the life cycle of an expressway can be segmented into three distinct phases: construction, operation, and maintenance.
In terms of energy consumption characteristics of expressway, the construction phase is categorized into four primary scenarios: expressway trunk lines, tunnels, service areas, and toll stations. The operation phase consists of six main scenarios: tunnels, service areas, toll stations, expressway trunk lines, operation and management centers, and fuelling (LNG) stations/charging (battery swap) stations. Finally, the maintenance phase encompasses four scenarios: expressway trunk lines, tunnels, service areas, and toll stations.
2.1.1 Energy consumption scenarios during the construction phase
To conduct a comprehensive analysis of the energy consumption characteristics during the construction phase of expressway, this study establishes a set of energy consumption scenarios specific to this phase. The analysis takes into account the unique construction characteristics associated with various expressway contexts and delineates the energy consumption projects within each scenario. The specific classification of these projects is presented in Table 1.
Energy consumption scenarios during expressway construction phase.
2.1.2 Energy consumption scenarios during the operation phase
The operational phase of expressway constitutes the primary stage of energy consumption, primarily deriving from the energy consumption of infrastructure facilities and transportation equipment. This study establishes a scenario set for energy consumption during the operational phase of expressway, outlining the principal energy-consuming equipment within expressway infrastructure. The energy consumption of refuelling/LNG stations and charging (battery swap) stations reflects that of transportation equipment. Detailed specifics are provided in Table 2.
Energy consumption scenarios during expressway operation phase.
2.1.3 Energy consumption scenarios during the maintenance phase
The maintenance phase of expressway encompasses road maintenance as well as the maintenance of associated facilities. This study constructs a scenario set for energy consumption during the maintenance phase of expressway, providing an overview of the primary energy consumption projects under different scenarios. Detailed information is presented in Table 3.
Energy consumption scenarios during expressway maintenance phase.
2.2 Expressway energy consumption analysis model
Based on the constructed scenario set of expressway energy consumption, and utilizing literature analysis and scenario assumptions, this study investigates energy consumption levels under different scenarios and analyzes the proportion of energy consumption in each scenario. A typical example (four lanes in both directions, 15% bridge-tunnel ratio, 50 km service area spacing, 12.5 km toll station spacing, 100 km management center spacing, 10,000 pcu/d traffic volume, 20% of which are new energy vehicles, 15 years operation phase) is proposed in this paper for calculating energy consumption levels.
3 Analysis of energy consumption scenarios for expressway
3.1 Analysis of energy consumption scenarios during expressway construction phase
The levels of energy consumption during the expressway construction phase are detailed in Table 4, while the corresponding consumption proportions are illustrated in Figure 1.
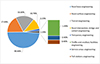 |
Fig. 1 Proportion of energy consumption during expressway construction phase. |
Energy consumption scenarios during expressway construction phase.
3.1.1 Expressway trunk lines
The construction of expressway trunk lines mainly involves six major types of projects, which are road base engineering, road surface engineering, bridge and culvert engineering, ancillary facilities engineering, road intersection engineering and temporary engineering. The energy consumption of expressway trunk line projects accounts for about 80.6% of the total energy consumption during the construction phase (Lu, 2011), of which about 95% is consumed by mechanical equipment and mixing stations, and about 5% is consumed by on-site offices and life. For asphalt concrete pavement construction, energy consumption in the mixing stage accounts for about 90% of the total energy consumption during the construction phase, paving and compaction accounts for about 8%, and material transportation accounts for about 2%. For cement concrete pavement construction, the proportion of energy consumption in the mixing stage is higher, approximately 94%.
3.1.2 Tunnel
The tunnel engineering mainly includes tunnel body engineering, tunnel door engineering, auxiliary pit and facility installation works. The main energy consumption machinery for tunnel body engineering includes air compressor, rock drill, loader, dump truck, welding machine, bulldozer, etc. The main energy consumption machinery of the tunnel door engineering includes crane, welding machine, dump truck, etc. Auxiliary pit construction mainly uses winch, air compressor and ventilator. Facility installation works mainly use cranes, cargo trucks, winches, welding machines, forklifts, etc. According to the mainstream market equipment performance and engineering shift scheme, the energy consumption of tunnel engineering accounts for about 18.6% of the total energy consumption of the construction phase (Zou and Cheng, 2019).
3.1.3 Service area
The construction of service area includes: (1) Vehicle service facilities: parking lot, gas station, charging pile, vehicle access, repair workshop, etc. (2) Personnel service facilities: restaurants, toilets, stores, hotels, medical stations, pedestrian passages, etc. (3) Management facilities: monitoring rooms, communication equipment rooms, management office rooms, staff dormitories, etc. (4) Auxiliary facilities: electrical rooms, refuse collection points, sewage treatment facilities, etc. (5) Emergency rescue places, etc. According to statistics, the energy consumption for the construction of service areas accounts for about 0.4% of the total energy consumption during the construction phase. The overall energy consumption of the construction of the five types of facilities is comparable, accounting for about 20% respectively (Li, 2013).
3.1.4 Toll station
The construction of toll station mainly includes: (1) Toll area: toll island, toll booth, toll shed, etc. (2) Toll plaza: road widening project before and after the toll station. (3) Management building: toll staff offices, dormitories, monitoring rooms, etc. (4) Auxiliary facilities: including garage, kitchen, water, electricity and gas supply facilities, etc. According to statistics, the energy consumption of toll station construction accounts for about 0.4% of the total energy consumption during the construction phase. Among the four types of facilities, the energy consumption of the construction of ancillary facilities is higher, accounting for about 40% of the total energy consumption of the construction of toll stations, while the other three types of facilities each account for about 20% (Zou, 2015).
3.2 Analysis of energy consumption scenarios during expressway operation phase
The levels of energy consumption during the expressway operation phase are detailed in Table 5, while the corresponding consumption proportions are illustrated in Figure 2.
 |
Fig. 2 Proportion of energy consumption during expressway operation phase. |
Energy consumption scenarios during expressway operation phase.
3.2.1 Tunnel
In order to ensure the safety of traffic during expressway operation, tunnels need to be equipped with lighting, ventilation systems and other equipment, which are the main energy consumption facilities in the tunnel. Due to the complex traffic situation in the tunnel, the tunnel is equipped with a large number of monitoring equipment in and around the tunnel, mainly including: traffic flow video monitoring equipment, lighting brightness, light monitoring equipment, air quality monitoring system, wind speed/direction monitoring system, fire monitoring, alarm system, and its supporting data transmission and storage equipment. In addition, some tunnels will be equipped with safety information display equipment and emergency backup power system (UPS). According to statistics, the average energy consumption intensity of tunnels is about 4.52 tce/km · a, accounting for about 5.8% of the total energy consumption during the operation phase (Lu, 2011), which is the highest energy consumption infrastructure during the operation phase.
3.2.2 Service area
Service areas involve a variety of energy consumption equipment, and the energy consumption scenarios are complex, mainly including indoor and outdoor lighting, cooling and heating equipment, catering and entertainment living service equipment, vehicle service equipment, audio and video monitoring equipment, and office facilities and equipment (Lu, 2011). According to statistics, the average energy consumption intensity of service areas is about 3.12 tce/km · a (Tang, 2013), which accounts for about 4% of the total energy consumption during the operation phase.
3.2.3 Toll station
The energy consumption facilities of expressway toll stations mainly include toll collection facilities, monitoring facilities, lighting fixtures, and office facilities. At present, the main toll collection method of China’s expressways is the fully automatic electronic toll collection method with the help of ETC (Electronic Toll Collection) and the semi-automatic method with manual toll collection and computer management. Toll collection facilities mainly include electric railing, ETC equipment, vehicle detector, lane control computer and its communication equipment, etc. Monitoring facilities mainly include toll booth cameras, lane cameras and their data storage and transmission equipment, etc. Lighting fixtures mainly include lighting fixtures around the toll station and special lamps and lanterns used to indicate toll station information, etc. Office facilities mainly include computers and air conditioners. According to statistics, the average energy consumption intensity of toll stations is about 3.12 tons of standard coal/km · years (Li, 2021), which accounts for about 4% of the total energy consumption during the operation phase of expressway.
3.2.4 Expressway trunk lines
Energy consumption equipment on expressway trunk lines mainly includes traffic signal equipment, information monitoring equipment and communication equipment. Due to the long mileage of expressway trunk lines, the equipment is generally set only in key sections or set in the form of equal spacing, and the total energy consumption is relatively small. Expressway trunk line energy equipment mainly includes bridges, ramps, curves and other key locations to ensure the safety of vehicles and set up special signals, display real-time road information such as variable message boards and other traffic signal equipment, as well as set up in key sections of traffic and meteorological information monitoring and collection equipment, information transmission and communication equipment set up at equal intervals along the expressway. According to statistics, the average energy consumption intensity of expressway trunk lines is about 1.87 tce/km · a (Lu, 2011), which accounts for about 2.4% of the total energy consumption during the operation phase.
3.2.5 Operation and management center
The energy consumption of operation and management center mainly includes office energy and living energy. Office energy refers to the energy used by management personnel to ensure the normal operation of the expressway management, command and control work, involving information management equipment, communication equipment, traffic engineering facilities along the route and other energy consumption equipment. Living energy mainly refers to the energy used to meet the daily needs of staff, involving lighting, kitchen and bathroom and air conditionings. According to statistics, the average energy consumption intensity of the operation and management center is about 2.96 tce/km · a (Li, 2021), which accounts for about 3.8% of the total energy consumption during the operation phase.
3.2.6 Fueling (LNG) stations/charging (battery swap) stations
The energy consumption equipment of fuelling stations mainly includes fuel dispensers, transformers, distribution cabinets, protection equipment, and sewage treatment equipment. At present, China’s electric vehicle sales have ranked first in the world for eight consecutive years. It is expected that the charging and switching facilities along the expressway will become important energy consumption equipment of the expressway in the future. The energy consumption equipment of expressway charging (battery swap) stations mainly includes charging modules, relays, monitoring and measuring equipment, charging guns, communication modules, battery exchange equipment, static charging equipment, etc. According to statistics, the energy used for vehicles during the operation phase accounts for about 80%, and the energy used for infrastructures accounts for about 20% (Liang, 2020).
3.3 Analysis of energy consumption scenarios during expressway maintenance phase
The levels of energy consumption during the expressway maintenance phase are detailed in Table 6, while the corresponding consumption proportions are illustrated in Figure 3.
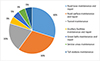 |
Fig. 3 Proportion of energy consumption during expressway maintenance phase. |
Energy consumption scenarios during expressway maintenance phase.
3.3.1 Expressway trunk lines
The maintenance of expressway trunk lines mainly involves the maintenance of road base, road surface, ancillary facilities and green belts. Road base maintenance includes road shoulder maintenance, road slope maintenance, etc. Road surface maintenance includes daily maintenance, road diseases maintenance, etc. Maintenance of ancillary facilities includes facility scrubbing, replacement, signage maintenance, etc. Greening maintenance includes vegetation watering, pruning, fertilization, replanting, etc. According to statistics, the energy consumption of expressway trunk lines maintenance accounts for about 70% of the total energy consumption during the maintenance phase, of which about 30% is used for road base and road surface maintenance, and about 5% is used for ancillary facilities and greening maintenance (Lu, 2011).
3.3.2 Tunnel
Tunnel maintenance is specifically divided into major maintenance and slight repair. Major maintenance is mainly daily inspection, tunnel cleaning, shaft maintenance, etc. Slight repair is mainly for the frequent repair of minor damage in the tunnel. Tunnel maintenance energy consumption accounts for about 20% of the total energy consumption during the maintenance phase (Pan, 2011).
3.3.3 Service area
Service area maintenance refers to the maintenance of the facilities and equipment, mainly including the maintenance of vehicle service facilities, personnel service facilities, management facilities, ancillary facilities and emergency facilities. The energy consumption of service area maintenance accounts for about 5% of the maintenance phase (Pan, 2011), of which the five kinds of facilities above account for 1% respectively (Shen, 2017).
3.3.4 Toll station
Toll station maintenance mainly includes the maintenance of toll area, toll plaza, management building and ancillary facilities. The energy consumption of toll station maintenance accounts for about 5% of the maintenance phase, of which the ancillary facilities accounts for about 2% (Díaz et al., 2017).
4 Conclusion
To delve into the energy consumption characteristics of expressway under various scenarios, a comprehensive lifecycle energy scenario set for expressway has been established. This paper, through literature analysis and hypothetical scenario studies, concludes as follows:
-
The proportion of energy consumption during the construction, operation and maintenance phase of the expressway is about 5:10:3. The comprehensive analysis of energy consumption throughout the entire lifecycle is graphically represented in Figure 4.
-
During the construction of expressway, particular attention should be given to energy conservation in the trunk lines construction, accounting for about 80.6% of the total energy consumption during the construction phase. Measures such as reducing fossil fuel consumption, improving energy efficiency and utilizing clean energy sources should be adopted to decrease energy consumption and greenhouse gas emissions during this phase.
-
During the operational phase of expressway, the primary energy consumption is attributed to fuelling and refuelling stations and charging (battery swap) stations. It is suggested that the integration of photovoltaic-charging-electricity systems be promoted through design and construction to increase the utilization of green energy and reduce the energy consumption of expressway.
-
During the maintenance phase, the energy consumption of expressway trunk lines is the highest, accounting for about 70% of the maintenance phase. It is recommended that during the maintenance phase, energy consumption should be reduced by employing measures such as the use of recycled asphalt materials and the adoption of clean energy machinery.
 |
Fig. 4 Energy consumption analysis of expressway life cycle scenarios. |
References
- Cansiz Ö.F., Üneş F., Erginer İ., Taşar B. (2022) Modeling of highways energy consumption with artificial intelligence and regression methods, Int. J. Environ. Sci. Technol. 19, 9741–9756. [CrossRef] [Google Scholar]
- Díaz S., Carta J.A., Matías J.M. (2017) Comparison of several measure-correlate-predict models using support vector regression techniques to estimate wind power densities. A case study, Energy Conv.Manag. 140, 334–354. [CrossRef] [Google Scholar]
- Guo Q., Liang H., Liao H., Zhang L., Ni D. (2022) Statistical analysis and Research on energy consumption in highway service area, in: 2022 7th International Conference on Intelligent Computing and Signal Processing (ICSP), Xi’an, China, 15–17 April, IEEE, pp. 210–214. [Google Scholar]
- Jia S., Mao B., Liu S., Sun Q. (2010) Calculation and analysis of transportation energy consumption level in China, J. Transp. Syst. Eng. Inf. Technol. 10, 22–27. [Google Scholar]
- Li D.Q. (2016) Research on the energy consumption analytical method of expressway in operation period, South China University of Technology, Guangzhou. [Google Scholar]
- Li L.B. (2013) Research on the energy consumption calculation method of expressway in construction period, South China University of Technology, Guangzhou. [Google Scholar]
- Liang M. (2020) Environmental impact and life cycle cost analysis of new energy vehicles and traditional fuel vehicles, China University of Petroleum, Beijing. [Google Scholar]
- Liang Y., Liu Y., Yu H., Li J., Ma K., An X. (2023) Analysis of factors influencing energy consumption in electric passenger vehicles based on real driving data, in: 2023 7th International Conference on Power and Energy Engineering (ICPEE), Chengdu, China, 22–24 December , IEEE, pp. 235–238. [Google Scholar]
- Lu H.T. (2011) Statistical model of highway life-cycle energy consumption, Changsha University of Science and Technology, Changsha. [Google Scholar]
- Lv T., Gao S., Hong W., Huang S., Liu X., Zhao H. (2018) Application of LCA in expressway energy consumption analysis in South China, IOP Conf. Ser. Earth Environ. Sci. 199, 032038. [CrossRef] [Google Scholar]
- Mao J., Zhu Y., Chen Q., Yu H. (2023) Energy consumption and carbon emission analysis of typical regeneration methods for asphalt pavements, Buildings 13, 6, 1569. [CrossRef] [Google Scholar]
- Pan M.P. (2011) The methodology research and application on energy consumption and carbon emissions of highway based on the life cycle assessment, South China University of Technology, Guangzhou. [Google Scholar]
- Qi Z., Zheng T., Liu N., Zhong H. (2020) Study on energy consumption index system and calculation method of highway transportation infrastructure in Qinghai Province, IOP Conf. Ser. Earth Environ. Sci. 440, 032003. [CrossRef] [Google Scholar]
- Shen Y.Q. (2017) Evaluation model and method for energy consumption and emissions of freeway reconstructed project, Hefei University of Technology, Hefei. [Google Scholar]
- Shi-Yong Z., Xian R., Li-Chao J., Jun-lin H. (2021) Analysis of energy consumption level and influencing factors of highway service area, IOP Conf. Ser.: Earth Environ. Sci. 825, 012005. [CrossRef] [Google Scholar]
- Song M., Wu N., Wu K. (2014) Energy consumption and energy efficiency of the transportation sector in Shanghai, Sustainability 6, 702–717. [CrossRef] [Google Scholar]
- Tang K. (2013) Energy consumption analysis and calculation method study of expressway operation period, Chang’an University, Xi’an. [Google Scholar]
- Zhang L., Liu L., Wang M., Wang Y., Zhou Y. (2019) Forecast and analysis of road transportation energy demand under the background of system dynamics, IOP Conf. Ser.: Earth Environ. Sci. 252, 052043. [CrossRef] [Google Scholar]
- Zou B.J. (2015) Research on the energy consumption calculation model of expressway in construction period, South China University of Technology, Guangzhou. [Google Scholar]
- Zou Q., Cheng D.Q. (2019) Statistics of energy consumption in the period of Suzhou West segment of G312 highway construction, Shanghai Highways 4, 95–98. [Google Scholar]
All Tables
All Figures
|
Fig. 1 Proportion of energy consumption during expressway construction phase. |
| In the text | |
|
Fig. 2 Proportion of energy consumption during expressway operation phase. |
| In the text | |
|
Fig. 3 Proportion of energy consumption during expressway maintenance phase. |
| In the text | |
|
Fig. 4 Energy consumption analysis of expressway life cycle scenarios. |
| In the text | |
Current usage metrics show cumulative count of Article Views (full-text article views including HTML views, PDF and ePub downloads, according to the available data) and Abstracts Views on Vision4Press platform.
Data correspond to usage on the plateform after 2015. The current usage metrics is available 48-96 hours after online publication and is updated daily on week days.
Initial download of the metrics may take a while.