")
")
| Issue |
Sci. Tech. Energ. Transition
Volume 80, 2025
Decarbonizing Energy Systems: Smart Grid and Renewable Technologies
|
|
|---|---|---|
| Article Number | 21 | |
| Number of page(s) | 16 | |
| DOI | https://doi.org/10.2516/stet/2024092 | |
| Published online | 29 January 2025 | |
Regular Article
Power flow analysis and volt/var control strategy of the active distribution network based on data-driven method
State Grid Jiangsu Electric Power Research Institute, No.1 Paweier Road, Jiangning District, Nanjing 210036, China
* Corresponding author: This email address is being protected from spambots. You need JavaScript enabled to view it.
Received:
5
June
2024
Accepted:
15
October
2024
Abstract
The traditional Power Flow Calculation (PLF) method of the distribution network is affected by the accuracy of model parameters, the convergence of the solution method, and other factors. At the same time, the accuracy of the PLF of the distribution network will directly affect the optimization effect of the distribution network. In this paper, a data-driven power flow analysis and the volt/var optimization control strategy for the distribution network are proposed. Firstly, the CatBoost machine learning model for the distribution network power flow analysis is proposed, and the nonlinear mapping relationship between the distribution network state and power flow results is described from the data-driven perspective. Secondly, the influence of PhotoVoltaic (PV) power supply on the distribution network is analyzed, and the volt/var optimization model based on PV power supply is proposed. Then, the volt/var optimization strategy of the distribution network based on data-driven power flow analysis is proposed to ensure the safe and stable operation of the distribution network voltage and reduce the operating network loss of the distribution network without the need for network parameters and other information. Finally, the IEEE 33 node system is used to verify the effectiveness of the proposed strategy, the results of the example show that the data-driven PLF method can accurately perceive the voltage and loss of the distribution network. The proposed optimization strategy can stabilize the voltage of the distribution network in the range of 0.95–1.05, and the loss of the distribution network is reduced from 6.879 MWh to 3.369 MWh.
Key words: Power flow analysis / Volt/var optimization / Distribution network / Data-driven / Photovoltaic power supply
© The Author(s), published by EDP Sciences, 2025
 This is an Open Access article distributed under the terms of the Creative Commons Attribution License (https://creativecommons.org/licenses/by/4.0), which permits unrestricted use, distribution, and reproduction in any medium, provided the original work is properly cited.
1 Introduction
Energy is the basis for industrial production and the development of modern society and plays an important role in the process of human history. In recent years, the installed capacity of Distributed Generation (DG) represented by PhotoVoltaics (PV) in power systems has been increasing year by year [1, 2]. Under the background of the sustainable development of fossil energy consumption control, large-scale new energy grid connection, and wide flexible load access, and with the application of a high proportion of power electronics in the power system, the complexity of the power flow model is increasing and the uncertainty variables are increasing [3, 4]. As a result, the traditional Power Flow Calculation (PLF) and sensitivity analysis method based on a physical model is affected by the accuracy of the power grid model and parameters and the time-consuming iterative solution of implicit function nonlinear equation, which is difficult to fully meet the needs of current new power system for rapid PLF and analysis. Therefore, there is an urgent need for PLF and analysis methods with high precision and fast timeliness to realize rapid perception and online regulation of power flow state [5]. In addition, the large-scale access of DG to the power system has greatly reduced the dependence on traditional fossil energy and promoted the development of energy structures towards low-carbon and clean directions. However, large-scale distributed power grid connection will bring problems such as grid node voltage cross-border, power flow reversal, and network loss increase, which will affect the safe and stable operation of the power grid [6–8].
Many scholars have carried out a lot of research on the PLF method of power systems. Reference [9] analyzes the impact of phase-shifting transformers and line resistance on PLFs in power systems with different voltage levels. In reference [10], a Newton-Raphson-based power flow method for auto-fed railway power supply systems is proposed, with a modified power flow formula for multi-conductor systems. Literature [11] introduces a two-step power flow-solving algorithm that provides a reliable adjustment scheme when grid current calculations cannot be solved, or when calculation efficiency is low. Reference [12] proposes a PLF based on the C-type Gram-Charlier series expansion and cumulant (CGC-CM), which determines the distribution characteristics of bus voltages and branch transmission power. Given the significant impact of uncertainty and volatility in DG on distribution network operations, reference [13] suggests an improved three-point estimation method combined with maximum entropy theory (ITPEM&ME) to calculate the probabilistic harmonic power flow in distribution networks. To better simulate the effects of distributed wind farms on uncertain power flow distribution, reference [14] proposes a probabilistic interval PLF method that considers correlation. Due to the diverse operational modes of multi-voltage stage DC power grids, their power flow analysis becomes more complex. Literature [15] introduces a PLF method for multi-voltage stage DC power grids, considering different control modes. Reference [16] establishes a linear power flow model with minimal linearization error, expanding the variable space expression as a polynomial function and proposing a simplified power loss model. Wire temperature is a key state variable that should be considered in PLFs, as it improves accuracy and reveals potential thermal loads on transmission components. Reference [17] presents a time-history power flow calculation method (TPPFCTB) that accounts for the thermal behavior of transmission components and is used to calculate the temperature dynamics of overhead lines, power cables, and transformers under expected system operating conditions. In order to avoid the time-consuming influence of the iterative calculation method of power flow, Reference [18] constructed a linearized power flow model of constant impedance-current-power load (constant impedance Z, constant current I, constant power P loads, ZIP loads) based on AC distribution network by Taylor expansion of load point power flow. Reference [19] proposes a decomposition-coordination PF model with two layers of coordination. Moreover, incorporated with the Ridge Regression, an improved Locally Weighted Linear Regression (LWLR) approach is established in treating the adjustment of boundary variables. Reference [20] proposes a modified Linear Distflow model (LinDist) with line shunts, i.e., LinDistS and also further proposes its extensions considering the ZIP load, weakly-meshed topology, and unbalanced three-phase systems. A new state estimation methodology is proposed based on the AC Optimal Power Flow (ACOPF) model for distribution networks with a small number of real-time measurements [21]. Reference [22] deduced the linearized PLF method under the bipolar DC distribution network topology and further proposed a power flow optimization model based on the binary algorithm. Reference [23] proposed a forward regression model and an inverse regression model of power flow. To address the limitations of existing linear PLF methods for distribution networks, such as poor generalization and low accuracy, literature [24] proposes a linear PLF method that accounts for DG. Based on the characteristics of the distribution network, the non-linear terms in the basic power flow equations are linearized using Taylor series expansion techniques. Partial Least Squares (PLS) and Bayesian linear regression methods are used to solve data collinearity and avoid over-fitting. The linear regression of active and reactive power injection power of grid nodes with node voltage and phase is realized, and the linear regression calculation of power flow is realized. Aiming at the problem of measurement noise in data-driven power flow linearization research, Reference [25] added the Jacobian matrix guidance constraint and proposed a Linearly Constrained Quadratic Programming (LCQP) power flow regression model considering data noise, which improved the robustness of the linearized regression model to data noise. Literature [26] proposes a general fast power flow algorithm. First, the initial branch active power flow is obtained using the classical DC power flow algorithm. Then, the node voltage angle is calculated based on the established node-injected reactive power equation. Finally, the active power flow and active power losses are determined using the revised phase angle and node voltage.
In the above research, the solution speed of power flow analysis is effectively accelerated, but the power flow linearized regression model is essentially a high-dimensional hyperplane to characterize the power flow model of the power grid, which makes it difficult to meet the nonlinear characteristics of the power flow model of the power grid. There are problems of insufficient modeling and insufficient description of power flow differences under different operating conditions.
The volt/var optimization of the distribution network can effectively solve the problems of voltage over-limit and network loss increase caused by large-scale access of DG to the distribution network [27]. The volt/var control of the traditional distribution network is based on a capacitor bank and on-load voltage regulating transformer, but the capacitor bank and on-load voltage regulating transformer can not adapt to the rapid fluctuation of the distribution network caused by the uncertainty of new energy output [28]. In this regard, relevant scholars use Static Var Compensator (SVC) and Static Var Generator (SVG) to control the volt/var of the distribution network, but the installation cost of SVC and SVG is high, which reduces the operation economy of the distribution network [29]. In recent years, PV power has a certain reactive power support capacity, and the volt/var control of PV power has a fast response speed, and does not increase the investment cost of the distribution network equipment [30]. It has gradually become one of the important means of volt/var regulation in active distribution networks. The IEEE 1547.8 working group advocates the use of PV inverters to achieve reactive voltage control [31]. Appropriately increasing the capacity configuration of PV inverters can effectively improve the reactive power output capacity of PV inverters and reduce the investment cost of traditional reactive power compensation equipment. The performance of various reactive voltage regulation equipment is shown in Table 1. Reference [32] proposes two novel two-stage volt/var control schemes based on the Affinely Adjustable Robust Counterpart (AARC) methodology, to mitigate the over-voltage issues caused by the integration of PV panels into distribution systems. Reference [33] develops a two-stage volt/var control strategy coordinating the discrete controls of legacy grid devices and the operation of smart inverters in power distribution grids with high penetration of PV generation. A reactive power control approach for PV inverters is proposed to control the injection/absorption of reactive power to reduce the active power loss of the system while solving the overvoltage problem [34]. To maximize the benefits of inverter-based Volt-Var Control (VVC), literature [35] proposes a multi-objective hierarchical coordination VVC method for PV inverters based on droop control. This method simultaneously minimizes average bus voltage deviation and network losses by optimizing both the reactive power setpoints of centralized PV inverters and the droop control function for local controls. Literature [36] introduces a framework for peak load regulation and voltage and reactive power control (VVC) in active distribution systems, utilizing a three-level inverter and an online safe Deep Reinforcement Learning (DRL) approach. Literature [37] presents a two-stage coordinated control method for voltage regulation and congestion management in Active Distribution Networks (ADNs) that incorporate PV generators and Electric Vehicle Stations (EVS). Literature [38] proposes an energy-saving voltage optimization strategy (VVO/CVR) based on a two-stage, multi-mode, data-driven Volt/Var optimization method. This strategy aims to reduce overall energy consumption while mitigating rapid voltage violations within the distribution network. In reference [7], a control strategy is proposed to optimize reactive power and voltage in PV energy storage distribution networks, considering the constraint of Insulte-Gate Bipolar Transistor (IGBT) junction temperature. Finally, reference [39] proposes a two-layer voltage and reactive power control strategy with two-time scales for an integrated system comprising a centralized PV plant and the external power grid. At the same time, the active and reactive power optimization operation of the active distribution network with multiple microgrids has also carried out a lot of work [40]. The literature [41] introduces an Energy Hub System (EHS) as an appropriate framework for the demand to be supplied by Multi-Carrier Energy (MCE) such as electricity, natural gas, and thermal energy. Literature [41, 42] proposes a three-objective optimal performance for Smart Hybrid Energy Systems (SHES) with customer participation to optimally reshape the demand profile of the day-ahead energy market. A multi-objective function model of intelligent microgrid to minimize i) the operation cost, ii) the emission pollution, and iii) the deviation between the original demand curve and its desired level in the day-ahead time period was established in the literature [43].
Comparison of characteristics of different reactive power compensation equipment.
The IEEE 33-bus system parameters.
However, at the present stage, the voltage/var optimization model is based on the PLF based on the traditional physical model, and the effect of volt/var optimization is restricted by the accuracy of the PLF. Once the line parameters of the distribution network are inaccurate, it will affect the calculation accuracy of the power flow of the distribution network, and then affect the volt/var control of the distribution network, and even make the volt/var control of the distribution network fail. Therefore, it is necessary to consider the calculation accuracy of power flow in the distribution network while carrying out volt/var optimization, so as to further improve the accuracy of the volt/var optimization in the distribution network.
Inspired by the aforementioned issues, this paper proposes a data-driven distribution network power flow analysis and reactive voltage optimization strategy. Firstly, a data-driven power flow analysis model of the distribution network is proposed. The active load, reactive load, the active power output of new energy, and reactive power output of reactive power compensation equipment of the distribution network are taken as the input of the CatBoost model, and the network loss and node voltage of the distribution network are taken as the output of the CatBoost model. The CatBoost model is trained to describe the nonlinear mapping relationship between the state of the distribution network and the power flow result of the distribution network. Secondly, the influence mechanism of the distributed PV power access on the voltage of the distribution network is analyzed, and the volt/var optimization model of the distribution network based on the PV power supply is introduced. Then, based on the data-driven power flow analysis of the distribution network, the volt/var optimization strategy of the distribution network based on data-driven power flow analysis is proposed to realize that the reactive power and voltage control of the distribution network is not affected by factors such as line parameters of distribution network. Finally, the effectiveness of the proposed strategy is verified by the IEEE 33-bus typical case.
The remainder of this paper is organized as follows. In Section 2, the limitation of traditional PLF is analyzed, a data-driven PLF model for the distribution network is proposed, and the CatBoost machine learning algorithm is introduced. In Section 3, the influence of PV power supply on the voltage of the distribution network is analyzed, and the volt/var optimization model based on PV power supply is proposed. Meanwhile, the volt/var optimization model for the data-driven power flow analysis is proposed, and the particle swarm heuristic algorithm is used to solve the optimization model. In Section 4, the effectiveness of the proposed strategy is verified by the IEEE 33 node power distribution system. In Section 5, the conclusions are drawn from the study.
2 Power flow analysis of the distribution network based on the data-driven algorithm
2.1 Traditional power flow analysis
The power network is usually modeled based on physical information. Due to the complexity of the power flow of the power system, the power flow parameters are implicitly nonlinear functional relationships, so they cannot be simply defined as a simple mapping between known and unknown quantities. The traditional PLF method is based on Newton-Raphson, PQ decomposition, and other power flow algorithms to solve the physical information such as network topology, component parameters, and load level of a given power system through an iterative and convergent process. Set:![Mathematical equation: $$ {U}=[{U}_1,\dots {U}_m] $$](/articles/stet/full_html/2025/01/stet20240164/stet20240164-eq1.gif) (1)
(1)
![Mathematical equation: $$ {\theta }=[{\theta }_1,\dots {\theta }_m] $$](/articles/stet/full_html/2025/01/stet20240164/stet20240164-eq2.gif) (2)
(2)
![Mathematical equation: $$ {x}=[{U},{\theta }] $$](/articles/stet/full_html/2025/01/stet20240164/stet20240164-eq3.gif) (3)where
U
is the node voltage amplitude,
θ
is the node voltage phase angle.
(3)where
U
is the node voltage amplitude,
θ
is the node voltage phase angle.
For the traditional PLF of the physical model, the power equation of nodes is written through Kirchhoff’s theorem, where the power equation of the physical model in polar coordinate form is shown in equations (4) and (5)
 (4)
(4)
 (5)where i = 1, 2, …, n; P
i
and Q
i
are the active power and reactive power injection on bus i respectively; |U
i
| is the voltage value of bus i; |U
k
| is the voltage value of bus k; (G
ik
+B
ik
) is the (i, k) element in the admittance matrix (
Y
=
G
+j
B
), where j is the imaginary unit; θ
ik
is the phase angle difference between bus i and bus k.
(5)where i = 1, 2, …, n; P
i
and Q
i
are the active power and reactive power injection on bus i respectively; |U
i
| is the voltage value of bus i; |U
k
| is the voltage value of bus k; (G
ik
+B
ik
) is the (i, k) element in the admittance matrix (
Y
=
G
+j
B
), where j is the imaginary unit; θ
ik
is the phase angle difference between bus i and bus k.
Taking the Newton-Raphson method as an example, the active power unbalance equation can be written for each PQ node or each PU node. (6)
(6)
For each PQ node, the reactive power unbalance equation can also be written. (7)
(7)
According to formulas (6) and (7), the correction equation can be written as follows:![Mathematical equation: $$ \left[\begin{array}{c}\Delta {P}\\ \Delta {Q}\end{array}\right]=-\left[\begin{array}{cc}{H}& {N}\\ {K}& {L}\end{array}\right]\left[\begin{array}{c}\Delta \delta \\ {{U}}_{D2}^{-1}\Delta {U}\end{array}\right] $$](/articles/stet/full_html/2025/01/stet20240164/stet20240164-eq8.gif) (8)
(8)
![Mathematical equation: $$ \left\{\begin{array}{c}\Delta {P}=\left[\begin{array}{c}\Delta {P}_1\\ \Delta {P}_2\\ \vdots \\ \Delta {P}_{n-1}\end{array}\right];\Delta {Q}=\left[\begin{array}{c}\Delta {Q}_1\\ \Delta {Q}_2\\ \vdots \\ \Delta {Q}_{n-1}\end{array}\right];\Delta {\delta }=\left[\begin{array}{c}\Delta {\delta }_1\\ \Delta {\delta }_2\\ \vdots \\ \Delta {\delta }_{n-1}\end{array}\right]\\ \Delta {U}=\left[\begin{array}{c}\Delta {U}_1\\ \Delta {U}_2\\ \vdots \\ \Delta {U}_m\end{array}\right];\Delta {U}=\left[\begin{array}{cccc}\Delta {U}_1& & & \\ & \Delta {U}_2& & \\ & & \ddots & \\ & & & \Delta {U}_m\end{array}\right]\end{array}\right. $$](/articles/stet/full_html/2025/01/stet20240164/stet20240164-eq9.gif) (9)where
(9)where  .
.
By solving the partial derivatives of (6) and (7), the specific expression of the elements of the Jacobian matrix is obtained.
When i ≠ j
 (10)
(10)
When i = j
 (11)
(11)
The nonlinear implicit function equation of the power flow is solved by the iterative numerical method under the condition of clear grid topology and model parameters. The inaccuracy of model parameters, and the time-consuming and convergence of iterative solutions will affect the accuracy and rapidity of PLF, which cannot meet the development needs of the power grid under the large-scale access of new energy. At the same time, various types of energy are coupled and complementary, and unified planning makes each type of energy can be better used. In this case, the topology structure and operation mode of the power system have undergone a series of changes, and PLF is the basis for steady-state analysis and optimal operation of the power system. The traditional PLF method cannot fully meet the needs of the new power system due to factors such as the accuracy of the grid topology, the accuracy of parameters, and the time required for iterative solutions. More rapid, accurate, and flexible power flow analysis strategies are urgently needed.
2.2 Power flow analysis of distribution network based on data-driven method
With the continuous development of power system-related technologies, Supervisory Control, And Data Acquisition (SCA-DA) systems have been unable to fully meet the needs of power grid stability monitoring. The wide area measurement system based on synchronous Phasor Measurement Unit (PMU) has become a new effective technology for power grid stability monitoring. PMU has become an integral part of power dispatching automation systems in new power systems and has been widely used in power systems. The measured synchronization vector plays an important role in fault location, PLF, and control strategy simulation. Figure 1 shows the typical Wide Area Monitoring System (WAMS) architecture.
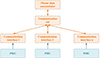 |
Fig. 1 The typical WAMS system architecture. |
In this regard, this paper proposes a data-driven power flow analysis method for distribution networks, as shown in Figure 2. Firstly, the real data of the distribution network operation are obtained, including the active and reactive loads of each node in the distribution network, the active power output of the distributed power supply in the distribution network, the reactive power output of reactive power compensation equipment in the distribution network, and the voltage and network loss of each node in the distribution network. Then, the active and reactive loads of each node, the active power output of the distributed power supply, and the reactive power output of the reactive power compensation equipment are taken as the input of the Catboost model, and the voltage and network loss of each node in the distribution network is taken as the output of the Catboost model, and the Catboost model is trained offline. Finally, the trained Catboost model can obtain the voltage and network loss of the distribution network according to the real-time state information of the distribution network.
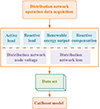 |
Fig. 2 The data-driven power flow analysis method for distribution networks. |
CatBoost is a Boosting ensemble learning model based on an improved GBDT algorithm proposed by scholar Liudmila. CatBoost also takes the addition model as the framework for multi-round iteration, builds multiple base learners, and uses a serial method to learn the residual of training samples to gradually improve the accuracy of base learners. CatBoost selects a fully symmetric binary decision tree as the model’s base learner. The asymmetric tree is a decision tree in which all nodes of each layer choose the same splitting condition, and the structure of the tree is always symmetric. The symmetric tree splits all nodes in each layer based on the feature with the greatest splitting benefit and grows continuously by building layer by layer until the number of layers of the tree reaches the depth threshold. During calculation, the traditional decision tree needs to traverse the whole tree to get the calculation result. However, due to the characteristics of the same level splitting condition of the completely symmetric binary decision tree, the leaf node can be quickly retrieved by constructing the binary index, thus significantly improving the calculation speed. The power flow analysis model structure of the distribution network based on CatBoost is shown in Figure 3.
 |
Fig. 3 The power flow analysis model structure of distribution network based on CatBoost. |
Compared with the traditional machine learning algorithm that uses a separate learner, Catboost integrated learning algorithm itself is not a single machine learning algorithm, but by establishing multiple weak learners, using the training set data to train the established weak learners, and adopting certain combination strategies to combine these weak learners. Thus, a strong learner with an ideal effect can be obtained to obtain more accurate prediction results. The specific integrated learning principle diagram is shown in Figure 4. Ensemble learning solves the overfitting problem when using a single model to some extent. Even if a weak learner makes a wrong prediction during the learning process, the other weak learners can correct the error. Therefore, ensemble learning usually has better accuracy and generalization ability.
 |
Fig. 4 The specific integrated learning principle diagram. |
Boosting algorithm is also one of the important members of ensemble learning. It is an inheritance algorithm of serial relationships. The training of each sub-learner by the Boosting algorithm has a strong dependence on the previous sub-learner. The second learner is optimized based on the previous learner, and this process is repeated continuously. The final sub-learner uses the corresponding combination strategy to obtain a strong learner. The specific schematic diagram is shown in Figure 5. The training of each sub-learner in the Boosting algorithm is optimized based on the previous sub-learner, and the new learner will pay more attention to the sample with higher error of the previous sub-learner. Through continuous iteration, a strong learner is obtained by using the combination strategy, which makes the Boosting algorithm have better performance.
 |
Fig. 5 The specific schematic diagram. |
For data sets with unknown data distribution, after dividing the training set and the test set, the data distribution is likely to be inconsistent. Let (x
train, y
train) be a training set sample, (x
test, y
test) be a test set sample, F
k
be the base learner constructed by the kth iteration, and L(y, F
k
(x)) be the loss function, then the gradient G
k
(x, y) of the loss function is shown in formula (12). (12)
(12)
Due to the inconsistent data distribution between the training set and the test set, the conditional distribution G k (x train, y train)|x train on the training set is also inconsistent with the conditional distribution G k (x test, y test)|x test on the test set, resulting in a gradient deviation. In each round of iterative training of the traditional GBDT algorithm, the loss function uses the same training set to calculate the gradient. Due to the addition model as the framework, the bias generated by the base learner in each round of training will continue to accumulate, which eventually leads to the problem of overfitting the model on the training set. To prevent the above prediction offset phenomenon, CatBoost proposes an ordered lifting algorithm. The algorithm first randomly disrupts the order of the samples in the training set, then calculates the gradient of the sample data one by one, uses other data that do not contain the current sample to train the base learner, and finally integrates the base learner based on different sample subset training as the final model. The orderly lifting algorithm of the algorithm is shown in Algorithm 1.
Algorithm Orderly lifting algorithm
Input: training sets  , the number of trees T
Shuffle( )
)
For i in range(1, n): Mi
For t in range(1, T):
For t in range(1, n):
For j in range(1, i − 1):
ΔM ← LearnModel((xj, Gj)) for j in range(i, i − 1)
Mi ← Mi + ΔM
Output: forecasting model Mn
3 Volt/Var optimization strategy for high proportion of PV access to distribution network based on data-driven power flow analysis
3.1 The influence of PV power access on the node voltage of distribution network
Most of the distribution network belongs to the single power supply radial network, and the voltage is gradually reduced along the transmission line voltage during stable operation. After integrating into the PV power supply, the power flow of the PV grid-connected point is very likely to have a countercurrent situation. In this case, the analysis of the power generated by the distributed PV has the most significant impact on the voltage of its grid-connected point. Due to the access of distributed PVs, the power flow on the distribution network line is reduced, and the impact is to raise the voltage amplitude. When the distributed PV output is small, the impact on the power flow is relatively small, which plays a supporting role in the node voltage of the distribution network. When the distributed PV output exceeds a certain range, it may cause the voltage of some load nodes to increase significantly or even exceed the allowable deviation range of the voltage.
3.1.1 Single PV grid-connected
When a single distributed PV is connected to the grid, some problems affecting the voltage quality of the distribution line are often encountered. For example, when the capacity of the grid is very high but the load of the user is very low, it will lead to the voltage limit of the distribution node. In another case, the capacity of the grid is very low but the load of the user is very high, which will also lead to the voltage limit of the distribution node. When the distributed PV is connected to the normal operation of the power grid, it is equivalent to introducing multiple power sources in the distribution network system, so that the original distribution network system becomes a multi-power system network. In the analysis and research of this multi-power system, the superposition method is often used for calculation, taking Figure 6 as an example for analysis.
 |
Fig. 6 Topology structure of radial distribution system. |
It is assumed that the number of load nodes on the line of the distribution system is N, and the power consumed on the nth node is calculated to be P
n + jQ
n
(n = 1, 2, 3, …, N). Setting U
0 as a fixed value, and the power from the beginning to the load side is defined as the positive direction, and the loss on the line is ignored. Assuming that there are m nodes on the whole distribution network line, the voltage drop ΔU
m
between the m and m − 1 nodes can be obtained as follows: (13)where, P is the active power of the node; Q is the reactive power of the node; r is the line resistance; x is the line reactance; r is the resistance per unit length; x is the unit reactance; l is the distance between two nodes.
Due to the active and reactive power on the load being greater than zero, the voltage drop ΔU
m
on the distribution line can be obtained from the above formula is also greater than zero. It can be seen that the farther the node is from the head end, the lower the node voltage will be. The voltage U
m
at the mth node on the distribution line can be expressed as (14)
(14)
(a) Suppose that the distributed PV access point is p point, and the active power output of the connected PV power supply is expressed as P v , and the power factor is 1, as shown in Figure 7.
 |
Fig. 7 A single PV access to the distribution network. |
When the position of the node is before the PV access point (0 < m < p), the voltage of the node m can be obtained as (15)
(15)
Because the reactance value on the line is small and the power factor is high, the reactive power on the line is also small and negligible. After removing it from the formula, equation (15) can be simplified as: (16)
(16)
It can be seen from equation (16) that after the access of distributed PV, the voltage on the distribution network line increases significantly, and this effect is not only affected by the location of the access point but also by the capacity of the access point. At this time, the voltage difference between the mth node and the m − 1 node on the line is expressed as (17)
(17)
According to formula (17), the sum of active power consumed from m nodes and all nodes after m nodes will affect the trend of voltage rise and fall. If the sum of active power consumed on these nodes is large, the voltage will have a decreasing trend. On the contrary, if the sum of active power consumed is small, the voltage will have an increasing trend.
When the position of the node is after the PV access point (m > p), the voltage of the node m on the line can be expressed as (18)
(18)
At this time, the voltage difference between the m node and the m − 1 node is (19)
(19)
Compared with before PV access, the voltage of m point does have a certain increase, but it is still lower than the voltage of m − 1 point, and the farther back the voltage is, the lower the voltage is, so the farther back the node from the distributed PV access point, the lower the voltage is. If the grid-connected capacity of PV access is very high, it may bring the problem of voltage exceeding the upper limit near the access point.
3.1.2 Multiple distributed PV grid-connected
When multiple distributed PVs are connected to the distribution network, as shown in Figure 8, the capacity of the nth node connected to the PV power supply is P vn (n = 1, 2, 3, …, N).
 |
Fig. 8 Multiple PVs are connected to the distribution network. |
The node voltage U at the m node before all PVs are connected to the distribution system and the node voltage C at the m node after all PVs are connected to the distribution system are shown as (A) (20)
(20)
 (21)
(21)
Similarly, ignoring the reactive power in the formula (21), the node voltage U
m0 and U
m
at the m node before and after the PV grid connection is shown in formula (22). (22)
(22)
 (23)
(23)
The voltage of the node on the distribution line will increase after access to PVs. If the load of the node is small and the distributed capacity of the access is high, the voltage on the node will increase. If the increase is large, it will cause the problem of the node voltage exceeding the upper limit.
3.2 Volt/var control of the distribution network based on PV power supply
In order to ensure that the voltage of the node is within the range of reliable operation, the reactive power supply must meet the requirements of the system and have a certain reserve capacity to maintain the voltage security of the distribution network. Usually, the voltage regulation of the distribution network is mainly adjusted by adjusting the tap of the transformer and the number of switching groups of the capacitor. PV inverter not only has the function of AC/DC conversion but also has a flexible and controllable, fast adjustment of distribution network node voltage. The ability to use the remaining capacity of the inverter to quickly adjust the system voltage and improve the voltage quality of the system. In addition to reducing the problem of voltage over-limit, the inverter also has a power tracking function, automatic operation, and shutdown. Because it provides a new technical means for dealing with voltage over-limit, it provides a new method for researchers to deal with voltage over-limit.
The control of the PV inverter in the PV power supply has three modes: maximum power point tracking mode, active power reduction control mode, and static synchronous compensator mode, as shown in Figure 9. Under normal circumstances, the PV inverter adopts the maximum power point tracking control mode. Considering the difference in reactive power capacity of each PV cluster, the variable droop control of reactive power is used to realize the coordinated distribution of reactive power among PV clusters, to maximize the consumption capacity of PV. If the reactive power capacity of the inverter is insufficient, the active power output of some PV clusters is reduced according to the priority to meet the reactive power demand of the system. At night or when the reactive power shortage of the system is serious, it can be switched to the static synchronous compensator mode, so that the PV inverter can operate as the static synchronous compensator mode to ensure the dynamic reactive power demand of the system.
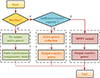 |
Fig. 9 The three control modes of the PV inverter in PV power supply. |
Generally, the design of the PV inverter has a certain capacity margin, which makes it have fast and flexible reactive power support capability and can participate in the volt/var regulation of the active distribution network. The reactive power that the PV inverter can deliver to the grid depends on the rated apparent power and active power output of the inverter, as shown in Figure 10.
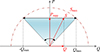 |
Fig. 10 The reactive power that the PV inverter can deliver to the grid. |
The relationship between the reactive power output limit of the PV inverter and the rated apparent power and active output of the PV inverter can be expressed as (24)
(24)
The PV power supply can participate in the volt/var control of the distribution network to meet the safe operation of the distribution network voltage. The active and reactive power output power of the PV power supply can be solved by the volt/var optimization model of the distribution network based on the PV power supply. The volt/var optimization model of the distribution network based on the PV power supply is generally established with the minimum line loss of the distribution network as the goal, the safe operation of the distribution network as the constraint, and the reactive power output of the PV power supply as the decision variable. (25)
(25)
where, r
jk
is the line resistance from bus j to bus k; I
jk
(t) is the line current from bus j to bus k at time t. (26)
(26)
 (27)
(27)
 (28)
(28)
 (29)
(29)
 (30)
(30)
where j, k, l is the distribution network bus index; J(k) and L(k) are parent nodes and child nodes; P
jk
(t), Q
jk
(t) and I
jk
(t) are the active power, reactive power and line current from bus j to bus k at time t; P
L, k
(t), Q
L, k
(t) and V
k
(t) are bus k active load, reactive load and bus voltage at time t;  is the upper limit of line current between bus j and bus k; V
min, V
max are the upper and lower limits of the voltage of the distribution network;
is the upper limit of line current between bus j and bus k; V
min, V
max are the upper and lower limits of the voltage of the distribution network;  is the PV access capacity at bus k.
3.3 Volt/Var optimization strategy for distribution network based on data-driven power flow analysis
In this paper, the volt/var control strategy of the distribution network based on data-driven power flow analysis is proposed. Compared with the traditional volt/var optimization strategy, the data-driven power flow analysis proposed in the first section is adopted in the PLF part, so as to avoid the influence of distribution network line parameters, PLF methods and other factors on the power flow analysis of the distribution network and the subsequent volt/var optimization effect.
After the power flow analysis of the distribution network based on data-driven, the volt/var model of the distribution network is transformed into (31)
(31)
![Mathematical equation: $$ [{P}^{\mathrm{net},\mathrm{loss}}(t),\enspace {V}(t)]={f}_{\mathrm{CatBoost}}({{P}}_{\mathrm{load}}(t),\enspace {{Q}}_{\mathrm{load}}(t),\enspace {{P}}_{\mathrm{PV}}(t),\enspace {{Q}}_{\mathrm{PV}}(t)) $$](/articles/stet/full_html/2025/01/stet20240164/stet20240164-eq35.gif) (32)
(32)
 (33)
(33)
 (34)
(34)
 (35)
(35)
The volt/var optimization model of PV high-proportion access distribution network based on data-driven power flow analysis is a nonlinear non-convex optimization model, which is difficult to solve directly. In this paper, the particle swarm heuristic algorithm is used to solve the nonlinear non-convex optimization model. The particle swarm optimization algorithm starts from the random position in the solution space and moves towards the direction of the minimum fitness function. Through continuous iteration, the optimal solution is obtained within the specified solution space. The particle swarm update expression is (36)where v
i
is the velocity vector of the ith particle, ω is the inertia weight, c
i
is the acceleration factor, r
i
is the random number evenly distributed in the interval [0, 1], pbest
i
is the individual optimal position of the ith particle, x
i
is the position vector of the ith particle, gbest
i
is the individual optimal position of the ith particle, and Figure 11 shows the position update process of the particle swarm optimization algorithm.
(36)where v
i
is the velocity vector of the ith particle, ω is the inertia weight, c
i
is the acceleration factor, r
i
is the random number evenly distributed in the interval [0, 1], pbest
i
is the individual optimal position of the ith particle, x
i
is the position vector of the ith particle, gbest
i
is the individual optimal position of the ith particle, and Figure 11 shows the position update process of the particle swarm optimization algorithm.
 |
Fig. 11 The position update process of the particle swarm optimization algorithm. |
The process of using the particle swarm optimization algorithm to solve the reactive power optimization problem of distribution network based on PV power supply is shown in Figure 12. Firstly, the algorithm parameters are initialized, and the voltage and power limits of each node are set as the upper and lower bounds of the particles in the particle swarm optimization algorithm. At the same time, the particles meet the equation conditions in the reactive power optimization model, and a group of particles are randomly generated as the initial particles. Then, the network loss function is set as the fitness function of the particle swarm optimization algorithm, and the fitness value of the initial particle swarm is calculated. Then, the fitness value of each particle is compared with the fitness value of the individual optimal solution, and the optimal solution is retained. Then, according to the principle of particle swarm optimization, the velocity and position of particles are updated. Finally, the optimal output of the PV power supply in the distribution network is obtained by continuous iteration.
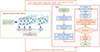 |
Fig. 12 The process of using particle swarm optimization algorithm to solve the reactive power optimization problem. |
4 Case study
4.1 Volt/Var optimization strategy for distribution network based on data-driven power flow analysis
Taking the IEEE 33-node distribution system as an example, the distributed PV power supply is connected to nodes 6, 9, 13, 14, 17, 18, 22, 25, 27, 28, 31, and 32 respectively, as shown in Figure 13. The PV access capacity of each access point is 800 kW. The parameters of the distribution system are detailed in the reference [44]. Conduct subsequent simulation analysis on a 64-bit computer with a 3.20 GHz CPU and 16 GB RAM.
 |
Fig. 13 The IEEE 33-node distribution system. |
The data of solar irradiance and ambient temperature in low-latitude areas within a year are shown in Figure 14. This paper does not consider the spatial location differences of nodes in the distribution network, and the PV active power output of all nodes is consistent. Based on the active and reactive load data of each node in the IEEE 33 node distribution system, the daily load data of each node in the IEEE 33 distribution system is generated according to the typical daily load information of the IEEE-RTS system, and then the corresponding annual load data is generated according to the Gaussian distribution.
 |
Fig. 14 Solar irradiance and ambient temperature. |
The IEEE 33-bus system parameters are shown in Table 2. The first node is a balance node. The initial active load of the system is 3715 kW, the total reactive load is 2300 kvar, and the reference voltage is 12.66 kV.
4.2 Volt/Var optimization strategy for distribution network based on data-driven power flow analysis
Based on the MATPOWER 8.1 power flow calculation toolbox, 8000 PLF data are generated, the 1st to 7000th sets of data are divided into training sets, and the 7001st to 8000th sets of data are test sets. Taking the 24-hour operation of the distribution network as an example, the absolute error between the output voltage of the CatBoost model and the real distribution network voltage is shown in Figure 15. It can be seen that the output voltage of each node of the CatBoost model is close to the real grid voltage, which can realize the accurate perception of the distribution network.
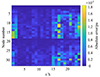 |
Fig. 15 The absolute error between the output voltage of the CatBoost model and the real distribution network voltage. |
The comparison between the distribution network loss output by the CatBoost power flow analysis model and the real distribution network loss is shown in Figure 16. It can be seen that the output distribution network loss of the CatBoost power flow analysis model is basically consistent with the real distribution network loss, indicating that the CatBoost power flow analysis model can achieve accurate perception of distribution network loss.
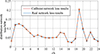 |
Fig. 16 The distribution network loss output by the CatBoost power flow analysis model and the real distribution network loss. |
4.3 Volt/Var optimization strategy for distribution network based on data-driven power flow analysis
Taking the 24 h operation of the distribution network as an example, when the PV power supply does not participate in the volt/var optimization, the voltage distribution of the distribution network is shown in Figure 17. It can be seen that some nodes in the distribution network appear to cross the upper and lower boundaries, which seriously affects the safe and stable operation of the distribution network.
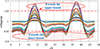 |
Fig. 17 The voltage of the distribution network before optimization. |
Under the proposed optimization strategy, the voltage of each node in the distribution network is shown in Figure 18. It can be seen that the voltage of each node in the distribution network is between 0.95 and 1.05, so the strategy proposed in this paper can make the voltage of each node in the distribution network operate within a safe range without knowing the line parameters of the distribution network.
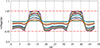 |
Fig. 18 The voltage of the distribution network after optimization. |
In both cases, the distribution network loss is shown in Figure 19. It can be seen that the optimization strategy proposed in this paper can reduce the distribution network loss and meet the voltage security constraints of the distribution network without knowing the parameters of the distribution network.
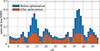 |
Fig. 19 The distribution network loss. |
In summary, the proposed data-driven PLF method of the distribution network realizes the accurate perception of voltage and network loss of the distribution network and solves the problems of high calculation cost and slow operation speed of traditional PLF method. In the aspect of optimal operation of the distribution network, a reactive power and voltage optimization strategy of the distribution network based on a data-driven PLF method is proposed, which solves the problem that the traditional PLF does not affect the efficiency of reactive power and voltage optimization of distribution network.
However, the data-driven method relies heavily on data quality, and the calculation results are inconsistent with the physical mechanism, so it is difficult to be applied in practical engineering at present stage.
5 Conclusion
In order to solve the problem that the PLF of the distribution network depends on the line parameters of the distribution network, and the volt/var optimization effect of the distribution network depends on the PLF effect of the distribution network, this paper proposes a volt/var optimization strategy of the distribution network based on data-driven power flow analysis.
-
The PLF of distribution network based on CatBoost algorithm does not need the line parameters of distribution network, and the PLF accuracy of distribution network is high.
-
Large-scale DG access to the distribution network will cause the voltage of some nodes in the distribution network to cross the boundary, affecting the safe and stable operation of the distribution network.
-
The volt/var optimization strategy of distribution network based on data-driven PLF maintains the voltage operation of distribution network within a safe and stable range without the need for distribution network parameters, and effectively reduces the network loss of distribution network operation.
Acknowledgments
This work was supported by State Grid Jiangsu Electric Power Company (J2023122).
References
- Jia Q., Li Y., Yan Z., Chen S. (2022) Reactive power market design for distribution networks with high photovoltaic penetration, IEEE Trans. Smart Grid 14, 2, 1642–1651. [Google Scholar]
- Luo F., Bu Q., Ye Z. (2024) Dynamic reconstruction strategy of distribution network based on uncertainty modeling and impact analysis of wind and photovoltaic power, IEEE Access 12, 64069–64078. [CrossRef] [Google Scholar]
- Rakpenthai C., Uatrongjit S., Premrudeepreechacharn S. (2012) State estimation of power system considering network parameter uncertainty based on parametric interval linear systems, IEEE Trans. Power Syst. 27, 1, 305–313. [CrossRef] [Google Scholar]
- Xu X., Wang H., Yan Z., Lu Z., Kang C., Xie K. (2021) Overview of power system uncertainty and its solutions under energy transition, Autom. Electr. Power Syst. 45, 16, 2–13. [Google Scholar]
- Yang H., Zhu Y., Liu C. (2022) Data-driven nonlinear power flow regression and analytical sensitivity calculation using MLSSVR, Proc. CSEE 42, 21, 0258–8013. [Google Scholar]
- Zhai J., Wu X., Zhu S., Yang B., Liu H. (2020) Optimization of integrated energy system considering photovoltaic uncertainty and multi-energy network, IEEE Access 8, 141558–141568. [CrossRef] [Google Scholar]
- Zeng S.M., Hu X.K., Meng L., Xue S., Zhao Y. (2023) Inverter reliability-constrained volt/var optimization control of distribution network with high-level PV-storage generation, J. Energy Storage 73, 109140. [CrossRef] [Google Scholar]
- Niknam T., Firouzi B.B., Ostadi A. (2010) A new fuzzy adaptive particle swarm optimization for daily Volt/Var control in distribution networks considering distributed generators, Appl. Energy 87, 6, 1919–1928. [CrossRef] [Google Scholar]
- Albrechtowicz P., Cisek P. (2022) An impact of the line resistance on the power flow calculations with installed phase-shifting transformer in different voltage levels power systems, Electr. Power Syst. Res. 209, 107970. [CrossRef] [Google Scholar]
- Mongkoldee K., Kulworawanichpong T. (2018) Current-based Newton-Raphson power flow calculation for AT-fed railway power supply systems, Int. J. Electr. Power Energy Syst. 98, 11–22. [CrossRef] [Google Scholar]
- Chen Y.H., Yan X.M., Yan X.M. (2024) Two-steps power flow calculation, Electr. Power Syst. Res. 236, 110958. [CrossRef] [Google Scholar]
- Huang J.W., Du Z.Y., Cai H.W., He J., Yue G., Li G., Zhao H., Chen Y. (2024) Probabilistic load flow calculation and power system security analysis based on improved CGC-CM, Electr. Power Syst. Res. 237, 110995. [CrossRef] [Google Scholar]
- Kan R.H., Xu Y.C., Li Z.H., Lu M. (2024) Calculation of probabilistic harmonic power flow based on improved three-point estimation method and maximum entropy as distributed generators access to distribution network, Electr. Power Syst. Res. 230, 110197. [CrossRef] [Google Scholar]
- Liao X.B., Zhang Y.M., Li Z.C., Wei H., Ding H. (2024) Probabilistic interval power flow calculation method for distribution networks considering the correlation of distributed wind power output, Int. J. Electr. Power Energy Syst. 157, 109827. [CrossRef] [Google Scholar]
- Ye S.F., Huang R.H., Xie J.X., Ou J.J. (2023) A power flow calculation method for multi-voltage level DC power grid considering the control modes and DC/DC converter, IEEE Access 11, 98182–98190. [CrossRef] [Google Scholar]
- Fan Z.X., Yang Z.F., Yu J., Xie K., Yang G. (2020) Minimize linearization error of power flow model based on optimal selection of variable space, IEEE Trans. Power Syst. 36, 2, 1130–1140. [Google Scholar]
- Zhou S.Y., Wang M.X., Wang J.H., Yang M., Dong X. (2020) Time-process power flow calculation considering thermal behavior of transmission components, IEEE Trans. Power Syst. 35, 6, 4232–4250. [CrossRef] [Google Scholar]
- Garces A. (2015) A linear three-phase load flow for power distribution systems, IEEE Trans. Power Syst. 31, 1, 827–828. [Google Scholar]
- Dong X., Ma Y., Wang Y., Chen Q., Liu Z., Jia X. (2022) An improved power flow calculation method based on linear regression for multi-area networks with information barriers, Int. J. Electr. Power Energy Syst. 142, 108385. [CrossRef] [Google Scholar]
- Lin H., Shen X., Guo Y., Ding T., Sun H. (2024) A linear distflow model considering line shunts for fast calculation and voltage control of power distribution systems, Appl. Energy 357, 122467. [CrossRef] [Google Scholar]
- Zeraati M., Sheibani M.R., Jabari F., Heydarian-Forushani E. (2024) A novel state estimation method for distribution networks with low observability based on linear AC optimal power flow model, Electr. Power Syst. Res. 228, 110085. [CrossRef] [Google Scholar]
- Chew B.S.H., Xu Y., Wu Q. (2018) Voltage balancing for bipolar DC distribution grids: a power flow based binary integer multi-objective optimization approach, IEEE Trans. Power Syst. 34, 1, 28–39. [Google Scholar]
- Liu Y., Zhang N., Wang Y. (2018) Data-driven power flow linearization: a regression approach, IEEE Trans. Smart Grid 10, 3, 2569–2580. [Google Scholar]
- Liu K., Wang C., Wang W.Z., Chen Y., Wu H. (2019) Linear power flow calculation of distribution networks with distributed generation, IEEE Access 7, 44686–44695. [CrossRef] [Google Scholar]
- Liu Y., Wang Y., Zhang N., Lu D., Kang C. (2019) A data-driven approach to linearize power flow equations considering measurement noise, IEEE Trans. Smart Grid 11, 3, 2576–2587. [Google Scholar]
- Wang Y.S., Wu H., Xu H.L., Li Q., Liu S. (2020) A general fast power flow algorithm for transmission and distribution networks, IEEE Access 8, 23284–23293. [CrossRef] [Google Scholar]
- Jin D., Chiang H.-D., Li P. (2019) Two-timescale multi-objective coordinated volt/var optimization for active distribution networks, IEEE Trans. Power Syst. 34, 6, 4418–4428. [CrossRef] [Google Scholar]
- Turitsyn K., Sulc P., Backhaus S., Chertkov M. (2011) Options for control of reactive power by distributed photovoltaic generators, Proc. IEEE 99, 6, 1063–1073. [CrossRef] [Google Scholar]
- Zhang C., Xu Y. (2020) Hierarchically-coordinated voltage/var control of distribution networks using PV inverters, IEEE Trans. Smart Grid 11, 4, 2942–2953. [CrossRef] [Google Scholar]
- Zhang B., Gao Y. (2023) Data-driven voltage/var optimization control for active distribution network considering PV inverter reliability, Electr. Power Syst. Res. 224, 109800. [CrossRef] [Google Scholar]
- Zhang Y., Xu Y., Yang H., Dong Z.Y. (2019) Voltage regulation-oriented co-planning of distributed generation and battery storage in active distribution networks, Int. J. Electr. Power Energy Syst. 105, 79–88. [CrossRef] [Google Scholar]
- Abadi S.M.N.R., Attarha A., Scott P., Thiébaux S. (2020) Affinely adjustable robust volt/var control for distribution systems with high PV penetration, IEEE Trans. Power Syst. 36, 4, 3238–3247. [Google Scholar]
- Savasci A., Inaolaji A., Paudyal S. (2022) Two-stage volt-var optimization of distribution grids with smart inverters and legacy devices, IEEE Trans. Ind. Appl. 58, 5, 5711–5723. [CrossRef] [Google Scholar]
- Aboshady F.M., Pisica I., Zobaa A.F., Taylor G.A., Ceylan O., Ozdemir A. (2023) Reactive power control of PV inverters in active distribution grids with high PV penetration, IEEE Access 11, 81477–81496. [CrossRef] [Google Scholar]
- Xu R.P., Zhang C., Xu Y., Dong Z., Zhang R. (2021) Multi-objective hierarchically-coordinated volt/var control for active distribution networks with droop-controlled PV inverters, IEEE Trans. Smart Grid 13, 2, 998–1011. [Google Scholar]
- Nguyen H.T., Choi D.H. (2022) Three-stage inverter-based peak shaving and Volt-VAR control in active distribution networks using online safe deep reinforcement learning, IEEE Trans. Smart Grid 13, 4, 3266–3277. [CrossRef] [Google Scholar]
- Dutta A., Ganguly S., Kumar C. (2021) Coordinated volt/var control of PV and EV interfaced active distribution networks based on dual-stage model predictive control, IEEE Syst. J. 16, 3, 4291–4300. [Google Scholar]
- Sun X.Z., Qiu J., Tao Y.C., Ma Y., Zhao J. (2022) A multi-mode data-driven volt/var control strategy with conservation voltage reduction in active distribution networks, IEEE Trans. Sustain. Energy 13, 2, 1073–1085. [CrossRef] [Google Scholar]
- Li H.X., Mao M.X., Guo K., Hao G., Zhou L. (2021) A decentralized optimization method based two-layer Volt-Var control strategy for the integrated system of centralized PV plant and external power grid, J. Clean. Prod. 278, 123625. [CrossRef] [Google Scholar]
- Gong C., Cheng Z.Y., Sou W.K., Lam C.S., Chow M.Y. (2023) Collaborative distributed optimal control of pure and hybrid active power filters in active distribution network, IEEE Trans. Power Deliv. 38, 4, 2326–2337. [CrossRef] [Google Scholar]
- Chamandoust H., Derakhshan G., Hakimi S.M., Bahramara S. (2019) Tri-objective optimal scheduling of smart energy hub system with schedulable loads, J. Clean. Prod. 236, 117584. [CrossRef] [Google Scholar]
- Chamandoust H., Derakhshan G., Bahramara S. (2020) Multi-objective performance of smart hybrid energy system with Multi-optimal participation of customers in day-ahead energy market, Energy Build. 216, 109964. [CrossRef] [Google Scholar]
- Chamandoust H. (2022) Optimal hybrid participation of customers in a smart micro-grid based on day-ahead electrical market, Artif. Intell. Rev. 55, 7, 5891–5915. [CrossRef] [Google Scholar]
- Baran M.E., Wu F.F. (1989) Network reconfiguration in distribution systems for loss reduction and load balancing, IEEE Trans. Power Deliv. 4, 2, 1401–1407. [CrossRef] [Google Scholar]
All Tables
Comparison of characteristics of different reactive power compensation equipment.
All Figures
|
Fig. 1 The typical WAMS system architecture. |
| In the text | |
|
Fig. 2 The data-driven power flow analysis method for distribution networks. |
| In the text | |
|
Fig. 3 The power flow analysis model structure of distribution network based on CatBoost. |
| In the text | |
|
Fig. 4 The specific integrated learning principle diagram. |
| In the text | |
|
Fig. 5 The specific schematic diagram. |
| In the text | |
|
Fig. 6 Topology structure of radial distribution system. |
| In the text | |
|
Fig. 7 A single PV access to the distribution network. |
| In the text | |
|
Fig. 8 Multiple PVs are connected to the distribution network. |
| In the text | |
|
Fig. 9 The three control modes of the PV inverter in PV power supply. |
| In the text | |
|
Fig. 10 The reactive power that the PV inverter can deliver to the grid. |
| In the text | |
|
Fig. 11 The position update process of the particle swarm optimization algorithm. |
| In the text | |
|
Fig. 12 The process of using particle swarm optimization algorithm to solve the reactive power optimization problem. |
| In the text | |
|
Fig. 13 The IEEE 33-node distribution system. |
| In the text | |
|
Fig. 14 Solar irradiance and ambient temperature. |
| In the text | |
|
Fig. 15 The absolute error between the output voltage of the CatBoost model and the real distribution network voltage. |
| In the text | |
|
Fig. 16 The distribution network loss output by the CatBoost power flow analysis model and the real distribution network loss. |
| In the text | |
|
Fig. 17 The voltage of the distribution network before optimization. |
| In the text | |
|
Fig. 18 The voltage of the distribution network after optimization. |
| In the text | |
|
Fig. 19 The distribution network loss. |
| In the text | |
Current usage metrics show cumulative count of Article Views (full-text article views including HTML views, PDF and ePub downloads, according to the available data) and Abstracts Views on Vision4Press platform.
Data correspond to usage on the plateform after 2015. The current usage metrics is available 48-96 hours after online publication and is updated daily on week days.
Initial download of the metrics may take a while.