")
")
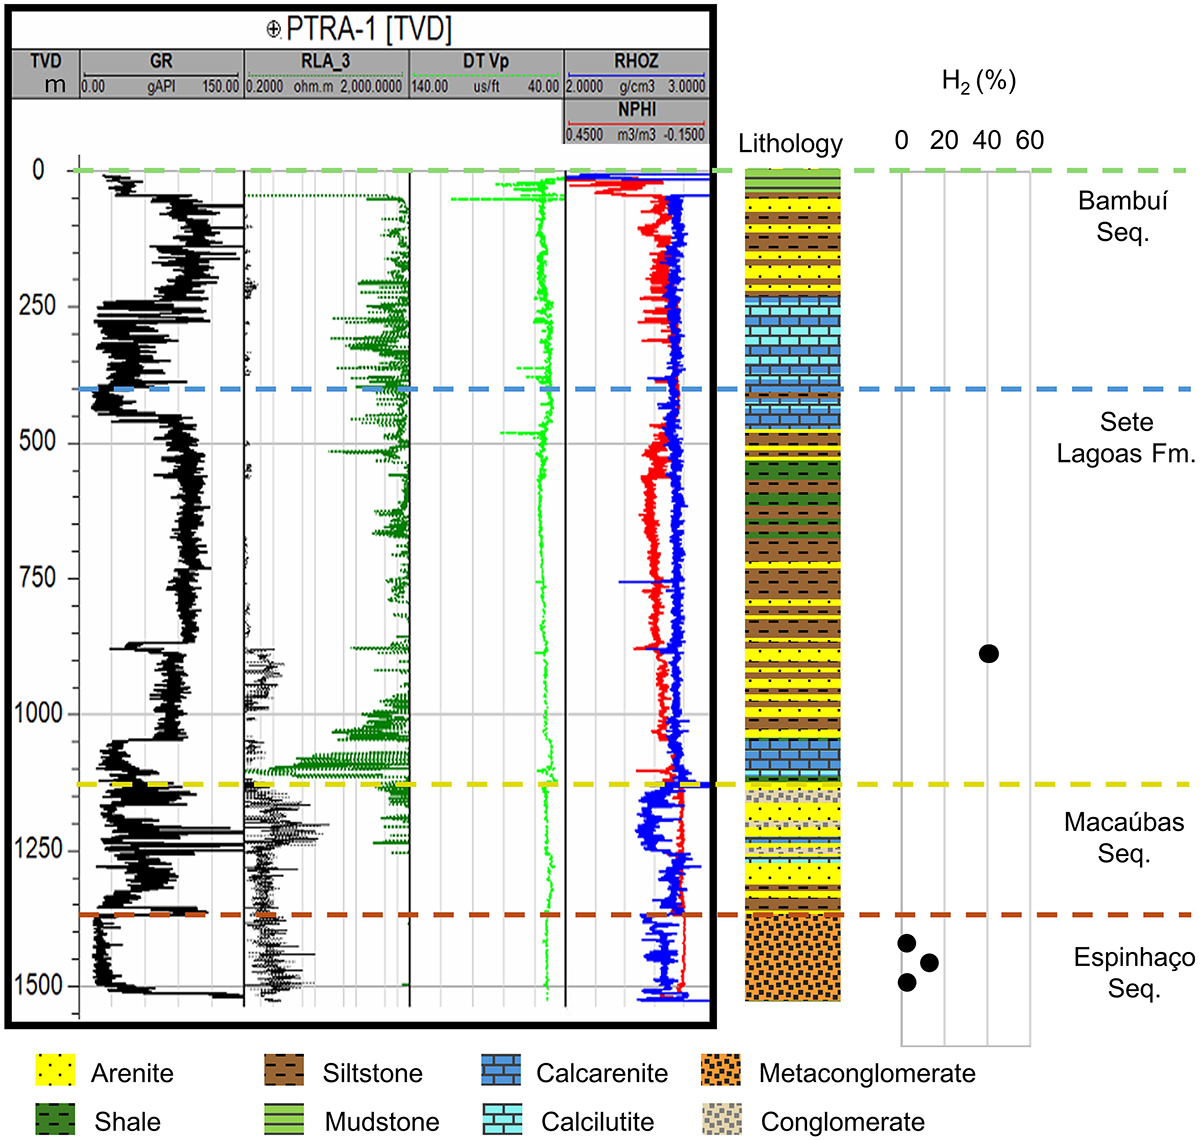
Fig. 3
Download original image
Stratigraphic column, log and H2 content in % from the well PTRA-1. H2 amounts are derived from five samples. Two of these samples are listed in Table 1, obtained during the well test (860 to 912 m depth), with the reference depth (886 m) representing an average of the depth interval. They appear superimposed in the figure due to being from the same depth interval and exhibiting similar H2 values. The remaining three samples correspond to isojar samples collected from 1419, 1455, and 1491 m depth; therefore, the accuracy of their value is questionable as discussed in item 3 of the Appendix. However, after air correction, these values are included in the graph to indicate that the Espinhaço Sequence also holds H2 shows. GR corresponds to gamma ray, RLA_3 to resistivity, DT Vp to sonic, RHOZ to density and NPHI to neutron log.
Current usage metrics show cumulative count of Article Views (full-text article views including HTML views, PDF and ePub downloads, according to the available data) and Abstracts Views on Vision4Press platform.
Data correspond to usage on the plateform after 2015. The current usage metrics is available 48-96 hours after online publication and is updated daily on week days.
Initial download of the metrics may take a while.