")
")
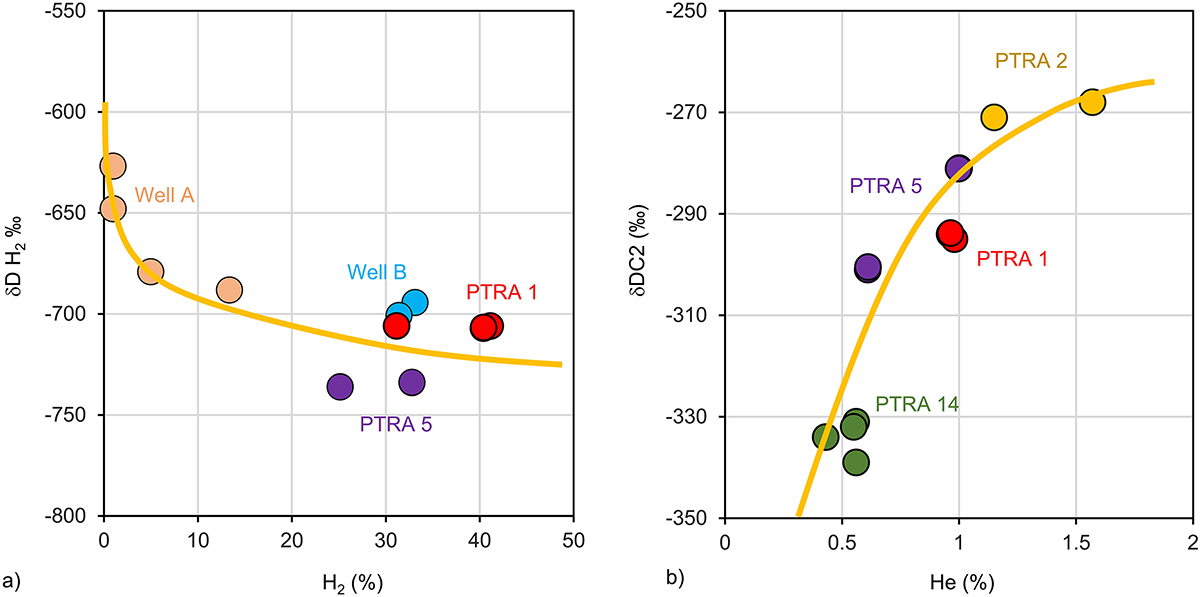
Fig. 11
Download original image
Binary diagrams using compositional and isotopic data from the São Francisco Basin wells. (a) Correlation between the concentration of H2 and its isotopic ratio; (b) Correlation between the H2 isotopic ratio of ethane versus the helium concentration of the gases. The wells A and B are located inside the study area and their data come from Prinzhofer’s private dataset and are not discussed in this article, as they do not correspond to the public data provided by the Brazilian institutions. They were added to the figure solely to better illustrate the H2 consumption.
Current usage metrics show cumulative count of Article Views (full-text article views including HTML views, PDF and ePub downloads, according to the available data) and Abstracts Views on Vision4Press platform.
Data correspond to usage on the plateform after 2015. The current usage metrics is available 48-96 hours after online publication and is updated daily on week days.
Initial download of the metrics may take a while.