")
")
| Issue |
Sci. Tech. Energ. Transition
Volume 79, 2024
Decarbonizing Energy Systems: Smart Grid and Renewable Technologies
|
|
|---|---|---|
| Article Number | 43 | |
| Number of page(s) | 14 | |
| DOI | https://doi.org/10.2516/stet/2024035 | |
| Published online | 30 July 2024 | |
Regular Article
Carbon emission measurement method of regional power system based on LSTM-Attention model
1
China Electric Power Research Institute, Haidian District, Beijing 100192, China
2
School of Electrical Engineering and Automation, Tianjin University of Technology, Tianjin 300384, China
* Corresponding author: This email address is being protected from spambots. You need JavaScript enabled to view it.
Received:
22
March
2024
Accepted:
21
May
2024
Abstract
With the acceleration of the green and low-carbon transformation of the power system, it is very important to calculate and analyze the carbon emissions of the urban power systems. In order to effectively grasp the carbon emission distribution of power systems and reduce the carbon emission of power system, this paper proposes a systematic carbon emission measurement method for regional power systems. Firstly, the quantitative analysis model of driving factors for regional power system carbon emissions is constructed, and the direction and measures of low-carbon transformation and green collaborative development of regional power systems are proposed. Secondly, energy consumption scenarios under different constraints are established to support the collaborative control path of CO2. It provides key data and a theoretical basis for the low-carbon development of the power industry. Finally, through the analysis of the arithmetic example and the combination of the three scenarios, it is concluded that under the 2020–2030 Tianjin baseline scenario, the Tianjin power sector cannot reach the peak before 2030, and under the low carbon scenario and the ultra-low carbon scenario, the total carbon emissions of the power sector are expected to peak in 2024, with a peak range of 55.83–55.9 million tons, which is only a slight increase of 210,000–280,000 tons compared to 2020 in emissions, showing the potential for effective carbon emission control. The validity of the methodology proposed in this paper is verified, and the effective path for future carbon emission reduction in electric power is analyzed, providing empirical support and strategic recommendations for the green and low-carbon transformation of the electric power system.
Key words: Power system / Carbon emissions / New energy / LSTM-Attention
© The Author(s), published by EDP Sciences, 2024
 This is an Open Access article distributed under the terms of the Creative Commons Attribution License (https://creativecommons.org/licenses/by/4.0), which permits unrestricted use, distribution, and reproduction in any medium, provided the original work is properly cited.
Nomenclature
Indices and setsn: Different influencing factors, such as fossil fuel types, energy structure, etc.
i: Different aggregation targets, such as different provinces and cities, etc
T: Time
tot: Total or overall
K: Energy variety
z: Number of energy variety
d: Equipment name
t: Vintage
g: Gas type
p: Target point
K: Neighbouring data point
i: Type of fossil energy
Parameters
Xn,i: Contribution of the nth influencing factor of the ith aggregation object (e.g., a province or city)
Vi: Total carbon emissions of theith aggregation object (e.g., a province or city)
 :
Intensity of change of individual influences
:
Intensity of change of individual influences
 :
Amount of change in individual influences
:
Amount of change in individual influences
 :
Price of energy type k consumed by equipment d in year t
:
Price of energy type k consumed by equipment d in year t
 :
Quantity of energy variety k consumed by equipment d
:
Quantity of energy variety k consumed by equipment d
 :
Number of runs of equipment d
:
Number of runs of equipment d
 :
Equipment d Energy efficiency improvement rate
:
Equipment d Energy efficiency improvement rate
 :
Government-enforceable subsidies
:
Government-enforceable subsidies
 :
Inventory of equipment d in year t−1
:
Inventory of equipment d in year t−1
 :
Operating rate for equipment d in year t
:
Operating rate for equipment d in year t
 :
Number of additions to equipment d in the year t
:
Number of additions to equipment d in the year t
 :
Number of retirements of equipment d in the year t
:
Number of retirements of equipment d in the year t
o: To delete and complete the abnormal data by using the Local outlier factor detection (LOF) algorithm and the K-nearest neighbor (KNN) based data complementation algorithm respectively
 :
The point in the k distance neighborhood of the point p
:
The point in the k distance neighborhood of the point p
 :
Reachable distance between the point p and the point o
:
Reachable distance between the point p and the point o
 :
The carbon emissions generated by the i fuel
:
The carbon emissions generated by the i fuel
 :
Energy consumption of the i fuel
:
Energy consumption of the i fuel
E: Energy consumption of thermal power generation
T: Thermal power generation
Q: Total power generation
EC: Total electricity consumption
 :
Actual electricity consumption
:
Actual electricity consumption
 :
Electricity consumption of transmission and distribution loss
:
Electricity consumption of transmission and distribution loss
GDP: GDP
P: Total population
Decision variables
V: Total carbon emissions of the ith aggregation object (e.g., a province or city)
 :
Carbon emissions at time 0, time T
:
Carbon emissions at time 0, time T
 :
Changes in carbon intensity
:
Changes in carbon intensity
 :
Changes in carbon emissions
:
Changes in carbon emissions
 :
General formulae for the effect of the kth factor on the right-hand side of equations (4) and (5), respectively
:
General formulae for the effect of the kth factor on the right-hand side of equations (4) and (5), respectively
 :
Energy cost
:
Energy cost
 :
Number of energy varieties k consumed by the equipment d
:
Number of energy varieties k consumed by the equipment d
 :
The lower limit constraint of energy consumption
:
The lower limit constraint of energy consumption
 :
The upper limit constraint of energy consumption
:
The upper limit constraint of energy consumption
 :
Number of equipment d in operation in the year t
:
Number of equipment d in operation in the year t
 :
Inventory of equipment d in the year t
:
Inventory of equipment d in the year t
 :
Emissions of gas g produced by the power industry in the year t
:
Emissions of gas g produced by the power industry in the year t
 :
Maximum carbon emission constraint
:
Maximum carbon emission constraint
 :
Missing data points
:
Missing data points  in any operating environment of the power system
 :
Degree of the outlier of the regional power system operation point p based on the k neighbors
:
Degree of the outlier of the regional power system operation point p based on the k neighbors
 :
Local reachable density
:
Local reachable density
C: Total carbon emissions from the power industry
 :
Carbon emission factor effect
:
Carbon emission factor effect
 :
Energy structure effect
:
Energy structure effect
 :
Conversion efficiency effect
:
Conversion efficiency effect
 :
Power structure effect
:
Power structure effect
 :
Proportional effect of electricity generation and consumption
:
Proportional effect of electricity generation and consumption
 :
Electricity consumption intensity effect
:
Electricity consumption intensity effect
 :
Economy scale effect
:
Economy scale effect
p = P: Population scale effect
 :
Network loss effect
:
Network loss effect
1 Introduction
China is in the stage of rapid development of industrialization and continuous improvement of urbanization level. Because the energy structure is still dominated by fossil energy, which leads to a large amount of carbon dioxide emissions, the clean and low-carbon development of the electric power system should not be delayed [1]. The measurement and analysis of carbon emissions from the power system can provide a more effective and comprehensive understanding of the distribution of carbon emissions in the region, and enable effective monitoring of carbon emissions, so as to provide reliable technical support for the collaborative development of low-carbon emission reduction and facilitate the realization of the goal of “carbon peaking and carbon neutrality” [2].
At present, the electric power industry mainly adopts the emission factor method to carry out carbon emission accounting and has not yet established a systematic indicator system for carbon emission statistics, monitoring and assessment [3]. Due to the lack of a carbon emission trajectory analysis method for the power system, high-precision carbon emission accounting methods, result in difficulties in realizing accurate and credible carbon emission index statistics, monitoring and assessment, which in turn affects the carbon emission reduction decomposition targets, seriously affecting the decomposition of carbon emission reduction targets. The decomposition and realization of the carbon emission “dual-control” goal urgently require the electric power industry to carry out carbon emission measurement and decomposition of driving factors to provide a basis for the decomposition of its goals.
Nowadays, the methods of carbon dioxide measurement mainly include the IPCC inventory method, actual measurement method, “carbon footprint” method and material conservation method. Ouyang Bin [4] et al. measured the current status of energy consumption and carbon emissions in road transportation, waterway transportation (including ports), and urban passenger transportation in Jiangsu Province from 2005 to 2012 based on the IPCC methodology. Lu [5] et al. used the IPCC inventory method to compile an updated CO2 emission inventory of China and its 30 provinces during the epidemic period and accounted for China’s carbon emissions from 2020 to 2021. Zhou [6] et al. utilized net power generation for near-real-time monitoring, designed a regression model-based near-real-time monitoring method, and proposed an emission estimation network based on a deep learning model for heterogeneous networks to estimate near-real-time CO2 emissions from coal-fired power plants. The experimental results show that the method is not only accurate in measurement but also easy to implement. Wang [7] et al. found that some companies may tamper with the CEMS data when the concentration of pollutants is expected to exceed the limit value by comparing the CEMS datasets from by comparing the CEMS datasets of key polluters in Henan Province from 2017–2019 to the on-site measurements and found that some companies may tamper with the CEMS data when the concentration of the pollutants is expected to exceed the limit value and there is a great problem with the quality of the data. Based on the carbon emission and carbon footprint modeling of energy, Zhao [8] et al. measured the carbon emissions from fossil energy and biomass energy use in different regions of China from 1998 to 2008 based on energy carbon emission and carbon footprint models. Shang et al. [9] proposed a carbon emission accounting method for buildings based on the “carbon footprint” method and measured the carbon emissions of low-rise residential buildings in Beijing at all stages of their lives. Yan Xiao [10] measured the carbon footprint of Chongqing Municipality from 1980 to 2009 using the material conservation method. Zhang et al. [11] applied the carbon flow theory to the Changzhou power system in Jiangsu province and calculated the indirect carbon emissions from the load side and the network side based on the node carbon potential matrix and the network loss distribution matrix. Through the correspondence between power current and carbon flow, the “minute-level” carbon measurement is realized. The experimental results prove that the method realizes dynamic carbon emission factor calculation based on carbon emission flow theory, improves the accuracy and real-time accounting of indirect carbon emissions, and provides a technical guarantee for users to save energy and reduce carbon emissions. Zhou [12] et al. used artificial neural networks and polynomial regression to realize the carbon emission accounting in the cement industry, respectively.
For the optimal energy scheduling problem, Heydar et al. [13] modeled the scheduling problem of SMG as a multi-objective function considering economic and environmental indicators and customer behavior. In addition, a multi-objective function optimization scheduling method was proposed using the shuffled frog jump algorithm to minimize economic and environmental metrics as well as maximize customer satisfaction metrics [14]. Heydar [15] proposed a multi-objective model for one day ahead scheduling of SEHS which focuses on the minimization of operating costs while considering the minimization of pollution emissions on the generation side, minimization of the probability of loss of energy supply on the demand side, and minimization of deviation of the total demand from the optimal level. Heydar [16] proposed a three-objective optimization model for the problem of optimal scheduling of EHS which considers economic, environmental metrics, and load-shifting methods. Heydar [17] proposed a new optimal energy dispatch method for RSEDGs which combines a tri-objective function considering economic, environmental, and reliability metrics as well as renewable energy and DSM strategies. To summarize, the traditional carbon accounting methods have low accuracy, and the power system is unable to comprehensively grasp the distribution and trajectory of carbon emissions of the power system. There is an urgent need to propose a carbon emission measurement and analysis method applicable to the power system from a systematic perspective. The comparison between the methods in this paper and those in related literature is shown in Table 1.
Comparison between this paper and related works.
As a key monitoring industry of carbon emission, energy and power is the key to realizing “carbon peak and carbon neutral” in China. This paper firstly analyzes the driving factors of regional power system carbon emissions and their causes through research, adopts LMDI [18] decomposition method to study the contribution of driving factors of regional power system carbon emissions, and digs deep into the driving factors that have a greater impact on carbon emissions of each link of the regional power system. Secondly, based on distribution characteristics and changes in the power system under the multi-temporal and spatial dimensions, it constructs a quantitative analysis model for the distribution of carbon emissions of the power system, which takes into account various influencing factors and effectively captures the pattern of change of carbon emissions in time and space, thus providing a more systematic and precise analysis tool for the comprehensive control of carbon emissions in the power system. Lastly, we proposed the analysis method of measuring carbon emissions for the power system from a systematic perspective, which breaks through the limitations of the traditional method in terms of data acquisition and modeling accuracy. The method proposed in this paper can not only improve the accuracy and reliability of carbon emission measurement, but also provide more effective decision-making support for power system operators, thus helping to realize the decomposition and realization of the “dual-control” goal of carbon emission. The primary contributions of this study are as follows:
-
Constructing a systematic carbon emission measurement method based on LSTM-Attention. By adopting the LMDI decomposition method, the article analyses in depth the key drivers affecting the carbon emissions of the regional power system and quantifies the relative contributions of these factors. This approach helps identify the impact of individual factors on carbon emissions during the process of power production and consumption and provides a scientific basis for formulating targeted emission reduction strategies.
-
A systematic method for measuring carbon emissions from regional power systems is proposed. Through the quantitative analysis model of the drivers of carbon emissions in the regional power system, the dynamic pattern of carbon emissions over time and space is effectively captured, which improves the accuracy and practicability of carbon emissions assessment. The application of the model can provide a powerful tool for achieving refined management and prediction of carbon emissions.
2 Analysis of influencing factors of carbon emissions in regional power system
In this chapter, we first study the causes and main driving factors of carbon emissions in regional power systems from the dimensions of energy structure and the structure of electricity-using industries. Secondly, we calculate the influences and contributions of different categories of driving factors and finally, we construct a quantitative analytical model of the driving factors of carbon emissions in regional power systems.
2.1 Current situation of power carbon emissions
China has become the world’s largest carbon emitter because of its large energy consumption and inefficient use of energy as a result of its crude economic growth model, which has led to increasing carbon dioxide emissions. As the most important energy sector in China, the proportion of electricity consumption in China’s total energy terminal consumption has been increasing year by year, and because of China’s resource endowment of “more coal, less oil, less gas” [19], China’s power production model is mainly based on thermal power, accounting for more than 75% of the total. The carbon dioxide emissions from coal burning from 1900 to 2021 are shown in Figure 1. Due to China’s financial and technical difficulties, resulting in the scale of centralized development and utilization of renewable resources in China is small [20], and the proportion of renewable resources power generation [21] in China’s total power generation is only about 20%. Environmental problems such as carbon emissions and air pollution caused by coal-fired power generation will continue to worsen in the next 10–15 years [22]. Therefore, it is urgent to study the driving factors of carbon emissions in the power industry and find out the methods to reduce carbon emissions in power production, which is the magic weapon to safeguard the ecological environment and one of the paths for the sustainable development of power enterprises.
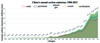 |
Figure 1 Carbon dioxide emissions from different fuels, 1900–2021. |
2.2 The main influencing factors of carbon emissions in regional power system
Under the background of industrial transfer [23] and the gradual increase of inter-provincial trade, China’s carbon emissions have led to the main contradiction of China’s carbon emissions growth. Numerous scholars at home and abroad have conducted relevant research on the influencing factors of carbon emissions from different angles. Some scholars have investigated the impact of different driving factors on carbon emissions from the dimensions of energy structure and the structure of electricity-using industries. In this paper, combining the related influencing factors of regional power system researched in the existing literature and considering the links of power production, transmission and distribution as well as terminal consumption and data availability, the growth of China’s power carbon emissions is decomposed into nine influencing factors, including carbon emissions factor, energy structure, conversion efficiency, power structure, power generation and consumption ratio effect, power consumption intensity, economic scale, population scale and network loss effect, and establish a system of carbon emissions driving factors in the regional power system [24].The construction process of the quantitative analysis model of driving factors for carbon emissions in regional power systems is shown in Figure 2.
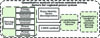 |
Figure 2 The construction process of the quantitative analytical model of driving factors for carbon emissions in regional power system. |
3 Carbon emissions measurement of power systems based on systematic perspective
Based on the above analysis, this chapter establishes energy consumption scenarios with different constraints to support a collaborative control path for CO2 [25]. By upgrading of the energy structure optimization and control technology, it is able to analyze the energy consumption structure, power consumption demand, and production composition under different scenarios, support the carbon emissions reduction decision-making of the power industry in Chinese cities or regions [26] and provide key data and theoretical basis for China’s low-carbon development.
3.1 Carbon emission factor data acquisition
Based on the sorting out, screening, and comprehensive analysis of the existing research results, the recommended value of the power carbon emission factor suitable for China’s power industry is determined [27]. Due to the different parameter settings, system raw materials, and technology levels of different data sources, the results of the statistics will have a large deviation, through the decision diagram shown in Figure 3 to verify the obtained data and determine the final value of the emission factor. Since it is difficult to obtain the values of the respective carbon emission factors for each of the production stages of a system, and since the data obtained from the combination greatly increases the uncertainty of the final results, the pathways (2) and (3) were chosen only when data could not be collected by the pathway (1).
 |
Figure 3 Process of data acquisition for carbon emission factors. |
3.2 Construction of carbon emission driving factor model
Quantitatively analyzing the multiple influencing factors of energy demand and overall energy intensity has gradually become a field of concern for researchers in order to gain a deeper understanding of the internal mechanisms of energy consumption and energy intensity changing with time, and to help the government take targeted measures. Because the LMDI decomposition method has the advantages of solid theory, strong applicability, easy to use, and easy to explain the results, it is an ideal decomposition method and is currently widely used in the analysis of the influencing factors of carbon emissions. The LMDI [28] principle steps are as follows:
- 1.
Establishment of carbon emission decomposition formula
 (1)
(1)
Where,  , the subscript
  represents different influencing factors, such as fossil fuel types, and energy structure, and
  represents different aggregation targets, such as different provinces and cities, etc.
- 2.
Characterize the change from 0 to
 moments
 (2)
(2)
 (3)
(3)
The multiplicative form represents the ratio of the reporting period to the base period, which is equal to the product of the change in intensity of the individual influencing factors, reflecting the change in the intensity of carbon emissions: (4)
(4)
The additive form represents the difference between the reporting period and the base period, which is equal to the sum of the changes of the individual influencing factors and reflects the change in carbon emissions: (5)
(5)
- 3.
Decomposition of the contribution of each influencing factor Logarithmic average function:
 (6)
(6)
Multiplicative form decomposition: (7)
(7)
Additive form decomposition: (8)
(8)
Where,  .
.
3.3 Establishment of constraints for carbon emissions measurement and analysis
Based on the systematic perspective of carbon emission measurement and analysis, it is necessary to consider multiple aspects of the power system such as power generation, transmission, substation, and electricity consumption, involving energy cost constraints [29], energy consumption constraints [30], system operation constraints [31] and carbon emission constraints [32], etc.
- 1.
Energy cost: It is the sum of the energy consumption of all equipment multiplied by the price of energy. When calculating, it is necessary to take into account the changes in the prices of different energy varieties over time, the improvements in the energy efficiency of equipment, and the subsidies that can be implemented by the government, Energy cost is an important part of the operation of the power system, which directly affects the economic efficiency and sustainable development capability of the power system. By accurately calculating the energy cost, it can provide an important decision-making basis for the planning, construction and operation of the power system, which helps to optimize the allocation of resources and improve the efficiency of energy use. The expression is as follows [33]:
 (9)
(9)
Where k represents the energy variety, z represents the number of energy varieties,  represents the price of the energy variety k consumed by the equipment
  in the year
  represents the number of energy varieties k consumed by the equipment
  represents the number of the equipment d in operation, an
  represents the improvement rate of energy efficiency of the equipment d.
- 2.
Energy consumption constraints: It means that the sum of all equipment operating in the power industry multiplied by the energy consumption per unit of equipment must not exceed or fall below a certain limit value, so as to satisfy the policy constraint of controlling the total amount of energy in the country or industry. This constraint is to ensure that the energy consumption of the power industry does not exceed the prescribed limit in order to achieve the goal of energy conservation and emission reduction. The expression is as follows [34]:
 (10)
(10)
Where,  represents the total consumption of energy varieties
  consumed by all equipment in the power industry, which
  is the lower limit constraint of energy consumption and
  is the upper limit constraint of energy consumption.
- 3.
System operation constraints: It means that the equipment operation shall not be greater than the equipment inventory of the power-on, The purpose of this constraint is to ensure the stable operation of the power system and to avoid damage or failure of equipment due to overuse, the system operation constraint is one of the important guarantees for the development of the power system and the expression is as follows [34]:
 (11)
(11)
 (12)
(12)
Where  represents the inventory of equipment
  in the year
  represents the inventory of equipment
  in the year
  represents the number of additions to equipment
  in the year
  represents the number of retirements of equipment
  in the year
  represents the number of equipment
  in operation in the year
  , and
, and  represents the operating rate of equipment
  in the year
  .
.
- 4.
Carbon emission constraints: It is a mechanism for limiting and managing greenhouse gas emissions such as carbon dioxide, i.e., in economic activity, the sum of all equipment operations multiplied by the emissions per unit of equipment must not exceed a certain limit value, so as to meet the constraints of the national and industry low-carbon development goals. The expression is as follows [34]:
 (13)
(13)
Where  represents the emissions of gas
  produced by the power industry in the year
  is the maximum carbon emission constraint.
3.4 Carbon emission measurement model based on LSTM-Attention
Firstly, we clarify the correlation and interaction mechanism between data in different fields, and based on the limited operational data obtained, we construct the mathematical model of carbon emissions and various types of data and clarify the system boundary and related processing methods. For the primary data with heterogeneous characteristics from multiple sources, statistical analysis, source analysis, and causal analysis are used to extract efficient secondary data resources and build a dynamic interactive simulation environment. The dynamic simulation environment supports mathematical models and multi-agent models, and can reflect a small number of special behaviors and irrational behaviors, which facilitates the effective dynamic evaluation of the evolution trend of carbon emissions of the power system under the influence of uncertainties in the complex internal and external environments.
- 1.
Data pre-processing
Due to carbon emission-related power system data will face data transmission abnormality, insufficient data storage and system maintenance in the actual operation process, carbon emission related characteristic data will have an abnormality, missing and other problems, which seriously affects the accuracy of the results of the analysis of carbon emission of urban energy and power. Therefore, in this paper, the KNN method is used for data completion [35] by finding the  data points that are closest to the data points to be completed in space, and taking the average value of the
  neighboring data points as the data points to be completed to obtain the completed value. For the missing data points
  in any operating environment of the power system, the calculation formula of the data complementation method based on the KNN is as follows [36]:
 (14)
(14)
Where,  is to delete and complete the abnormal data by using the Local outlier factor detection (LOF) algorithm and the Knearest neighbor (KNN) based data complementation algorithm respectively. LOF is a density-based outlier detection algorithm, which mainly characterizes the outlier degree of the target point
  by using the relative densities of its nearby neighbors the target point
  , which is obtained by the following formula [37]:
 (15)
(15)
 (16)
(16)
Where,  represents the degree of the outlier of the regional power system operation point
  based on the
  neighbors,
  represents the point in the
  distance neighborhood of the point
  represents the local reachable density,
  is the reachable distance between the point
  and the point
  , which is determined by the maximum value between the Euclidean distance of the point
  from the point
  and the Euclidean distance of the point
  from its
  neighbors. The processing flow of the data related to carbon emission features based on LOF and KNN is shown in Figure 4.
- 2.
LSTM-Attention model establishment
 |
Figure 4 Processing flow of carbon emission-related characterization data based on LOF and KNN. |
In order to realize carbon emissions measurement and prediction based on a systematic perspective, it is necessary to combine the characteristics of the relevant data obtained and the typical scenarios, consider the logical relationship between carbon emission of the urban power system and the operation business of the power system, consider the correlation relationship between carbon emission of the regional power system and the main economic indexes as well as the key boundary conditions of the emission reduction expectation, policy expectation, and economic development, and then analyze and construct the carbon emission measurement and analysis model of the regional power system. The analytical model clarifies the input model and output content to support the acquisition of the correlation relationship between the carbon emission of the power system and the main urban economic activity indexes under different dimensions such as regions and industries.
LSTM-Attention analysis model [29, 38] is shown in Figure 5, the model uses historical electricity data, energy consumption data, and product output data to train the “Electricity-yield Analysis Model” and “Electricity-Energy Consumption Analysis Model”, etc., to portray the relationship between electricity and production processes, energy consumption, and economic activities. After the training is completed, the monthly electricity consumption data of each industry and region are inputted into the model to obtain the production process level and energy activity level data of each industry and region for the month, and then the carbon emission factors provided by IPCC are used to calculate the carbon emissions from power. In addition, when calculating regional carbon emissions, it is necessary to add the transferred carbon emissions generated by the transfer of regional power in and out, and this part is multiplied by the regional power carbon emission factor by the amount of transfer red electricity to obtain the transferred carbon emissions caused by power transfer in and out.
 |
Figure 5 Carbon emission calculation based on the LSTM-Attention technology. |
4 Example analysis
4.1 Decomposition results of influencing factors of carbon emissions in Tianjin
In this paper, the model of carbon emissions decomposition factors in the power system is established based on the LMDI model as shown in Formula (17). Through this model, we can analyze the factors of carbon emission changes in the power industry, so as to provide the basis and suggestions for reducing carbon emissions. In which the meanings of each variable are shown in the following Table 2: (17)
(17)
Meaning of variables.
Where, carbon emission factor effect:  , energy structure effect:
  , conversion efficiency effect:
  , power structure effect:
  , proportional effect of electricity generation and consumption:
  , electricity consumption intensity effect:
  , economy scale effect:
  , population scale effect:
  , network loss effect:
  .
.
The contribution rate of each influencing factor can be obtained by dividing the number of changes in carbon emissions caused by fossil energy in terms of energy structure, conversion efficiency, power structure, proportional effect of electricity generation and consumption, electricity consumption intensity, economy scale, population scale, and network loss effect by the total amount of changes in carbon emissions. Generally, the contribution rate is greater than 0, which indicates that the influencing factors have a pulling effect on carbon emissions. If the contribution rate is less than 0, it shows that the influencing factors have a mitigating effect on carbon emissions. The continuous decomposition method is chosen to analyze the effects year by year in one year, and Table 3 and Table 4 give the changes in carbon emissions in Tianjin during this period, as well as the contribution value and contribution rate of each effect.
The additive decomposition results of each driving factor from 2012 to 2021 (ten thousand tons).
The multiplicative decomposition results of each driving factor from 2012 to 2021.
As can be seen through Table 3, the carbon emissions generated in Tianjin showed a decreasing trend in 2012–2016 and 2018–2019, while the carbon emissions were increasing in the remaining years. The factors that dominate the rise in carbon emissions have always been the economic scale effect, population-scale effect, and network loss effect, and the factors that dominate the decline in carbon emissions are mainly the energy structure, electricity consumption intensity, and the proportion of electricity generation and consumption, and the change in conversion efficiency has a positive and negative impact on the carbon emissions of the power industry compared with the rest of the effects. In summary, future research on low-carbon technologies at the provincial and municipal levels is extremely important for carbon emission reduction.
4.2 Tianjin carbon emission scenario analysis
According to the 2012–2021 data, the city-level scenario schemes such as Table 5 were obtained based on boundary conditions and assumptions.
Tianjin 2030 energy and electricity consumption scenario setting.
The average annual growth rate of GDP per capita: Considering the special situation of Tianjin’s economic development in the “13th Five-Year Plan”, it is expected that Tianjin’s economy will experience a recovery growth in the “14th Five-Year Plan”, and the per capita economic growth rate will not be lower than the national average level in the “12th Five-Year Plan”, and the annual growth rate is set at 5.8% in the baseline scenario, and it is expected that the GDP of Tianjin will reach RMB 27,320,000 in 2025 and RMB 35,700,000 in 2030.
Carbon emission intensity: During the “14th Five-Year Plan” period, Tianjin, as a municipality directly under the central government, is positioned as “one base and three regions” in the integrated construction of the Beijing-Tianjin-Hebei region, and the period before 2030 will be an important opportunity period for Tianjin’s economic development, and its economic growth will still be higher than the national average growth rate. Its industrial positioning determines that its energy consumption per unit of GDP cannot fall too fast, and considering the impacts of various aspects, it is expected that the carbon emission intensity will be reduced by 20.8% cumulatively from 2021 to 2030 under the baseline scenario.
Electricity demand: Considering the conditions of clean resources in Tianjin and the increase in electricity substitution, it is expected that there will be a greater potential for growth in electricity demand in the future. It is preliminary forecasted that the total power demand in 2025 will be 112.5 billion kWh the total power demand in 2030 will be 143.5 billion kWh, and the annual growth rate of the baseline scenario be set at 4.8%.
Renewable energy installed capacity: According to the “14th Five-Year Plan” for energy development in Tianjin, the projects to be started and completed and put into operation during the “14th Five-Year Plan” period, including the third set of units of a gas turbine with 463,000 kW, and the construction of the pumped storage project started, with a total installed capacity of 1 million kW in four units of 250,000 kW, which is expected to be put into operation during the “15th Five-Year Plan period”, and the new wind power project will be 1,550,000 kW, and the new photovoltaic project will be 1,600,000 kW, with energy storage facilities will be built simultaneously. It is expected that the annual growth rate under the baseline scenario is set at 7%.
Training the LSTM-Attention model based on the baseline scenario can get the comparison results as in Table 6, and combining the three scenarios, the results of electricity carbon accounting under different scenarios in Tianjin in 2020–2030 are shown in Figure 6.
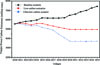 |
Figure 6 The results of power carbon emissions under different scenarios in Tianjin. |
Comparison results of different models in the baseline scenario.
Scenario analysis shows that under the baseline scenario, the power industry of Tianjin will not be able to peak by 2030, under the low-carbon scenario and the ultra-low-carbon scenario, that is, the further development of renewable energy, the total carbon emissions of the power industry will peak in 2024. The peak emissions are between 55.83 and 55.9 million tons, and the peak emissions are 21–28 million tons higher than in 2020. Therefore, in order to reduce the carbon emission intensity, it is necessary to work on both optimizing the industrial structure and optimizing the energy consumption structure at the same time, which is also the main direction of the development of a low-carbon economy in Tianjin.
According to the simulation of Tianjin’s “14th Five-Year Plan” carbon peak situation based on the scenario settings, it can be seen that the carbon emissions in the “14th Five-Year Plan” period simulated under the baseline scenario show an upward trend, and it is impossible to achieve carbon peak. The carbon emissions simulated under the low-carbon scenario all show a downward trend, and all of them will enter a significant decline stage in 2025, which ensures that Tianjin will achieve a carbon peak before 2025. The carbon emissions simulated under the ultra-low carbon scenario all show a decreasing trend, with the former entering a significant decrease stage in 2025 and the latter entering a significant decrease stage in 2024, and the rate of carbon emissions decrease under the ultra-low carbon scenario is larger than that under the low-carbon scenario.
Carbon peaking is defined as the peak and gradual decline or fluctuating decline of energy-related carbon emissions in the last five years, while the carbon emissions and GDP are in a strong decoupling or weak decoupling state. As can be seen from Figure 6, under this scenario, the city will realize a carbon peak in 2025 and will reach the peak of carbon emissions in 2020–2035 according to the development of low-carbon mode. In summary, it is difficult for Tianjin to realize a carbon peak before 2025 according to the development of the baseline scenario, and the development of the low carbon scenario and ultra-low carbon scenario can ensure the realization of a carbon peak before 2025.
5 Conclusion
Firstly, this paper studies the causes and main driving factors of carbon emissions in regional power systems from the dimensions of energy structure and power consumption industrial structure, establishes the driving factors system of carbon emissions in regional power systems, and constructs a quantitative analysis model of driving factors for carbon emissions in regional power system. Secondly, the relationship between regional power system carbon emissions and major economic activity indexes in different dimensions is studied. Finally, the calculation method of carbon emission intensity of regional power systems is studied from the perspectives of energy structure, industrial structure of electricity consumption, and economic growth. From the analysis of the example results, it is concluded that it is difficult for Tianjin to realize a carbon peak before 2025 according to the development of the baseline scenario, and the development of the low carbon scenario and ultra-low carbon scenario can ensure the realization of a carbon peak before 2025. The research results can promote the process of power system emission reduction, promote industrial transformation and upgrading, and better serve high-quality development of economic and social. It will not only meet the people’s needs for a better life but also reflect the company’s responsibility and commitment to moving towards the “double carbon” goal.
In summary, in order to realize China’s goal of carbon peaking and carbon neutrality, the possible future development directions include the following three aspects:
-
Exploration of deep decarbonization pathways. Further research on how to achieve deep decarbonization of the power system through technological innovation (e.g. carbon capture and storage, hydrogen utilization), market mechanism (e.g. carbon trading), and policy innovation while maintaining stable economic growth.
-
Multi-dimensional interactive impact analysis. Consider the impacts of climate change feedback, energy price fluctuations, international energy cooperation, and other factors on regional power system carbon emissions, and construct a more complex and dynamic system model.
-
Combining long-term vision and short-term action. To study how to ensure the achievement of short-term emission reduction targets while planning the transformation path of the power system under the long-term carbon neutral vision, including infrastructure investment, technology roadmap, and international cooperation strategy.
Acknowledgments
This work was supported by State Grid Corporation of China Technology Proiect “Research on Carbon Emission Measurement Model and Calculation Method of Regional Power System Based on Power Flow” (Grant: 5108-202218280A-2-13-XG).
Author contribution statement
C.L and X.Z.T meticulously conceived the entire paper, contributing to the comprehensive conceptualization of the paper, and designed an LSTM-Attention model for carbon emission measurement, which is specifically designed to provide key data and theoretical basis for the low-carbon development of regional power systems. D.L.Z and F.F.Y proposed and actively participated in the design of the direction and measures for the low-carbon transition and green synergistic development of the regional power system. Y.B.W and J.L were responsible for drafting the main manuscript text and skillfully adding changes to the paper to improve the key knowledge content.
References
- Wang X., et al. (2022) Research progress and prospects of advanced power generation technology under the goal of carbon emission peak and carbon neutrality, Therm. Power Gen. 51, 1, 52–59. [Google Scholar]
- Chong C.T., et al. (2022) Post COVID-19 energy sustainability and carbon emissions neutrality, Energy 241, 122801. [CrossRef] [PubMed] [Google Scholar]
- Wang D., Xue X., Wang Y. (2021) Overcapacity risk of China’s coal power industry: a comprehensive assessment and driving factors, Sustainability 13, 3, 1426. [CrossRef] [Google Scholar]
- Bin O., et al. (2015) Calculation and evaluation methodology of transport energy consumption and carbon emission—the case of Jiangsu Province, Soft Sci. 29, 1, 139–144. [Google Scholar]
- Lu Y., Chen X. (2023) Digital economy, new-type urbanization, and carbon emissions: evidence from China, Environ. Prog. Sustain. Energy 42, 3, e14045. [CrossRef] [Google Scholar]
- Zhou S., et al. (2023) A data-driven method to monitor carbon dioxide emissions of coal-fired power plants, Energies 16, 4, 1646. [CrossRef] [Google Scholar]
- Wang X., et al. (2022) Evaluating the data quality of continuous emissions monitoring systems in China, J. Environ. Manag. 314, 115081. [CrossRef] [Google Scholar]
- Zhao R., et al. (2014) Carbon emission and carbon footprint of different industrial spaces in different regions of China, Singapore: Springer. [Google Scholar]
- Shang C., Zhang Z. (2010) Assessment of life-cycle carbon emission for buildings, J. Eng. Manage. 24, 1, 7–12. [Google Scholar]
- Yan X., et al. (2012) Correlation analysis of economic development and carbon footprint in Chongqing City, J. Southwest China Normal Univ. (Nat. Sci. Ed.) 37, 6, 167–173. [Google Scholar]
- Zhang N., et al. (2023) Carbon measurement method and carbon system for whole chain of power system[J], Autom. Electr. Power Syst. 47, 9, 2–12. [Google Scholar]
- Zhou C., et al. (2023) Accounting CO2 emissions of the cement industry: based on an electricity-carbon coupling analysis, Energies 16, 11, 4453. [CrossRef] [Google Scholar]
- Chamandoust H., Bahramara S., Derakhshan G. (2020) Day-ahead scheduling problem of smart micro-grid with high penetration of wind energy and demand side management strategies, Sustain. Energy Technol. Assess. 40, 100747. [Google Scholar]
- Chamandoust H., Derakhshan G., Bahramara S. (2020) Multi-objective performance of smart hybrid energy system with Multi-optimal participation of customers in day-ahead energy market, Energy Build. 216, 109964. [CrossRef] [Google Scholar]
- Chamandoust H., et al. (2020) Multi-objectives optimal scheduling in smart energy hub system with electrical and thermal responsive loads, Environ. Clim. Technol. 24, 1, 209–232. [CrossRef] [Google Scholar]
- Chamandoust H., et al. (2019) Tri-objective optimal scheduling of smart energy hub system with schedulable loads, J. Clean. Prod. 236, 117584. [CrossRef] [Google Scholar]
- Chamandoust H., et al. (2020) Tri-objective scheduling of residential smart electrical distribution grids with optimal joint of responsive loads with renewable energy sources, J. Energy Storage 27, 101112. [CrossRef] [Google Scholar]
- Xiang X., et al. (2022) Python-LMDI: a tool for index decomposition analysis of building carbon emissions, Buildings 12, 1, 83. [CrossRef] [Google Scholar]
- He Z., Zhou Y., Liu Y. (2020) System dynamics simulation on China’s energy consumption in 2050: Based on the policy scenarios of key industries, J. Nat. Resour. 35, 11, 2696–2707. [Google Scholar]
- Jiang H., Zhang H., Shi X. (2022) Refined production simulation and operation cost evaluation for power system with high proportion of renewable energy, Energy Rep. 8, 108–118. [CrossRef] [Google Scholar]
- Yuan K., et al. (2023) Exploration of low-cost green transition opportunities for China’s power system under dual carbon goals, J. Clean. Prod. 414, 137590. [CrossRef] [Google Scholar]
- Yu Y., et al. (2022) Implications of power industry marketization for sustainable generation portfolios in China, J. Clean. Prod. 378, 134541. [CrossRef] [Google Scholar]
- Li Y.-Y., Li H. (2022) China’s inter-regional embodied carbon emissions: an industrial transfer perspective, Environ. Sci. Pollut. Res. 29, 3, 4062–4075. [CrossRef] [PubMed] [Google Scholar]
- Chi Y., et al. (2022) Driving factors of CO2 emissions in China’s power industry: relative importance analysis based on spatial durbin model, Energies 15, 7, 2631. [CrossRef] [Google Scholar]
- Zhao F., Qian S., Zhao X. (2023) Collaborative governance of carbon reduction in urban agglomerations in the China Yangtze River Economic Belt based on a spatial association network, Ecol. Indic. 154, 110663. [CrossRef] [Google Scholar]
- Wang L., Li K. (2022) Research on renewable energy consumption and emission reduction in power market based on bi-level decision making in China, Energy 260, 125119. [CrossRef] [Google Scholar]
- Wu Y., et al. (2022) Research on greenhouse gas emissions accounting methods in environmental impact assessment of construction projects: a case of thermal power project, J. Environ. Eng. Technol. 12, 6, 1890–1897. [Google Scholar]
- Dong B. (2019) Study on the relationship between carbon emissions, industrial structure and economic growth, Beijing: Northeast University of Finance and Economics. [Google Scholar]
- Zhang L., et al. (2020) Minimizing energy consumption scheduling algorithm of workflows with cost budget constraint on heterogeneous cloud computing systems, IEEE Access 8, 205099–205110. [CrossRef] [Google Scholar]
- Yang Xiaoting S.H.U.J. (2021) Expansion programming of integrated energy system for large industrial user considering the CCHP, Elect. Power Constr. 42, 2, 107–115. [Google Scholar]
- Bui V.-H., et al. (2021) Optimal sizing of energy storage system for operation of wind farms considering grid-code constraints, Energies 14, 17, 5478. [CrossRef] [Google Scholar]
- Dai L., Wang M. (2020) Study on the influence of carbon emission constraints on the performance of thermal power enterprises, Environ. Sci. Pollut. Res. 27, 24, 30875–30884. [CrossRef] [PubMed] [Google Scholar]
- Tang B.-J., et al. (2019) Spatial and temporal uncertainty in the technological pathway towards a low-carbon power industry: a case study of China, J. Clean. Prod. 230, 720–733. [CrossRef] [Google Scholar]
- Yu B., et al. (2021) Research on China’s CO2 emission pathway under carbon neutral target, J. Beijing Inst. Technol. (Soc. Sci. Ed.) 23, 2, 17–24. [Google Scholar]
- Yang Z., et al. (2022) The impact of economic growth, industrial transition, and energy intensity on carbon dioxide emissions in China, Sustainability 14, 9, 4884. [CrossRef] [Google Scholar]
- Borsato B., Plastino A., Merschmann L. (2008) K-NN: estimating an adequate value for parameter K. In 10th international conference on enterprise information systems. Barcelona, Spain. [Google Scholar]
- Brzezińska A.N., Horyń C. (2021) Outliers in Covid 19 data based on rule representation – the analysis of LOF algorithm, Proc. Comput. Sci. 192, 3010–3019. [CrossRef] [Google Scholar]
- Ang B.W., Liu F.L. (2001) A new energy decomposition method: perfect in decomposition and consistent in aggregation, Energy 26, 6, 537–548. [CrossRef] [Google Scholar]
All Tables
The additive decomposition results of each driving factor from 2012 to 2021 (ten thousand tons).
The multiplicative decomposition results of each driving factor from 2012 to 2021.
All Figures
|
Figure 1 Carbon dioxide emissions from different fuels, 1900–2021. |
| In the text | |
|
Figure 2 The construction process of the quantitative analytical model of driving factors for carbon emissions in regional power system. |
| In the text | |
|
Figure 3 Process of data acquisition for carbon emission factors. |
| In the text | |
|
Figure 4 Processing flow of carbon emission-related characterization data based on LOF and KNN. |
| In the text | |
|
Figure 5 Carbon emission calculation based on the LSTM-Attention technology. |
| In the text | |
|
Figure 6 The results of power carbon emissions under different scenarios in Tianjin. |
| In the text | |
Current usage metrics show cumulative count of Article Views (full-text article views including HTML views, PDF and ePub downloads, according to the available data) and Abstracts Views on Vision4Press platform.
Data correspond to usage on the plateform after 2015. The current usage metrics is available 48-96 hours after online publication and is updated daily on week days.
Initial download of the metrics may take a while.