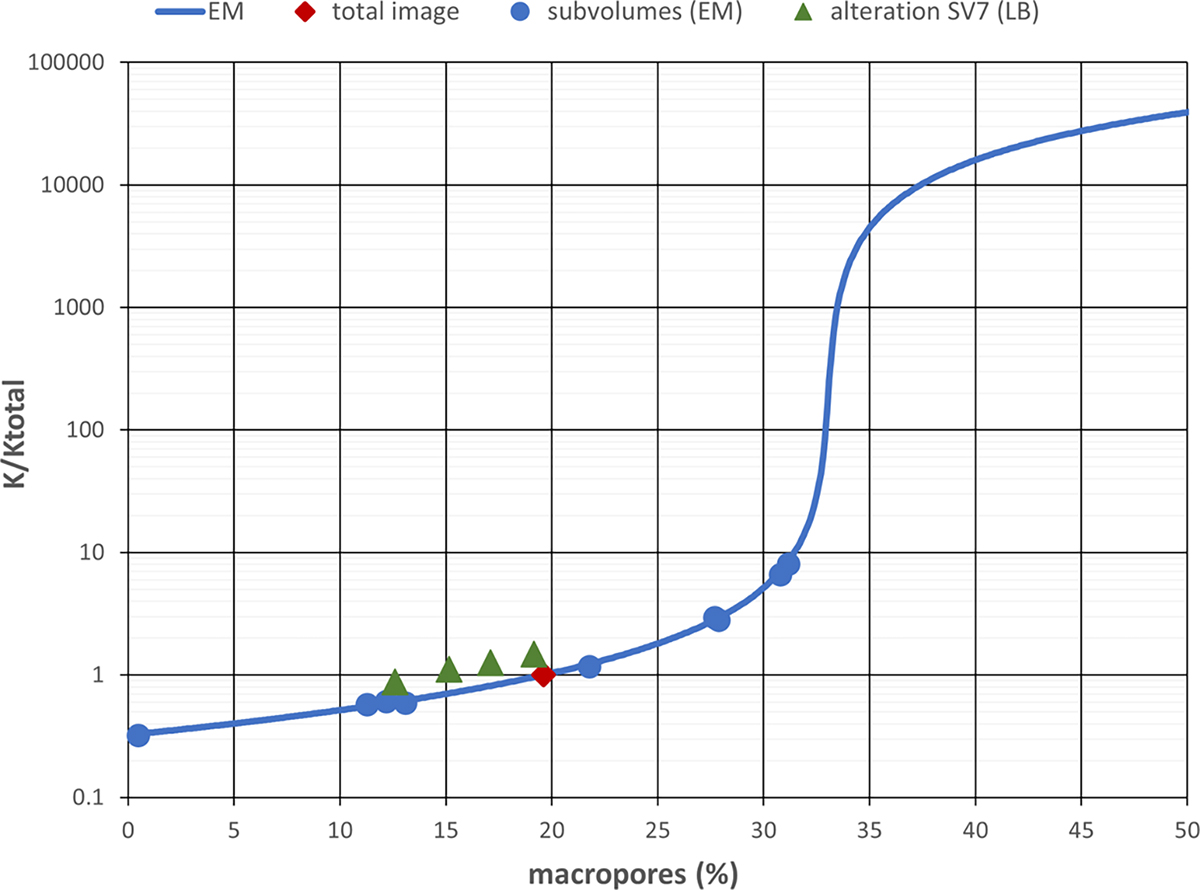
Figure 11

Download original image
Normalized permeability as a function of the macropore fraction. The straight line was obtained by means of the effective medium approach. Blue dots correspond to the permeability computed by effective medium modeling of the sub-volumes and green triangles indicate permeability changes due to alteration obtained by LB. All values are normalized by the permeability value of the total volume (Ktotal).
Current usage metrics show cumulative count of Article Views (full-text article views including HTML views, PDF and ePub downloads, according to the available data) and Abstracts Views on Vision4Press platform.
Data correspond to usage on the plateform after 2015. The current usage metrics is available 48-96 hours after online publication and is updated daily on week days.
Initial download of the metrics may take a while.


