")
")
Open Access
Review
Figure 7
Download original image
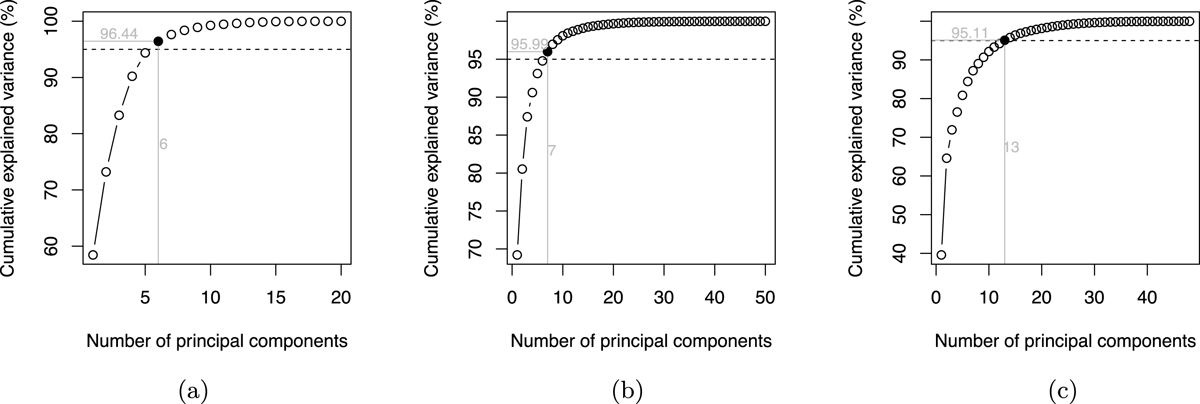
Cumulative explained variance as a function of the selected number of principal components in decreasing order of their explained variance. The horizontal dashed lines represent the threshold of 95% cumulative explained variance. (a) Day-ahead bids, (b) water inflows and (c) day-ahead prices.
Current usage metrics show cumulative count of Article Views (full-text article views including HTML views, PDF and ePub downloads, according to the available data) and Abstracts Views on Vision4Press platform.
Data correspond to usage on the plateform after 2015. The current usage metrics is available 48-96 hours after online publication and is updated daily on week days.
Initial download of the metrics may take a while.