")
")
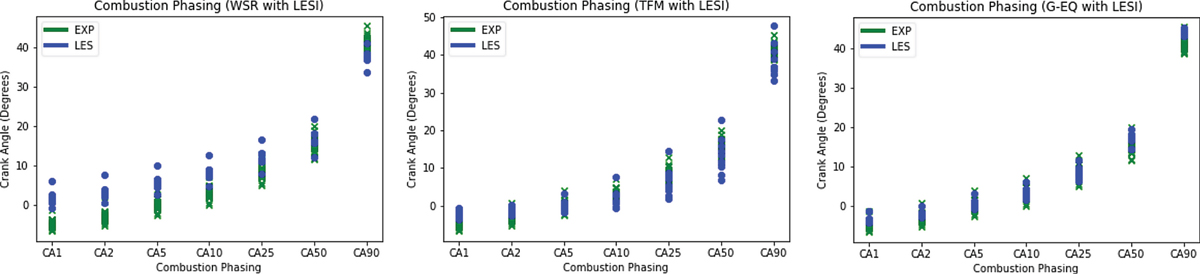
Fig. 19
Download original image
Different combustion phasing metrics for every simulation case (10 consecutive cycles each) compared to the same metrics from 35 experimental cycles. Every scatter point represents one cycle.
Current usage metrics show cumulative count of Article Views (full-text article views including HTML views, PDF and ePub downloads, according to the available data) and Abstracts Views on Vision4Press platform.
Data correspond to usage on the plateform after 2015. The current usage metrics is available 48-96 hours after online publication and is updated daily on week days.
Initial download of the metrics may take a while.