")
")
| Issue |
Sci. Tech. Energ. Transition
Volume 80, 2025
Innovative Strategies and Technologies for Sustainable Renewable Energy and Low-Carbon Development
|
|
|---|---|---|
| Article Number | 23 | |
| Number of page(s) | 16 | |
| DOI | https://doi.org/10.2516/stet/2024097 | |
| Published online | 14 February 2025 | |
Regular Article
Magnetic PDMS@SiO2/Fe3O4 composite friction layer material for enhanced triboelectric nanogenerator output performance
1
School of Navigation and Shipping, Shandong Jiaotong University, 264003 Weihai, P.R. China
2
International Navigation College, Hainan Tropical Ocean University, 572000 Sanya, P.R. China
* Corresponding author: dlmu212@163.com
Received:
3
October
2024
Accepted:
8
November
2024
Triboelectric nanogenerators (TENG) have exhibited remarkable potential in harnessing stochastic low-frequency mechanical energy from oceanic surfaces, attributed to their versatile architectures and capability for extensive deployment. Nonetheless, the relatively modest power output per unit area remains a critical limitation impeding the advancement of TENG technology. Consequently, the innovation of novel material systems and devices to augment the output performance and efficiency of TENG is paramount in achieving effective ocean energy exploitation. In our study, a vertical contact PC-TENG was utilized as an energy harvester, incorporating magnetic nano-oxide particles to bolster the output efficiency of TENG. This investigation represents the inaugural application of SiO2 and Fe3O4 nanoparticles within PDMS negative friction layers. This strategy augments the specific surface area, improving the contact between the friction materials and enhancing charge transfer efficiency. Moreover, the magnetic properties of Fe3O4 facilitate charge separation on the material’s surface, culminating in an elevated voltage output. Comprehensive characterizations were conducted using SEM, FTIR, electrometer, and contact angle meter, while simulations were corroborated with COMSOL Multiphysics field simulation software. The output performance witnessed optimization through the incorporation of Fe3O4, culminating in a peak open-circuit voltage (VOC) of 85.1212 V, a maximum short-circuit current (ISC) of 8.4037 μA, and a maximum transferred charge (QSC) of 0.5638 nC, reflecting enhancements of 28%, 32%, and 27%, respectively, compared to conventional PDMS materials. The peak output power, achieved with an impedance match of 55 MΩ, was recorded at 19.03 mW, marking a 70.8% improvement in output performance. The findings revealed that the contact angle of PDMS@SiO2/Fe3O4 composites reached 100.092°, enhancing hydrophobicity by 8% relative to traditional PDMS materials, thereby rendering it more suitable for humid environments. COMSOL Multiphysics field simulation results further substantiated the viability of the PDMS@SiO2/Fe3O4 composite friction layer material for applications in oceanic wave environments. Ultimately, a rectifier bridge was introduced to convert the alternating current generated by the PC-TENG into a direct current. This research offers a novel paradigm for the utilization of TENG in the realm of marine energy.
Key words: Wave energy / Triboelectric nanogenerator / Composite friction layer / Iron tetroxide
© The Author(s), published by EDP Sciences, 2025
 This is an Open Access article distributed under the terms of the Creative Commons Attribution License (https://creativecommons.org/licenses/by/4.0), which permits unrestricted use, distribution, and reproduction in any medium, provided the original work is properly cited.
Nomenclature
TENG: Triboelectric Nanogenerator
QSC: Quantity of transferred charge
GO-S/PLA: Graphene oxide-surfactant/Polylactic acid
1 Introduction
Triboelectric nanogenerators have captivated considerable interest within the energy sector since their inception by a research team helmed by Fan et al. in 2012 [1]. These innovative devices operate on the principle of synergistically harnessing friction-induced charge generation and electrostatic induction, thereby adeptly transmuting low-frequency, erratic, and irregular mechanical energy into usable power. The domain of friction-based nano-generation technology has witnessed remarkable advancements, particularly in the realm of harvesting low-frequency, stochastically oriented blue energy, such as oceanic wave energy, where it demonstrates exceptional advantages [2].
As a burgeoning method for energy harvesting, TENG has witnessed significant advancements, propelled by the ongoing evolution and refinement of its friction layer materials. However, as these materials reach a state of maturity, augmenting output efficiency merely through the manipulation of the electronegativity differential between them has become increasingly challenging. In response, researchers and scholars have frequently employed the incorporation of nano-conductive materials to facilitate charge transfer, thereby boosting the output efficiency of TENG [3]. Notably, oxide nanoparticles have emerged as one of the most prevalent and efficacious modification agents in contemporary research endeavors. For instance, a 2021 study successfully fabricated a porous graphene oxide-surfactant/polylactic acid nanocomposite thin film [4], characterized by an orderly hexagonal pore arrangement. This was achieved through the chemical modification of graphene oxide (GO) and a polylactic acid solution (PLA) (Fig. 1a). The composite film was subsequently integrated with PDMS to create an innovative TENG device.
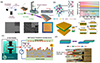 |
Fig. 1 (a) TENG of GO-modified PLA material, (b) TENG of SiO2@PF-modified PDMS material, (c) TENG of TiO2-modified PDMS material, (d) TENG of ZnO-modified PVDF material. |
The apparatus is capable of attaining a peak output power of 0.54 mW/cm2 at a VOC of 200 V and an ISC of 65 μA at a frequency of 5 Hz. This marks an enhancement of 8.6-fold in the output performance of TENG compared to its counterpart with planar surfaces devoid of GO augmentation. Such advancements position it as a viable power source for wearable electronics and self-powered sensors in healthcare biosensing applications. In 2022, Fan et al. [5] demonstrated the blending of perfluoropolyether (PF) and silica as filler materials with polydimethylsiloxane (PDMS), significantly augmenting the dielectric properties of PDMS via the polarization effect (Fig. 1b). This innovation elevated the VOC of TENG by a factor of 12.58, soaring from 67 V to 910 V, while the ISC surged 24-fold from 1 μA to 25 μA, achieving a peak power of 0.25 mW/cm2. A 2023 investigation [6] introduced chemically modified titanium dioxide (TiO2) nanomaterials into the PDMS friction layer, enhancing output performance (Fig. 1c). Attributed to the elevated specific surface area and dielectric constant of TiO2 nanoparticles, alongside their superior catalytic efficacy [7], the resultant TENG device attained a maximum VOC and ISC of 50 V and 0.5 μA, respectively, with an exceptional peak output power of 90 mW/cm2. In 2024, Shee et al. [8] utilized zinc oxide (ZnO) nanorods combined with polyvinylidene fluoride (PVDF) to fabricate an electro-spun ZnO-PVDF composite fibrous membrane, which was integrated with polytetrafluoroethylene (PTFE) to create an innovative TENG device (Fig. 1d). This device generated a VOC of 69 V under a force of 1.6 N, achieving an output power density of 250 μW/cm2, a substantial enhancement compared to unmodified PVDF materials, with an overall performance improvement of 29.86-fold. The aforementioned experimental endeavors and results compellingly illustrate that the incorporation of nano-oxides is a promising strategy to significantly bolster the output performance of TENG devices.
The current friction materials employed in TENG encounter significant challenges, such as suboptimal output performance and constrained environmental adaptability, which impede their practical application. This investigation seeks to explore the triboelectric properties and environmental resilience of PDMS@SiO2/Fe3O4 composite friction layer materials, specifically within the vertical contact-separation modality, through meticulous preparation and evaluation. To augment the output efficacy of the nano-oxide-enhanced triboelectric nanogenerator, PDMS was initially chosen as the negative friction layer material, complemented by copper foil serving as the electrode. The TENG apparatus, configured in a PDMS-Cu vertical-contact separation mode, was initially fabricated by integrating a PMMA plate, foam adhesive, and conductive wire. Nanoscale super-hydrophobicity was conferred upon the SiO2 PDMS matrix, while nanoscale ferric tetroxide (Fe3O4) was amalgamated for optimization purposes. A comprehensive analysis was conducted on the output performance, characterization, and determinants influencing the properties of the synthesized PDMS@SiO2/Fe3O4 composite films [9]. SiO2 is renowned for its exceptional chemical inertness and its formidable resistance to interaction with most conventional inorganic and organic compounds. In alignment with prior research, a composite of PDMS@SiO2 was utilized as a foundational solution [10]. In 2024, Gong et al. [11] elucidated that the magnetization phenomenon can profoundly impact the output of the triboelectric nanogenerator, as derived from the theoretical framework of Maxwell’s equations. The TENG’s output performance is intricately linked to the ambient magnetic field environment. Variations in the magnetic field modulate the distribution and mobility of charges within the TENG, amplify the separation efficacy of positive and negative charges on the friction layer’s surface, refine the charge transmission pathway within the TENG, and curtail charge dissipation and obstruction during transmission, thereby influencing its output performance. Consequently, Fe3O4, a magnetic metal oxide, was selected to be integrated with the pre-prepared PDMS@SiO2 substrate solution to yield a PDMS@SiO2/Fe3O4 composite friction material with enhanced performance attributes. Subsequent empirical investigations revealed that the incorporation of nanoscale SiO2 and Fe3O4 oxide particulates into the PDMS friction layer is pivotal in optimizing the TENG friction layer material [12]. The modified friction layer material was found to elevate the TENG’s output performance, attributed to alterations in surface micro-nanostructures, electrical conductivity, and the efficiency of charge transfer and separation [13]. Given the considerable potential for improvement by integrating magnetic oxides into the TENG friction layer material, the experiment substantiates the promising potential and innovative aspect of the PDMS@SiO2/Fe3O4 composite film, anticipated to inspire novel concepts and trajectories for the further refinement and evolution of triboelectric nanogenerator output performance.
2 Experimentation and characterization
2.1 Experimental materials
In this experiment, SYLGARD-184, a product of Dow Corning, served as the polydimethylsiloxane and its curing agent. The hydrophobic silica employed was of analytical purity, sourced from Tianjin Beichen Reagent Company Limited. Analytical-grade nanometer ferric tetroxide was provided by Tianjin Chemical Co. Ltd. The anhydrous ethanol utilized, also of analytical grade, was supplied by Guangzhou Chemical Reagent Factory. Industrial-grade copper foil was procured from Shengshi Jingxin Company Limited. Deionized water, produced in-house, was used throughout the experimental procedures, and all chemicals were commercially sourced and appropriately applied.
2.2 Preparation process
2.2.1 Preparation of PDMS@SiO2 substrate solution
By the depiction in Figure 2, the initial phase of the procedure involved the amalgamation of hydrophobic SiO2 nanoparticles (22 g) possessing a mass fraction of 50 wt% with polydimethylsiloxane (PDMS) and its corresponding curing agent in a proportion of 10:1 (20 mL/2 mL) within a beaker. The selection of a 50 wt% SiO2 mass fraction was predicated upon findings from antecedent research, which indicated optimal outcomes in augmenting the friction layer’s performance [14]. The constituents were subsequently agitated for a duration of 30 min at an ambient temperature of 25 °C utilizing a magnetic stirrer, thereby ensuring thorough integration and the formation of a homogeneous PDMS@SiO2 solution. In the subsequent phase, this blended solution was subjected to a vacuum mixer operating at 500 revolutions per minute and stirred for an additional 10 min at 25 °C to expel any entrapped air bubbles. The resultant aerated-free solution was then decanted into a storage vessel and hermetically sealed at a reduced temperature for preservation. This methodology culminated in the synthesis of the negative friction layer of the PDMS@SiO2 substrate solution. During the tertiary stage, a copper foil electrode was positioned within a coating apparatus configured to a 60 °C vacuum. The application blade was adjusted to a thickness of 0.3 mm, and a measured quantity of the PDMS@SiO2 substrate solution was dispensed adjacent to the scraper on the copper foil. The coating apparatus was then activated to uniformly apply the substrate solution at a consistent velocity. Subsequently, the coated film was subjected to a drying process at 70 °C for 30 min, thereby culminating in the formation of the PDMS@SiO2 film layer.
 |
Fig. 2 Preparation process of PDMS@SiO2 substrate and friction layer. |
2.2.2 Preparation of PDMS@SiO2/Fe3O4 composite friction layer
As illustrated in Figure 3, a suspension of hydrophobic SiO2 nanoparticles, weighing 22 g with a mass fraction of 50 wt%, was amalgamated with PDMS and its curing agent in a 10:1 ratio within a beaker. This mixture was thoroughly homogenized utilizing a magnetic stirrer for 30 minutes at an ambient temperature of 25 °C, resulting in the formation of the PDMS@SiO2 solution. Subsequently, Fe3O4 nanoparticles, with mass fractions of 1.0 wt%, 2.0 wt%, 3.0 wt%, 4.0 wt%, and 5.0 wt% (corresponding to 0.44 g, 0.90 g, 1.36 g, 1.83 g, and 2.32 g respectively), were meticulously weighed and incorporated into the PDMS@SiO2 solution. The ensuing mixture was adequately stirred for an additional 30 min at 25 °C to yield a homogeneous PDMS@SiO2/Fe3O4 solution. In the subsequent phase, the resultant blend was subjected to a vacuum mixer operating at 500 revolutions per minute and agitated for 10 min at 25 °C to expunge air bubbles and ensure thorough mixing. Thereafter, the aerated-free PDMS@SiO2/Fe3O4 solution was decanted into a dispensing dish. In the fourth phase, a copper foil electrode was positioned on the coater, which was pre-set to a vacuum environment at 60 °C, with the squeegee adjusted to 0.3 mm. The PDMS@SiO2/Fe3O4 solution was then stirred once more with a magnetic mixer for 30 min at 25 °C. Subsequently, this mixture was poured onto the copper foil adjacent to the scraper, and the coater was activated to uniformly and consistently apply the substrate solution at a steady pace. Finally, the coated substrate solution film was placed into a constant temperature oven, desiccated at 70 °C for 30 min, and subsequently retrieved to procure the PDMS@ SiO2/Fe3O4 films with respective mass fractions of 1.0 wt%, 2.0 wt%, 3.0 wt%, 4.0 wt%, and 5.0 wt%.
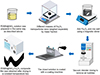 |
Fig. 3 Preparation process of PDMS@SiO2/Fe3O4 friction layer. |
2.2.3 Preparation of PC-TENG generating devices
For the preparation of copper foil electrodes, 400-mesh sandpaper was meticulously selected to ablate the oxide layer on the copper foil’s surface. Subsequently, the copper foil was subjected to an electric roller mill, where it was pressed to achieve a perfectly flat and wrinkle-free state. Following this, the foil underwent a thorough cleansing in an ultrasonic cleaning apparatus, succeeded by rinsing with ethanol and deionized water to meticulously eliminate any residual impurities. The cleaned copper foil was then allowed to dry naturally in an uncontaminated environment. In the subsequent phase, six pieces of copper foil, each measuring 8 cm × 8 cm, were precisely cut for future use. For the second stage, a 10 cm × 10 cm acrylic (PMMA) plate was chosen as the substrate, upon which an 8 cm × 8 cm copper foil was affixed using a foam adhesive of identical dimensions. Pure PDMS, PDMS@SiO2, and PDMS@SiO2/Fe3O4 friction layer materials, each with a thickness of 0.3 mm, were meticulously prepared to be affixed to the copper foil electrodes. These materials, each cut to 8 cm × 8 cm, were attached to the electrodes, and the leads were meticulously connected, culminating in the assembly of the PC-TENG generator.
2.3 Characterization and measurement methods
Scanning Electron Microscopy (SEM) images were meticulously acquired utilizing a Sigma 300 scanning electron microscope, a precision instrument crafted in Germany. The contact angles of water droplets were captured through the employment of an SDC-100 contact angle meter, a device originating from China. The performance metrics of the PC-TENG were meticulously quantified using a Model 6514 electrostatic meter, a product of American innovation. Infrared spectral data were procured via an IR-Affinity-ISWL Fourier transform infrared spectrometer, hailing from Japan. The generation of aqueous undulations was facilitated by the deployment of a WMUC512075 linear motor, engineered in China.
2.4 Simulation experiment process
In the COMSOL Multiphysics simulation framework, the AC/DC module was meticulously selected, and a circular domain with a radius of 100 mm was delineated as the simulation field. Within this domain, two copper foil electrodes, labeled 1 and 2 and illustrated in Figure 4, were defined with precise dimensions of 8 mm × 0.1 mm. The PDMS@SiO2/Fe3O4 composite material was specified with dimensions of 8 mm × 0.3 mm, maintaining intimate contact with electrode 2. The surface charge density was meticulously assigned a value of 4 × 10−⁶ C/m2 on the boundary representing the copper electrode, and −4 × 10−⁶ C/m2 on the boundary corresponding to the PDMS@SiO2/Fe3O4 material. This arrangement ensures the conservation of charge throughout the simulation domain. Prior to conducting the simulation experiments, several assumptions were made to streamline the model and enhance computational efficiency. It was presumed that the interface between the friction layer and the substrate exhibited perfect adhesion, with fixed boundary conditions and no relative slip between the friction surfaces. The densities and dielectric constants of PDMS, SiO2, and Fe3O4 were treated as invariant constants, under the assumption that these properties remain stable throughout the simulation. The triboelectric nanogenerator was considered to operate under steady-state conditions, with transient effects on the output performance being disregarded. Table 1 delineates the fundamental parameter settings of the materials employed in this simulation study. In the simulation and analysis of the PC-TENG, the selection of grid size profoundly influences both the precision of the results and the computational time required. Through a series of simulation trials utilizing various grid sizes, it was observed that the results achieve stability and the computational error remains below 5% when the maximum grid size does not surpass 1 mm. The simulation experiment utilized the finite-element method to discretize the model and its ambient environment, as depicted in Figures 5a–5d. A free triangular mesh with a minimum cell size of 1 × 10⁻² mm and a maximum cell size of 1 mm was employed to partition the mesh.
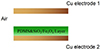 |
Fig. 4 Geometric model of PC-TENG power generation unit. |
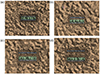 |
Fig. 5 PC-TENG geometric mesh sections. |
Parameter settings for simulation materials.
3 Results and discussion
3.1 Basic working principle and theoretical model of PC-TENG
The triboelectric nanogenerator device, known as PC-TENG, operates via a vertical contact-separation mechanism, with its fundamental operational principle rooted in electrostatic induction and friction initiation phenomena [15]. When an insulating polymer comes into contact with another material under the influence of an external force, electrons migrate across the contact surfaces due to disparities in their electronic structures and their propensity to gain or lose electrons, leading to the surfaces acquiring opposite charges, respectively [16]. Upon the separation of these materials, in accordance with the principles of electrostatic induction, charged particles traverse an external circuit directionally, thus generating an electric current and converting mechanical energy into electrical energy. Figure 6a illustrates the design of the triboelectric nanogenerator for PC-TENG, utilizing a PDMS nanocomposite film and copper as the primary friction layer.
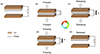 |
Fig. 6 Schematic diagram of PC-TENG energy conversion principle. |
In the initial configuration of PC-TENG, depicted in Figure 6a, the copper electrode and the PDMS nanocomposite membrane remain stationary relative to each other and are uncharged. Due to the absence of a charge differential, electrons do not flow directionally within the circuit. Upon the application of an external force to PC-TENG, the copper electrode makes contact with the PDMS nanocomposite membrane, as illustrated in Figure 6b. Owing to the electronegativity disparity between the electrode and the dielectric material, the copper electrode exhibits a greater tendency to relinquish electrons, thereby assuming a positively charged state. These displaced electrons are transferred to the PDMS nanocomposite membrane, which consequently acquires an equivalent amount of negative charge. The electret within the PDMS effectively retains the charge, minimizing charge dissipation. At this juncture, no current is generated within the circuit. Upon the cessation of the external force, the copper electrode and the PDMS nanocomposite membrane separate due to elastic forces, thereby establishing a potential difference between the upper and lower electrodes (as depicted in Fig. 6c). Influenced by the external electric field, electrons traverse the circuit from bottom to top, thereby generating a current. As the triboelectric nanogenerator reverts to its initial state, the charge on the previously positively charged electrode is neutralized, while the opposite electrode assumes a positively charged state due to electron loss (as shown in Fig. 6d). Upon reapplication of an external force, charge flows from the upper to the lower electrode, generating current in the opposite direction, as depicted in Figure 6e. When the PDMS nanocomposite membrane once again contacts the lower copper electrode, the system returns to the kinetic state, ready for the subsequent cycle of mechanical-to-electrical energy conversion.
The theoretical framework of the PC-TENG is illustrated in Figure 7. Within this model, a frictional layer composed of dielectric material is in intimate contact with one of the electrodes, denoted by a thickness d1 and characterized by a relative permittivity εr. A variable gap x separates the frictional layer, affixed to one electrode, from the opposing electrode, which dynamically adjusts in response to variations in the external driving signal [17]. Under the influence of an external force, the separation between the two materials diminishes until they make contact, thereby acquiring positive and negative charges due to their distinct positions in the triboelectric series and their differing electron affinity, each with a surface charge density σ. It is assumed that the triboelectric charge distributes uniformly across the surface and remains stable for a brief interval. Upon cessation of the external driving force, the two materials maintain a fixed distance x, thereby generating an induced potential difference V between the electrodes. This potential difference facilitates the flow of electrons, with the quantity of charge transferred being represented as Q. Consequently, the electrodes instantaneously accumulate charges of equal magnitude but opposite polarity, such that one electrode accrues a positive charge Q while the other accumulates a negative charge −Q [18].
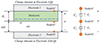 |
Fig. 7 Theoretical model of PC-TENG. |
Under typical experimental conditions, the dimensions of the electrode (denoted as area S) are significantly larger than the separation distance (d + x) between the conductive and dielectric layers, thereby permitting the approximation of the electrode area as effectively infinite [19]. Consequently, it is reasonable to presume a uniform distribution of charge across the electrode surface. The instantaneous power generation capabilities of the PC-TENG can be characterized by an equation known as the V-Q-x relationship, which encompasses three critical parameters: the spacing of the friction layer (x), the potential difference across the electrodes (V), and the charge (Q). The physical model depicted in Figure 7 facilitates the elucidation of the V-Q-x interrelationship through the application of electrodynamic principles. Assuming the electrode area is infinite, it follows that the electron distribution across the electrode surface is homogeneous. The electric field lines are oriented exclusively perpendicular to the plane within the air gap separating the dielectric and conductive materials, as well as within the dielectric medium itself. Utilizing Gauss’s law, we can articulate the corresponding electric field intensity in each region as follows:
Within the dielectric medium: (1)
(1)
The potential difference between the two electrodes is expressed as: (3)
(3)
For the PC-TENG theoretical model, the V-Q-x relationship is found: (4)
(4)
In equations (1)–(4), E1 and Eair denote the electric field intensities within the dielectric medium and the air gap, respectively. The symbols εr and ε0 signify the relative permittivity of the triboelectric layer material and that of air, correspondingly. The parameter d1 represents the thickness of the friction layer material, while Q denotes the quantity of charge transferred. S refers to the electrode area, σ to the charge density, x to the predetermined separation between the frictional interfaces, and V to the potential difference across the electrodes.
At this juncture, the VOC, QSC, and the capacitance C of the triboelectric nanogenerator can be derived as follows: The effective thickness constant d0 is characterized as the quotient of the dielectric material’s thickness to its relative permittivity. (5)
(5)
 (6)
(6)
 (7)
(7)
3.2 Output performance of PC-TENG
Experiments were meticulously conducted to investigate the negative friction layer materials in PC-TENG-generating devices. The study involved the preparation of films measuring 8 cm × 8 cm with a thickness of 0.02 cm, comprising pure PDMS, a PDMS@SiO2 composite with a SiO2 mass fraction of 50 wt%, and PDMS@SiO2/Fe3O4 composite films containing Fe3O4 at mass fractions of 1.0 wt%, 2.0 wt%, 3.0 wt%, 4.0 wt%, and 5.0 wt%, respectively. Figures 8a–8c presents the experimental results for VOC, ISC, and QSC as measured by an electrostatic meter. These measurements were taken during the separation of PDMS and PDMS@ SiO2 substrate materials from their mutual contact with Cu material, under a controlled simulated ocean wave frequency of 1.0 Hz. Upon the integration of a 50 wt% SiO2 mass fraction, the VOC of the friction pair ascended from 66.2041 V to 75.0876 V, marking an enhancement of 13.4%. Concurrently, the ISC rose from 6.3644 μA to 7.0184 μA, an increase of 10.3%, and the QSC escalated from 0.4445 nC to 0.4942 nC, reflecting an enhancement of 11.2%.
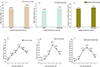 |
Fig. 8 (a) PDMS@SiO2 substrate VOC, (b) PDMS@SiO2 substrate ISC, (c) PDMS@SiO2 substrate QSC, (d) PDMS@SiO2/Fe3O4 composite membrane VOC, (e) PDMS@SiO2/Fe3O4 composite membrane ISC, (f) PDMS@SiO2/Fe3O4 composite membrane QSC. |
Figures 8d–8f delineate the experimental data for VOC, ISC, and QSC across various mass fractions of PDMS@SiO2/Fe3O4 composite membranes, also at a fixed simulated ocean wave frequency of 1.0 Hz. These measurements were conducted following the separation of the materials from their mutual contact with Cu. The data reveal a characteristic trend where the output performance of the composite friction layer initially increases and subsequently decreases with the augmentation of the nano Fe3O4 particle mass fraction. Specifically, the optimal output performance was observed at a Fe3O4 mass fraction of 3 wt%, where VOC, ISC, and QSC reached their zenith values of 85.1212 V, 8.4037 μA, and 0.5638 nC, respectively. These figures signify enhancements of 13.4%, 19.1%, and 11.8% compared to the PDMS@SiO2 base material. However, surpassing a 3 wt% mass fraction of Fe3O4 results in a diminution of the friction pairs’ output performance. Consequently, based on these empirical findings, the PDMS@SiO2/Fe3O4 composite membrane with a 3.0 wt% Fe3O4 mass fraction was selected for further investigation.
3.3 PC-TENG characterization and morphological testing
In light of the environmental conditions where PC-TENG operates, namely oceanic waves and high humidity, it is imperative that the TENG friction layer material possesses superior hydrophobic characteristics. Enhanced hydrophobicity augments the performance of TENG devices in such moist conditions by minimizing water adhesion, thus mitigating energy dissipation. Within marine environments, materials exhibiting robust hydrophobicity can maintain elevated energy conversion efficiency despite the incessant action of waves, and they alleviate the degradation of electrical performance due to water immersion [20]. The contact angle of water droplets serves as a critical metric for assessing the hydrophilic and hydrophobic attributes of solid materials. Consequently, a contact angle meter, equipped with a high-speed camera, was employed to capture the interaction of water droplets with the material’s surface and to compute the contact angle between the droplet and the solid substrate. Figures 9a–9c present the data on water droplet contact angles for PDMS membrane, 50 wt% PDMS@ SiO2 composite membrane, and 3.0 wt% PDMS@SiO2/Fe3O4 composite membrane (these materials were sourced from waste materials post-preparation and cutting). The contact angles for the three friction layer film materials were recorded as 92.539°, 95.506°, and 100.092°, respectively. Relative to the pristine PDMS material, the inclusion of SiO2 enhanced the hydrophobicity of the PDMS material by 3.2%. Furthermore, compared to the PDMS@ SiO2 substrate, the integration of 3.0 wt% Fe3O4 nanomaterial into the composite membrane augmented hydrophobicity by 4.8%. The 3.0 wt% PDMS@SiO2/Fe3O4 composite membrane exhibits heightened adaptability to humid environments.
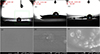 |
Fig. 9 (a) PDMS water droplet contact angle, (b) PDMS@SiO2 water droplet contact angle, (c) PDMS@SiO2/Fe3O4 water droplet contact angle, (d) PDMS scanning electron microscope image, (e) 50 wt% PDMS@SiO2 scanning electron microscope image, (f) 3.0 wt% PDMS@SiO2/Fe3O4 scanning electron microscope image. |
Microscopic imaging of the PC-TENG friction layer’s sample surface was conducted utilizing the ultra-high magnification capabilities of a Scanning Electron Microscope (SEM) to examine the microstructural characteristics of the three PC-TENG friction layer samples. The influence of the triboelectric nanogenerator on the output performance of PC-TENG was evaluated using the output performance index formula specific to the triboelectric nanogenerator. Figures 9d–9f illustrate the SEM images of the three composite friction layer materials: PDMS, 50 wt% PDMS@SiO2, and 3.0 wt% PDMS@SiO2/Fe3O4, at a microscopic scale of 100 nm. Notably, the surface of the pure PDMS membrane, depicted in Figure 9d, appears relatively smooth, devoid of particle doping or bubble formation. In Figure 9e, with the incorporation of 50 wt% nanosized SiO2, it is evident that SiO2 particles are uniformly dispersed across the material’s surface, resulting in increased surface roughness and specific surface area. In Figure 9f, the nanocomposite membrane with an addition of 3.0 wt% Fe3O4 nanoparticles also exhibits a uniform distribution of SiO2 particles on its surface, contributing to its rough texture. The presence of numerous black granular materials signifies the doping of Fe3O4 nanoparticles on the material’s surface. This process amplifies the film’s specific surface area, and the resulting surface properties enhance the contact efficacy between the triboelectric materials, thereby bolstering the electrical output performance of the friction layer material.
To conduct an in-depth exploration of the influence exerted by the incorporation of SiO2 and Fe3O4 nanoparticles on the chemical composition of PC-TENG, we subjected three composite friction layer materials – specifically, PDMS, 50 wt% PDMS@SiO2, and 3.0 wt% PDMS@ SiO2/ Fe3O4 – to Fourier-Transform Infrared (FTIR) spectroscopy. Figure 10a presents the infrared spectral analysis results of these materials. As illustrated in Figure 10b, based on the normalized data from Figure 10a, the fundamental trajectory of the infrared spectra for the composite friction layers, augmented with SiO2 and Fe3O4, exhibited no substantial deviations compared to the PDMS friction layer materials. This observation suggests that the chemical architecture of the composite friction layers remains intact. Concurrently, Figure 10a reveals a decrease in transmittance for the composite friction layer upon the incorporation of SiO2 particles on its surface, relative to the PDMS friction layer. Additionally, the surface blackness of the friction layer markedly diminishes with the addition of Fe3O4 particles, corroborating the empirical findings. In comparison to the pristine PDMS friction layer material depicted in Figure 10b, the characteristic absorption peaks of the PDMS@SiO2 and PDMS@SiO2/Fe3O4 composite friction layer materials at 3433 cm−1 are attenuated and eventually vanish. This indicates the formation of hydrogen bonds between the added SiO2 and Fe3O4 nanoparticles and the –OH groups in PDMS, resulting in a notable decrease in -OH content and an enhancement in the material’s hydrophobicity, aligning with the water droplet contact angle test outcomes. Further scrutiny of Figure 10b reveals an intensification of absorption peaks for the PDMS@SiO2 and PDMS@SiO2/Fe3O4 composite friction layers within the 1100 cm−1 to 1200–1250 cm−1 range. The absorption peak in this domain primarily arises from the stretching vibrations of the Si–O bond [21], substantiating the incorporation of SiO2 material. Moreover, an absorption peak emerges at 584 cm−1 in the PDMS@SiO2/Fe3O4 spectral curve, predominantly attributable to the stretching vibrations of the Fe–O bond [22], thereby confirming the addition of Fe3O4 material. The characterization and morphological analysis of PC-TENG reveal that the PDMS@SiO2/Fe3O4 composite friction layer material exhibits exceptional hydrophobicity, wear resistance, and other desirable properties, further affirming the advantages and practicality of this composite friction layer material.
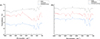 |
Fig. 10 (a) PDMS@SiO2/Fe3O4 IR spectral profile, (b) PDMS@SiO2/Fe3O4 IR spectral profile (leveled). |
3.4 Effect of ocean wave factors on PC-TENG output performance
The aforementioned experiments established that the negative friction layer material of the PC-TENG was a PDMS@SiO2/Fe3O4 composite, optimized with 3.0 wt% Fe3O4 for enhanced output performance, hydrophobicity, and other properties. Upon the fabrication of the PC-TENG generator device, the influence of oceanic wave parameters, specifically wave height, and frequency, on the output performance of PC-TENG was meticulously examined using experimental apparatuses such as a linear motor and an electrostatic meter.
3.4.1 Wave frequency
Frequency serves as a pivotal parameter in wave characterization, encapsulating the rate at which a wave oscillates, and is among the most critical indicators of wave magnitude. It can be quantified through the following formula: (8)where f is the frequency of the wave (Hz); V is the speed of the wave (m/s); and λ is the wavelength of the wave (m).
By integrating wave speed, wavelength, and the aforementioned formula, it is discerned that natural wave frequencies predominantly manifest as low frequencies, typically below 2 Hz. Consequently, the experiment emulated wave frequencies of 0.4 Hz, 0.6 Hz, 0.8 Hz, 1.0 Hz, 1.2 Hz, 1.4 Hz, 1.6 Hz, and 1.8 Hz via the linear motor, maintaining a constant wave height of 50 mm and a wavelength of 100 mm. The experimental assessments were conducted under controlled conditions using an electrostatic agent. Figures 11a–11c illustrates the variations in VOC, ISC, and QSC of the PC-TENG as a function of wave frequency. The data depicted reveal that an escalation in driving frequency generally augments the power generation performance of the PC-TENG. Specifically, the VOC ascends from 70.32 V to 95.89 V, ISC elevates from 4.61 μA to 9.83 μA, and QSC amplifies from 3.42 nC to 30.74 nC as the frequency rises from 0.4 Hz to 1.8 Hz. This phenomenon occurs because, with a constant wave amplitude, an increase in wave frequency results in heightened mechanical energy of the PC-TENG. Consequently, the contact force between the power generation units intensifies, ensuring comprehensive contact of the friction layer, and thereby enhancing the overall output performance of the PC-TENG.
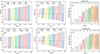 |
Fig. 11 (a) VOC of PC-TENG at different frequencies, (b) ISC of PC-TENG at different frequencies, (c) QSC of PC-TENG at different frequencies, (d) VOC of PC-TENG at different wavelengths, (e) ISC of PC-TENG at different wavelengths, (f) QSC of PC-TENG at different wavelengths amount. |
3.4.2 Wavelength
Wavelength, defined as the horizontal distance between two successive wave crests or troughs, serves as a pivotal parameter in the characterization of wave dynamics. It encapsulates the intensity of wave oscillations, with the wave’s energy intrinsically linked to its wavelength. Moreover, wavelength emerges as an essential metric in the realm of wave data analysis.
In the conducted experiment, the wavelength of simulated waves was modulated via a linear motor. The performance metrics of the PC-TENG were scrutinized at discrete wavelengths of 20 mm, 35 mm, 50 mm, 65 mm, 80 mm, 95 mm, 110 mm, and 125 mm while maintaining a constant frequency of 1.0 Hz and a fixed wave height of 50 mm. The relationship between the wavelength and the PC-TENG’s output parameters, namely VOC, ISC, and QSC, is depicted in Figures 11d–11f. A discernible trend emerges, illustrating that the PC-TENG’s output performance amplifies with the augmentation of the external driving wavelength. Specifically, the VOC escalates from 63.05 V to 90.01 V, the ISC ascends from 4.15 μA to 10.21 μA, and the QSC burgeons from 3.67 nC to 28.51 nC. This phenomenon can be attributed to the fact that, with a constant wave frequency, an extension in wavelength enhances the mechanical energy imparted to the PC-TENG. Consequently, this elevation in mechanical energy bolsters the contact force between the power generation units, facilitating a more comprehensive interaction with the friction layer, and thereby augmenting the overall output performance of the PC-TENG.
3.5 COMSOL power generation unit simulation verification
To elucidate the operational principles and power generation capabilities of the PC-TENG with greater clarity, the electrical output characteristics and potential distribution of the PC-TENG power generation unit were meticulously simulated using COMSOL Multiphysics software. This simulation was designed to explore and validate the previously discussed test results regarding the output performance of the PC-TENG. The simulation depicted the potential distribution during the operation of the Cu electrode and the PDMS@SiO2/Fe3O4 composite, as illustrated in Figures 12a–12d.
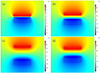 |
Fig. 12 Simulated potential distribution of PC-TENG. (a) The comprehensive contact between the copper electrode and the PDMS, a transfer of charge is initiated; (b) As the two entities commence their separation, an electromotive force is engendered between the superior and inferior electrodes; (c) At the juncture when the separation distance attains its zenith, the potential difference similarly reaches its pinnacle; (d) As the separation distance incrementally diminishes from its peak, the potential difference correspondingly wanes. |
To assess the influence of wave frequency and wavelength on the output performance of PC-TENG experiments, a series of tests employed varying ocean wave frequencies to demonstrate the impact of PC-TENG on the collision velocity between the wave-driven friction layer materials. Utilizing the COMSOL steady-state solver, based on equation (8), the frequencies of 0.4 Hz, 0.6 Hz, 0.8 Hz, 1.0 Hz, 1.2 Hz, 1.4 Hz, 1.6 Hz, and 1.8 Hz were introduced. Under the influence of waves with a wavelength of 100 mm, the moving velocity V1 of the PC-TENG friction layer material was determined to be 0.4 m/s, 0.6 m/s, 0.8 m/s, 1.0 m/s, 1.2 m/s, 1.4 m/s, 1.6 m/s, and 1.8 m/s, respectively. Similarly, the experiment translated the effects of ocean waves with various wavelengths on the PC-TENG into the collision velocities between the wave-driven friction layer materials. The corresponding moving speeds of the composite materials, under the action of 1.0 Hz waves, for wavelengths of 20 mm, 35 mm, 50 mm, 65 mm, 80 mm, 95 mm, 110 mm, and 125 mm, were 0.2 m/s, 0.35 m/s, 0.5 m/s, 0.65 m/s, 0.8 m/s, 0.95 m/s, 1.1 m/s, and 1.25 m/s, respectively. To investigate the correlation between potential difference and collision velocity of the materials, the potential distribution of the Cu electrode and PDMS@SiO2/Fe3O4 composites at various moving velocities was simulated and plotted (Figs. 13a and 13b). This represents the variation curve of PC-TENG potential with ocean wave frequency, indicating a potential increase from 65 V to 100 V. The potential distribution of the PC-TENG is also depicted in the graph in Figure 13b, which represents the variation curve of PC-TENG potential with wave wavelength, corresponding to a potential increase from 60 V to 86.25 V. As evident from the curve in Figure 9, with the augmentation of the moving speed between the materials, the potential difference between their surfaces also escalates, exhibiting a linearly increasing trend with the rising moving speed, which aligns with the aforementioned experimental results both in magnitude and overall trend.
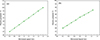 |
Fig. 13 (a) Plot of potential vs. speed of friction layer movement (frequency) (b) Plot of potential vs. speed of friction layer movement (wavelength). |
3.6 Equivalent circuit and output power test of PC-TENG
The operational mechanism of the PC-TENG is predicated on the synergistic interplay between contact electrification and electrostatic induction. In this intricate process, the voltage (VPC-TENG) emerges from the concerted influence of polarized charges, which are generated during the contact electrification between two electrodes, and the transfer charges (Q) arising from electrostatic induction. The voltage component attributed to the polarized frictional charge is denoted as VOC(x) and fluctuates with the separation distance x. Moreover, the term Q/C(x), where C(x) signifies the capacitance between the electrodes, represents the voltage component induced by the transfer charges [23, 24]. Consequently, the total potential difference between the two electrodes can be delineated by the following expression: (9)
(9)
This serves as the governing equation for PC-TENG.
When the PC-TENG is in a short-circuit state, its potential difference, VPC-TENG, vanishes, i.e., it becomes zero. At this juncture, the function of the QSC is to entirely neutralize the voltage disparity induced by the polarized friction charge, leading to the subsequent equation: (10)
(10)
From this, it is inferred that the fundamental relationship between QSC, C(x), and VOC is: (11)
(11)
Thus, the equivalent circuit model of the PC-TENG generator device is composed of an ideal voltage source (VOC(x)), symbolizing its VOC, and a variable capacitance (C(x)), indicative of its intrinsic capacitance [25], arranged in series, as depicted in Figure 14a. Typically, the internal resistance of the PC-TENG is predominantly influenced by the intrinsic capacitance, and this triboelectric nanogenerator exhibits a high internal resistance, approaching infinity, which can be considered a high-impedance charge source within the conventional motion frequency spectrum.
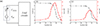 |
Fig. 14 (a) Equivalent circuit model of PC-TENG, (b) external load versus optimized PC-TENG output current and power, (c) external load versus pre-optimized PC-TENG output current and power. |
Building on the equivalent circuit of PC-TENG, the correlation between its external load and output power is scrutinized. The output power equation of PC-TENG is derived from Ohm’s law equation [26]: (12)
(12)
The expansion of equation (12) is calculated: (13)
(13)
At this juncture, the internal resistance of PC-TENG, RPC-TENG, assumes a constant value. If PPC-TENG is to be maximized: (14)
(14)
 (15)
(15)
Here, PPC-TENG denotes the output power of PC-TENG, UPC-TENG is the voltage across PC-TENG, RPC-TENG represents the internal resistance of PC-TENG, Rout is the external resistance in the circuit, and Pmax signifies the maximum output power. Analyzing the above formula reveals that the maximum output power of PC-TENG is attained when the resistance of the external resistor equates to the internal resistance.
For the investigation, the controlled external operational conditions are set at a frequency of 1.8 Hz and a wavelength of 125 mm. The friction layer’s width is 80 mm, and its thickness is 0.3 mm. As illustrated in Figure 14b, the output power initially ascends and subsequently declines as the external load resistance escalates, whereas the ISC gradually diminishes before stabilizing. When the external load resistance is less than 10 MΩ, the power increment is sluggish due to the external load being significantly smaller than the internal resistance of the triboelectric nanogenerator. As the load resistance continues to augment, according to Ohm’s law, the current gradually decreases, and since the current is squared in its dominant role, the power will decrease again after reaching its peak value. Test data reveal that the PC-TENG, optimized with hydrophobic SiO2 and nano Fe3O4 TENG with a matching impedance of 55 MΩ, achieves a maximum output power of 19.03 mW. Under identical conditions, the pre-optimization PC-TENG exhibits a maximum output power with a matching impedance of 55 MΩ, reaching 11.14 mW. The overall output performance of the PC-TENG is enhanced by 70.8%.
3.7 AC/DC Conversion for PC-TENG
Based on the operational principles of the PC-TENG, it generates an Alternating Current (AC). In practical applications, it is imperative to convert AC to Direct Current (DC), typically achieved by integrating rectifier circuits with the AC output produced by TENG [27]. During the rectification process, a rectifier diode bridge is essential for connecting to the triboelectric nanogenerator device. Figure 15a illustrates a schematic that incorporates an external rectifier circuit with the triboelectric nanogenerator, rectifier circuit, capacitor and LED. Figure 15b compares the output current before and after rectification. Without the rectifier circuit, the output current exhibits a sinusoidal waveform [28]. However, following the application of the rectifier bridge, the currents become entirely positive. A comparison of the positive peak values of the current in both scenarios reveals that the output current post-rectification is diminished compared to its pre-rectification state. This reduction is attributable to the load resistance introduced by the rectifier bridge, which diminishes the magnitude of the output current. Moreover, the rectifier bridge facilitates the more convenient and efficient utilization of the converted electricity from ocean wave energy harnessed by the PC-TENG.
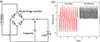 |
Fig. 15 (a) Schematic diagram of conversion circuit, (b) output current before and after conversion. |
4 Conclusion
Experimentally, PDMS@SiO2/Fe3O4 composite friction layer materials were synthesized by incorporating magnetic nanoparticles Fe3O4 with a mass fraction of 3 wt% (1.36 g/45.36 g) into the substrate, using 50 wt% (22 g/44 g) of PDMS@SiO2 as the base material for the PC-TENG friction layer in a vertical-contact separation mode. The output performance metrics of VOC, ISC, and QSC are enhanced from 66.2041 V, 6.3644 μA, and 0.4445 nC to 85.1212 V, 8.4037 μA, and 0.5638 nC, reflecting improvements of 28%, 32%, and 27%, respectively. The maximum output power reaches 19.03 mW at an external load resistance of 55 MΩ, marking an overall output performance enhancement of 70.8%. The hydrophilicity of the PDMS@SiO2/Fe3O4 composite friction layer was assessed via the water droplet contact angle, which increased from 92.539° to 100.092°. This 8% increase in hydrophobicity renders it more apt for ocean wave energy collection. The influence of wave parameters on the output characteristics of PC-TENG is experimentally established, demonstrating that VOC, ISC, and QSC of the PC-TENG device rise with increasing wave frequency and wavelength, followed by steady-state computational analyses to validate the experimental findings using the finite element simulation software COMSOL Multiphysics. Finally, the equivalent circuit of PC-TENG is scrutinized, and a rectifier bridge is introduced to convert the AC power generated by PC-TENG into DC power. Future investigations should explore additional magnetic and conductive additives to further enhance the performance of TENG devices, as these additives are pivotal for improving charge separation and transfer efficiency. Moreover, PC-TENG remains distant from commercialization and large-scale deployment, necessitating substantial optimization and advancements in various domains, including materials, structure, and manufacturing processes. By optimizing material composition and device design, we can markedly augment energy conversion efficiency and stability, thereby promoting the application of TENG technology across diverse environments and contributing positively to the utilization of renewable energy.
Funding
This work was funded by the Hainan Tropical Ocean College Talent Research Launch Project (RHDRC202310); National Natural Science Foundation of China (51609131); Introduction and Education Plan of Young Creative Talents in Universities of Shandong Province (500076).
References
- Fan F.R., Tian Z.Q., Wang Z.L. (2012) Flexible triboelectric generator, Nano Energy 1, 2, 328–334. [CrossRef] [Google Scholar]
- Wang C.J, Meng F., Fu Q., Fan C.H., Cui L. (2022) Research on wave energy harvesting technology of annular triboelectric nanogenerator based on multi-electrode structure, Micromachines 13, 10, 1619–1619. [CrossRef] [PubMed] [Google Scholar]
- Zheng Y., Li X., Zheng M.L., Zi Y.L., Cheng S.B., Cui H.Z., Li X.Y. (2023) MoSe2 enhanced raindrop triboelectric nanogenerators and its energy conversion analysis, Adv. Funct. Mater. 34, 1–10. [Google Scholar]
- Mai N.C., Ha T.L., Phu D.H., Truong T.H., Dinh M.T.N., La T.T.H., Bui V. (2021) Surface patterning of GO-S/PLA nanocomposite with the assistance of an ionic surfactant for high-performance triboelectric nanogenerator, Int. J. Energy Res. 45, 14, 20047–20056. [CrossRef] [Google Scholar]
- Fan B.B., Liu G.X., Fu X.P., Wang Z. (2022) Composite film with hollow hierarchical silica/perfluoropolyether filler and surface etching for performance enhanced triboelectric Nanogenerators, Chem. Eng. J. 446, 3–13. [Google Scholar]
- Nassim R., Somayeh F., Masoumeh K.K., Leyla S., Azam I., Sadegh S., Raheleh M., Daryoosh V. (2023) High-performance flexible and stretchable self-powered surface engineered PDMS-TiO2 nanocomposite-based humidity sensors driven by triboelectric nanogenerator with full sensing range, Sens. Actuat. B Chem. 1, 378–388. [Google Scholar]
- Du Y., Zhang S.J., Cheng Z.X. (2024) Flexocatalysis of nanoscale titanium dioxide, Nano Energy 127, 109731–109741. [CrossRef] [Google Scholar]
- Shee C., Banerjee S., Bairagi S. (2024) A critical review on polyvinylidene fluoride (PVDF)/zinc oxide (ZnO)-based piezoelectric and triboelectric nanogenerators, J. Phys. Energy 6, 3–13. [Google Scholar]
- Kannan R.T, Roji S.S.S. (2023) Performance and emission characteristics of salviniaceae filiculoides aquatic fern oil and SiO2 nano additive biodiesel in Cl engine, Sci. Technol. Energy Transit. 78, 4, 10–20. [CrossRef] [Google Scholar]
- He Z.K., Ma M., Xu X.C., Wang J.Y., Chen F. (2012) Fabrication of superhydro-phobic coating via a facile and versatile method based onnanoparticle aggregates, Appl. Surf. Sci. 258, 7, 2544–2550. [CrossRef] [Google Scholar]
- Gong S.K., Wang X.W., Tang B.Z., Xiong Z.Y., Qi S., Chen J., Yu P., Guo H.Y. (2024) Achieving Self-reinforcing triboelectric-electromagnetic hybrid nanogenerator by magnetocaloric and magnetization effects of gadolinium, Adv. Mater. (Deerfield Beach, Fla.) 36, 26, 2402824–2402824. [CrossRef] [Google Scholar]
- Hao Z., Yun T., Zhe C. (2024) Voltage control method for multi-energy system based on the coupling of renewable energy hydrogen production and storage, Sci. Technol. Energy Trans. 79, 60–71. [Google Scholar]
- Hussain M.D, Dudem B., Kutsarov D.I., Silva S.R.P. (2024) Exploring charge regeneration effect in interdigitated array electrodes-based TENGs for a more than 100-fold enhanced power density, Nano Energy, 130, 110–112. [Google Scholar]
- Zeliha M.A., Zeynep K., Eyup Y. (2023) One material-opposite triboelectrification: molecular engineering regulated triboelectrification on silica surface to enhance TENG efficiency, Molecules (Basel, Switzerland) 28, 15, 56–62. [Google Scholar]
- He Y., Tian J., Peng W.B., Huang D.Y., Li F.P., He Y.N. (2023) On the contact electrification mechanism in semiconductor semiconductor case by vertical contact-separation triboelectric nanogenerator, Nanotechnology 34, 29, 5401–5411. [Google Scholar]
- Tiwari M., Mishra D. (2024) Self-powered water-splitting using triboelectric nano-generators for green hydrogen production: Recent advancements and perspective, Int. J. Hydrogen Energy 76, 234–246. [CrossRef] [Google Scholar]
- Guo X., Shao J.J., Willatzen M., Yang Y., Wang Z.L. (2022) Theoretical model and optimal output of a cylindrical triboelectric nanogenerator, Nano Energy 92, 106, 762–772. [Google Scholar]
- Fan C.M., Shao J.J., Guo X., Willatzen M., Wang Z.L. (2023) Field-circuit coupling model of triboelectric Nanogenerators, Mater. Today Phys. 35, 101–124. [Google Scholar]
- Zhang Q., Guo H.Y., Shen F. (2023) A predictive method for impedance estimation of triboelectric nanogenerators based on a gated recurrent unit model, Nano Energy 124, 109, 458. [Google Scholar]
- Kamaruzaman D., Mustakim M.S.N., Subki A.R.S.A. (2024) Polystyrene waste-ZnO nanocomposite film for energy harvesting via hydrophobic triboelectric nanogenerator: Transforming waste into energy, Mater. Today Sustain. 26, 100, 726. [Google Scholar]
- Ramenskaya L.M., Kudryakova N.O., Grishina E.P. (2023) Conformation features and interaction of pyrrolidinium-based ionic liquids immobilized with silicon dioxide: Infrared spectroscopy, J. Molecular Liq. 382, 122, 25–35. [Google Scholar]
- Guilherme L.T., Roithová J. (2022) Unmasking the Iron-Oxo Bond of the [(Ligand)Fe-OIAr]2+/+ Complexes, J. Am. Society Mass Spectrom. 33, 9, 1636–1643. [CrossRef] [PubMed] [Google Scholar]
- Jeong J., Ko J., Kim J., Lee J. (2024) Asymmetric voltage amplification using a capacitive load energy management circuit in a triboelectric nanogenerator, Discover Nano 19, 1–10. [CrossRef] [Google Scholar]
- Yan W.J., Liu Y., Cao L.N.Y. (2022) Asymmetric-internal-capacitance-induced charge aggregation for the hot-surface triboelectric nanogenerator, ACS Appl. Mater. Interf. 14, 51, 56827–56835. [CrossRef] [PubMed] [Google Scholar]
- Liang Y.X., Ma Z.R., Yu S.T. (2022) Preparation and property analysis of solid carbonate-oxide composite materials for an electrolyte used in low-temperature solid oxide fuel cell, Sci. Technol. Energy Trans. 77, 4–12. [Google Scholar]
- Kumar S, Jha R.K, Sharma P, Goswami A (2024) Design and development of a horizontal contact separated (HCS) test setup for measuring the performance of triboelectric nanogenerator for sustainable energy harvesting application, Rev. Sci. Instrum. 95, 3, 035002–035015. [CrossRef] [PubMed] [Google Scholar]
- Tilahun D.A., Muneer V., Avik B. (2022) Decentralized control of islanding/grid-connected hybrid DC/AC microgrid using interlinking converters, Sci. Technol. Energy Trans. 77, 22–32. [Google Scholar]
- Wang J.Q., Bao G.W., Xie S.X., Chen X.W. (2023) A paradigm-shift self-powered optical sensing system enabled by the rotation driven instantaneous discharging triboelectric nanogenerator (RDID-TENG), Nano Energy 115, 108, 732–742. [Google Scholar]
All Tables
All Figures
|
Fig. 1 (a) TENG of GO-modified PLA material, (b) TENG of SiO2@PF-modified PDMS material, (c) TENG of TiO2-modified PDMS material, (d) TENG of ZnO-modified PVDF material. |
| In the text | |
|
Fig. 2 Preparation process of PDMS@SiO2 substrate and friction layer. |
| In the text | |
|
Fig. 3 Preparation process of PDMS@SiO2/Fe3O4 friction layer. |
| In the text | |
|
Fig. 4 Geometric model of PC-TENG power generation unit. |
| In the text | |
|
Fig. 5 PC-TENG geometric mesh sections. |
| In the text | |
|
Fig. 6 Schematic diagram of PC-TENG energy conversion principle. |
| In the text | |
|
Fig. 7 Theoretical model of PC-TENG. |
| In the text | |
|
Fig. 8 (a) PDMS@SiO2 substrate VOC, (b) PDMS@SiO2 substrate ISC, (c) PDMS@SiO2 substrate QSC, (d) PDMS@SiO2/Fe3O4 composite membrane VOC, (e) PDMS@SiO2/Fe3O4 composite membrane ISC, (f) PDMS@SiO2/Fe3O4 composite membrane QSC. |
| In the text | |
|
Fig. 9 (a) PDMS water droplet contact angle, (b) PDMS@SiO2 water droplet contact angle, (c) PDMS@SiO2/Fe3O4 water droplet contact angle, (d) PDMS scanning electron microscope image, (e) 50 wt% PDMS@SiO2 scanning electron microscope image, (f) 3.0 wt% PDMS@SiO2/Fe3O4 scanning electron microscope image. |
| In the text | |
|
Fig. 10 (a) PDMS@SiO2/Fe3O4 IR spectral profile, (b) PDMS@SiO2/Fe3O4 IR spectral profile (leveled). |
| In the text | |
|
Fig. 11 (a) VOC of PC-TENG at different frequencies, (b) ISC of PC-TENG at different frequencies, (c) QSC of PC-TENG at different frequencies, (d) VOC of PC-TENG at different wavelengths, (e) ISC of PC-TENG at different wavelengths, (f) QSC of PC-TENG at different wavelengths amount. |
| In the text | |
|
Fig. 12 Simulated potential distribution of PC-TENG. (a) The comprehensive contact between the copper electrode and the PDMS, a transfer of charge is initiated; (b) As the two entities commence their separation, an electromotive force is engendered between the superior and inferior electrodes; (c) At the juncture when the separation distance attains its zenith, the potential difference similarly reaches its pinnacle; (d) As the separation distance incrementally diminishes from its peak, the potential difference correspondingly wanes. |
| In the text | |
|
Fig. 13 (a) Plot of potential vs. speed of friction layer movement (frequency) (b) Plot of potential vs. speed of friction layer movement (wavelength). |
| In the text | |
|
Fig. 14 (a) Equivalent circuit model of PC-TENG, (b) external load versus optimized PC-TENG output current and power, (c) external load versus pre-optimized PC-TENG output current and power. |
| In the text | |
|
Fig. 15 (a) Schematic diagram of conversion circuit, (b) output current before and after conversion. |
| In the text | |
Current usage metrics show cumulative count of Article Views (full-text article views including HTML views, PDF and ePub downloads, according to the available data) and Abstracts Views on Vision4Press platform.
Data correspond to usage on the plateform after 2015. The current usage metrics is available 48-96 hours after online publication and is updated daily on week days.
Initial download of the metrics may take a while.