


| Issue |
Sci. Tech. Energ. Transition
Volume 81, 2026
|
|
|---|---|---|
| Article Number | 19 | |
| Number of page(s) | 24 | |
| DOI | https://doi.org/10.2516/stet/2026017 | |
| Published online | 31 juillet 2026 | |
Regular Article
A swarm-based soft computing approach for harvesting maximum power in practical photovoltaic system
1
Department of Electronics and Communication Engineering, Brainware University, Barasat, Kolkata, 700125, West Bengal, India
2
Department of Electrical Engineering, Sanaka Educational Trust’s Group of Institutions, Malandighi, 713212, West Bengal, India
* Corresponding author: Cette adresse e-mail est protégée contre les robots spammeurs. Vous devez activer le JavaScript pour la visualiser.
Received:
5
November
2025
Accepted:
3
June
2026
Abstract
In order to satisfy the depletion of fossil fuels and the increasing demand, researchers are concentrating on renewable energy sources such as photovoltaic (PV) systems. To guarantee the effective operation of PV systems, a robust Maximum Power Point (MPP) Tracking technique is required to address nonlinear and multimodal challenges, such as MPP Tracking under uniformly distributed irradiance and partially shaded situations. In this context, this work proposes a Zone Segregated Adaptive Particle Swarm Optimization (ZSAPSO) technique for addressing the MPP Tracking (MPPT) problem in partially shaded and uniformly distributed irradiance situations. The proposed ZSAPSO technique basically uses the basic structure of the APSO algorithm, but in the APSO technique, only one local best particle is considered throughout the execution, whereas in ZSAPSO, three local best particles are considered from three zones of the search space to incur a well exploration virtue of the algorithm during the start of its execution. Moreover, the sensitivity analysis is carried out in search of better performance of the ZSAPSO. Thereafter, the performance based on Settling Time (ST), steady state error (ESS), and efficiency of MPP tracking of the proposed ZSAPSO is compared with other cutting-edge techniques in MPPT application. All the simulated works are executed through MATLAB/SIMULINK, and the same are authenticated with the help of a practical setup. Every outcome shows how effectively the ZSAPSO manages the MPPT problem. Specifically, under uniform irradiance, ZSAPSO achieved a tracking efficiency of 99.987% with the lowest steady-state error (0.037%) and improved settling time compared to conventional PSO variants. Under partial shading, it attained 99.977% efficiency with the minimum ESS (0.025%) and faster convergence than other swarm-based techniques.
Key words: Adaptive particle swarm optimization / Photovoltaic / Maximum power point tracking / Settling time / Tracking efficiency
© The Author(s), published by EDP Sciences, 2026
 This is an Open Access article distributed under the terms of the Creative Commons Attribution License (https://creativecommons.org/licenses/by/4.0), which permits unrestricted use, distribution, and reproduction in any medium, provided the original work is properly cited.
Nomenclature
IPh: Current source of PV cell model or photocurrent (A).
VPV: Voltage across the PV cell (V).
Rse: Total resistances in series path of current (Ω).
Rp: Parallel resistance connected across the PV cell (Ω).
Ip: Current through Rp resistance (A).
ID: Diode current (A).
IPV: Current out of the PV cell (A).
I0: Diode saturation current (A).
q: Charge of electron (1.602 × 10⁻¹⁹ C).
T: Temperature in kelvin (K).
a: Diode ideality factor (generally lies between 1 and 2).
k: Boltzmann’s constant (1.38 × 10⁻²³ (J K−1)
Ns: Cells’ number in a PV string.
VOP: Boost converter’s output voltage.
Vmp: Voltage corresponding to maximum power.
Imp: Current corresponding to maximum power.
Dt: Duty cycle.
W: Inertia weight parameter.
C1, C2: Learning factors.
Ioi: Set of positive integers that must be odd.
ESS: Steady-state error.
ISC: Short circuit current (A).
Pm: Maximum output power of PV string (W).
I: Whole set of positive integers.
VOC: Open circuit voltage (V).
 :
Velocity at dth dimension of the pth particle in kth iteration.
:
Velocity at dth dimension of the pth particle in kth iteration.
 :
Position at dth dimension of the pth particle in kth iteration.
:
Position at dth dimension of the pth particle in kth iteration.
1. Introduction
Since the late nineteenth century, electricity generation has predominantly relied on conventional carbon-based fuels. However, the excessive utilization of fossil fuel resources has accelerated their depletion and significantly contributed to environmental degradation, particularly global warming caused by greenhouse gas emissions from thermal power plants [1]. These concerns have intensified global efforts toward large-scale integration of renewable energy sources into modern power systems. Among the available renewable technologies, Photovoltaic (PV) systems have emerged as one of the most promising alternatives due to their environmental friendliness, absence of harmful emissions, silent operation, ease of installation, and low maintenance requirements. Nevertheless, the effectiveness of a PV system is strongly dependent on its ability to operate at the Maximum Power Point (MPP). Hence, the development of reliable and efficient Maximum Power Point Tracking (MPPT) techniques is essential to ensure maximum power extraction under varying environmental conditions [2].
Conventional differentiation-based MPPT approaches such as Fractional Open Circuit Voltage (FOCV), Incremental Conductance (INC), Fixed Voltage (FV), Perturb and Observe (P&O), and Hill Climbing (HC) are widely adopted because of their simple structure and ease of hardware implementation [3, 4]. However, their limitations become prominent under Partial Shading (PS) conditions caused by clouds, trees, and nearby structures. Under PS scenarios, these fixed-step methods exhibit persistent oscillations around the MPP, slow convergence speed, and, more critically, a tendency to become trapped at local maxima instead of tracking the true global peak.
Recent comprehensive surveys further confirm these limitations, reporting that traditional techniques such as P&O, Incremental Conductance, Hill-Climbing, and basic Fuzzy Logic or Artificial Neural Network (ANN) controllers – although effective under uniform irradiance – suffer from slow tracking dynamics, steady-state oscillations, and an inability to identify the global MPP under partial shading due to the presence of multiple local peaks [5]. The nonlinear and multimodal characteristics of PV arrays under PS conditions make the MPPT problem inherently nonconvex, thereby demanding more robust global optimization strategies.
To overcome these drawbacks, Artificial Intelligence (AI)-based and advanced intelligent control methods have been explored, including ANN, Fuzzy Logic (FL), Sliding Mode (SM), Gauss–Newton (GN), and Fibonacci Search (FS) approaches. Compared to classical P&O, ANN and FL-based controllers can track the true MPP with reduced oscillations; however, they involve complex real-time implementation, higher computational burden, substantial memory requirements (especially for lookup tables in FL-based systems), and increased implementation cost [6]. Moreover, AI-dependent schemes require extensive training time and may lack adaptability when system configurations vary beyond initial tuning [4–8].
In contrast, advanced intelligent and metaheuristic techniques – such as Particle Swarm Optimization (PSO), Cuckoo Search (CS), Grey Wolf Optimization (GWO), hybrid fuzzy-PSO frameworks, and deep learning-based models – have demonstrated significant improvements in tracking accuracy, convergence speed, and capability to distinguish the global MPP under complex shading patterns [9]. For instance, hybrid and shading-aware PSO frameworks have been reported to reduce tracking time by more than 60% and enhance power extraction compared to traditional P&O methods under dynamic shading conditions. Nevertheless, these advanced techniques often incur higher computational complexity, increased sensor requirements, and dependence on embedded processing resources. Review studies focusing on AI and bio-inspired soft computing-based MPPT further emphasize that despite superior performance under non-uniform irradiation, such approaches demand careful parameter tuning and may pose implementation challenges in low-cost hardware platforms [10].
Given that the MPPT problem under PS conditions is characterized by multiple local maxima in the P–V and I–V curves [11], population-based metaheuristic algorithms have gained considerable attention due to their derivative-free search mechanism and strong global optimization capability [12]. Numerous algorithms, including Cuckoo Search (CS) [13], Salp Swarm Algorithm (SSA), Adaptive SSA, Chaotic PSO (CPSO), Improved PSO (IPSO), and standard PSO [11–13], have shown promising results in tackling the nonconvex MPPT problem.
Among them, PSO and its variants are particularly attractive due to their simplicity, robustness, faster convergence characteristics, and ease of real-time implementation [14–16]. However, classical PSO suffers from premature convergence and local optima entrapment owing to its strong dependence on control parameters such as inertia weight and acceleration coefficients. Selecting appropriate parameter values is often a challenging and time-consuming task. Adaptive PSO (APSO) variants have been introduced to address this issue by dynamically tuning control parameters during the optimization process [17]. Recent APSO-based MPPT strategies adjust learning parameters based on iteration progress or incorporate fuzzy logic mechanisms [18, 19], while other modifications refine the initial duty cycle estimation to reduce convergence time and suboptimal stagnation [20]. Although hybrid approaches such as Fuzzy Logic Controllers (FLC), Adaptive Neuro-Fuzzy Inference Systems (ANFIS), and neural network-assisted P&O techniques offer enhanced flexibility and performance, they typically involve higher implementation costs and computational complexity [21, 22]. Similarly, advanced PSO variants such as PSO-AWDV improve particle exploration capability through weighted delay velocity concepts, yet certain stagnation issues under severe shading conditions still persist [23].
Motivated by these research gaps, this paper proposes a novel swarm-based modified PSO variant termed Zone Segregated Adaptive Particle Swarm Optimization (ZSAPSO). The proposed technique integrates problem-adaptive control parameters with a structured zone-wise search mechanism to achieve an improved balance between exploration and exploitation. By intelligently segregating the search space and adaptively regulating swarm dynamics, the proposed method effectively mitigates local optima entrapment, accelerates convergence, and enhances global MPP detection under complex partial shading conditions.
To demonstrate its robustness and effectiveness, the proposed ZSAPSO is evaluated alongside several state-of-the-art algorithms, including standard PSO [24], APSO [25], Levy Flight-based APSO (APSOLF) [26], Self-Pollination-assisted APSOLF (SPAPSOLF) [27], and Constriction Factor-based PSO (CFPSO) [28]. Comparative analysis is carried out in terms of tracking efficiency, settling time (ST), convergence behaviour, and overall power extraction capability. All simulations are performed using the MATLAB platform, and experimental validation is conducted through a hardware setup to confirm the practical applicability of the proposed approach.
The section on PV cell modelling parameters was presented before moving on to the rest of the article. The objective function for optimization problems is then formulated after the APSOLF-PP-based proposed system description. The self-adaptive swarm-based optimization technique is summarized in the next section. The specifics of the experiment are then explained. The next section, which is followed by the section on results and discussions, provides a brief overview of the hardware experimental setup. Finally, a conclusion is reached based on a comprehensive observation and analysis of all the findings. The novelty of this research is surfaced below in bulleted form.
To handle both minimization real-time issues, a hybrid swarm-based metaheuristic technique is developed by integrating the idea of Zone-segregated exploration aided with Adaptive Particle Swarm Optimization (ZSAPSO) supported by random numbers from chaos theory.
The power tracking efficiency, steady-state error and settling time are improved by the proposed ZSAPSO approach as an MPPT technique.
Sensitivity analysis of the proposed ZSAPSO technique.
This proposed ZSAPSO has been mainly applied in the MPPT optimization problem.
2. Practical photovoltaic system description
A rooftop fixed array of 100.1 kW peak-rated Photovoltaic (PV) system has been installed, consists of 182 panels of NOVASYS. These 182 panels are actually divided into two groups of 91 panels, and each group is installed on either side of the rooftop of the university building as shown in Figure 1.
 |
Figure 1 Practical rooftop PV system of total 182 panels on the (a) east side and (b) west side of the roof. |
Each panel of NOVASYS is of 550 W peak power, whereas the open-circuit voltage (VOC) is 49.93 V and the short-circuit current (ISC) is 13.97 A. Moreover, the voltage (Vmp) and current (Imp) corresponding to the peak power of 550 W are 40.94 V and 13.44 A. The 91 panels of each side of the roof are connected first with the DC Distribution Box (DCDB) (of five I/P, five O/P terminals), then with each SUNGROW string inverter having a rated power of 50 kW. Ultimately, two 50 kW inverters are employed to deliver AC power of 100 kW. Outputs of two inverters are connected to a three-phase Aluminium bus-bar having a current rating of 250 A. In the AC Distribution Box (ACDB), from where the three-phase power is thereafter delivered to the common bus bar at which the conventional supply and Diesel Generator (DG) are connected to meet the connected load demand uninterruptedly.
It is worth mentioning that each 50 kW string inverter is embedded with MPPT blocks as illustrated in Figure 2a. There are 4 MPPT blocks with the provision of two strings to be connected to each MPPT block. Thus, each inverter can accommodate eight strings. But instead of eight strings, five strings (4 strings of 18 panels in series and 1 string of 19 panels in series) are accommodated within the casing of each inverter embedded with MPPT blocks. Thus, 10 strings of PV panels are connected to two inverters (each of 50 kW peak) to obtain 100.1 kWp as shown in Figure 2b.
 |
Figure 2 (a) MPPT provisions embedded in inverter casing, (b) DCDB, inverter and ACDB, (c) common bus bar where DG, PV and conventional supply are connected. |
To make the entire system connection easier to comprehend, a flow chart is given in Figure 3, where the data logger is utilized to establish the data acquisition system using communication cables (RS485) marked by green lines in Figure 3. The daily, monthly, and annual generation of the PV system along with the data of CO2 emission (in Ton) for producing equivalent power generation from fossil fuel and corresponding earning data in rupees, are the important information regarding the system that the data logger can provide. Additional information such as the system’s Capacity Utilization Factor (CUF) may also be provided by the data logger or data acquisition system.
 |
Figure 3 Flow chart of practical rooftop grid-tied PV system. |
It is worth mentioning here that the portion of the grid-connected PV system in Figure 3 highlighted by the coloured shaded box has been simulated in MATLAB/SIMULINK in order to investigate its dynamic behaviour thoroughly. As the simulation is showing the MPPT process, the highlighted portions’ output is required to validate the simulation. The corresponding simulation model has been briefed in the succeeding section. Additionally, it is necessary to discuss that, as each string comprising 18 PV panels is separately connected to each MPPT block as shown in Figure 2a, the simulation model is designed for a 1 × 18 PV string only, and the power output of that string is multiplied by 10 times to get the PV system’s actual output of 100.1 kW peak. Therefore, the know-how of the simulation modelling strategy is required to know and the same is explained as follows.
3. Description of simulation model
Before discussing the whole system model, the basic unit of the system, i.e., the PV cell, is essential to be known. In order to model the PV cell, there are several modelling schemes, of which the single diode or one diode modelling is popular for its simple outlook and ease of implementation. Hence, the said modelling strategy is presented as follows:
3.1. Single diode model of PV cell
The eminent scientist Edmund Becquerel discovered the photovoltaic effect toward the end of the nineteenth century, and it has since been used to construct photovoltaic (PV) cells. When the semiconductor-based PV cell is exposed to sunlight, a potential difference is created across its terminals. When the electron-hole pair is produced by absorbing the photon energy from the sun’s rays, this potential difference is produced. As a result, the PV cell aids in converting solar energy into electrical energy. The 1-diode modelling of PV cell, shown in Figure 1, is the most straightforward and well-liked model among the various established models [30]. One way to formulate the PV cell model’s output current is as (1).![Mathematical equation: $$ {I}_{\mathrm{pv}}={I}_{\mathrm{Photon}}-{I}_S\left[{e}^{\left(\frac{q{V}_{\mathrm{pv}}+q{R}_{\mathrm{series}}{I}_{\mathrm{pv}}}{N_s kTa}\right)}-1\right]-\frac{V_{\mathrm{pv}}+{R}_{\mathrm{series}}{I}_{\mathrm{pv}}}{R_{\mathrm{parallel}}} $$](/articles/stet/full_html/2026/01/stet20250448/stet20250448-eq3.gif) (1)
(1)
Figure 4 illustrates the parasitic resistances, namely the series resistance (Rseries) and parallel resistance (Rparallel). The series resistance (Rseries) accounts for the power loss due to revolving currents within the PV cell. The series resistance does not affect the open-circuit voltage (VOC) but does influence the short-circuit current (ISC) of the photovoltaic cell, with ISC being inversely related to it. As the series resistance increases, the slope of the I–V curve in the constant voltage region decreases. The parallel resistance (Rparallel) represents the equivalent resistance of the P–N junction in the PV cell and is assumed to oppose the leakage current flowing across the junction. This resistance primarily affects the VOC. When the parallel resistance increases, the VOC decreases, causing the trend or slope of the I–V curve in the constant current region to rise. Preferably, the value of the series resistance should be equal to zero, and the same for the parallel resistance should be equal to infinity [31]. Using the manufacturer’s datasheet parameters (VOC, ISC, VM, IM, and temperature coefficients), an iterative numerical fitting process was used to extract the series resistance (Rs) and parallel resistance (Rp) of the NOVASYS 550 W panel. In particular, a Newton–Raphson-based optimization technique was used to reduce the error between simulated and datasheet operating points at Standard Test Conditions (STC) by solving the nonlinear I–V equation of the single-diode model. By making sure that the simulated P–V curve closely matched the rated peak power and knee-point characteristics, the retrieved Rs and Rp values were verified.
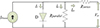 |
Figure 4 One diode model of PV cell. |
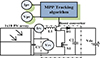 |
Figure 5 Simulated model of the PV system. |
Additionally, temperature impacts were modelled using the temperature coefficients of VOC and ISC given in the datasheet, and irradiance dependency was integrated by scaling the photocurrent proportionately with irradiance. The conventional semiconductor relation was used to modify the diode saturation current as a function of temperature.
3.2. Simulation model of the PV system
The specification of the NOVASYS PV panel has been presented in the following Table 1, which has been followed to simulate the same in SIMULINK, as the same module is practically used in the real-time rooftop PV system too.
Data sheet of NOVASYS 550 W panel.
The output DC voltage of a 1 × 18 PV string is produced using a variety of MPPT techniques related to the boost converter in order to maximize the power extracted from the PV system. To raise the DC voltage to the required level, the S1 switch of a DC–DC boost converter is supplied with the proper duty cycle (Dt). Typically, the MPPT methods handle figuring out the necessary Dt to run the PV system at the MPP point. As the practical rooftop PV system is installed after finding the effective area unaffected by shadow using thorough shadow analysis with the help of the SKETCH UP software platform, the system generally does not suffer from the Partial Shading (PS) issue due to shadow falling on the PV string. Hence, the efficacy of the proposed technique along with the other existing techniques, such as the MPP tracker, is verified by the simulation model, which is further validated through the practical setup under Uniform Irradiance (UI) condition. But the challenge to the MPP tracker is well imparted while addressing the MPPT problem under critical PS conditions. Hence, the study on determining the efficiency of the MPPT techniques under PS conditions is done in simulation only. The equation (2) formulates the boost converter’s output voltage (VOP).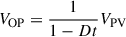 (2)
(2)
Additionally, the 2000 μF capacitor C2 reduces voltage ripple at the boost chopper’s output, and the 20 mH filter inductance (L1) values are selected based on the boost converter’s continuous conduction mode’s minimal requirements [32]. The filter capacitor C1 of 10 μF is connected across the 1 × 18 PV string. The rated voltage at the load side is then increased to a voltage equal to the corresponding battery voltages using boost converters. The battery rating is selected in such a way that the system can run at its MPP. Hence, the battery voltage is kept at 1000 V, whereas the VOC of each 1 × 18 panels string is 898.74 V. Though the battery provision is not there in the real-time setup, this battery is included in the simulation model so that the tracking algorithm can operate at the MPP point and the tracking efficiency along with associated parameters can be evaluated. The switch of the boost converter is operated with the duty cycle provided by the tracker, which creates Pulse-width modulation (PWM) pulses with a switching frequency of 5000 Hz.
It is crucial to make clear that in the actual rooftop installation, this battery does not represent a physical energy storage device. Rather, it is used only as a regulated DC load to keep the boost converter’s output voltage steady. For an accurate analysis of the MPPT algorithm’s duty-cycle control performance, this stability is crucial. The DC-link of the inverter, which keeps the voltage stable and under control, naturally carries out this task in a true grid-connected system. Therefore, rather than being a storage component affecting system dynamics, the simulated battery should be viewed as an analogous representation of the DC-link.
The instantaneous PV voltage and current measured at the boost converter’s input are the only inputs used by the MPPT algorithm. Consequently, the nonlinear P–V characteristics of the PV array, rather than the downstream load, determine the tracking behavior and convergence performance. The battery only guarantees steady operating conditions and continuous conduction during dynamic operation; it neither participates in the control loop nor modifies the optimization landscape.
4. Objective functions derivations
The primary goal of an MPPT approach is to reach the operational point that corresponds to the maximum power (PM) of a PV string’s P–V characteristic curve. By multiplying the PV array’s output voltage (VPV) and current (IPV), one may determine the PV string’s output power (PPV). The PPV can be represented in (3) in terms of VPV, IPV, and duty cycle (Dt). The PV operating voltage is physically determined by the boost converter’s duty cycle through the converter voltage–gain relationship. Changing Dt indirectly moves the operating point along the P–V curve since the PV output power is a nonlinear function of its operating voltage. As a result, the MPPT problem is reduced to a single-variable optimization problem, where finding the ideal duty cycle to place the PV string at the global MPP is comparable to maximizing PV power.
The P–V curve shows several local maxima when there is partial shade. Varied Dt values in these situations equate to varied operating voltages, which may cause convergence at less-than-ideal peaks. As a result, the goal function shows a multimodal and nonlinear mapping between Dt and PV power.![Mathematical equation: $$ {P}_{\mathrm{PV}}=f\left( Dt,{V}_{\mathrm{PV}},{I}_{\mathrm{PV}}\right)=\left[{I}_{\mathrm{Photon}}\left(1- Dt\right){V}_{\mathrm{OP}}-{I}_0\left(1- Dt\right){V}_{\mathrm{OP}}\left[{e}^{\left(\frac{q\left(1- Dt\right){V}_{\mathrm{OP}}+q{R}_{\mathrm{series}}{I}_{\mathrm{PV}}}{N_s kTa}\right)}-1\right]-\frac{{\left(1- Dt\right)}^2{V_{\mathrm{OP}}}^2+{R}_{\mathrm{series}}{I}_{\mathrm{PV}}\left(1- Dt\right){V}_{\mathrm{OP}}}{R_{\mathrm{parallel}}}\right] $$](/articles/stet/full_html/2026/01/stet20250448/stet20250448-eq5.gif) (3)
(3)
As a result, the Objective Function (OF) associated with the MPPT problem is addressed by (3), which is then maximized as (4). (4)provided,
  .
.
Given the above description, it is evident that the MPPT is connected with the nonlinear behaviour of semiconductor-based PV systems, and the nonlinearity rises when the PS scenario has been taken into consideration. As a result, derivative-free metaheuristic algorithms may be able to handle such extremely nonlinear and complex problems more accurately than conventional classical methods [17]. Accordingly, the aforementioned optimization problem has been solved in this work using the proposed ZSAPSO technique. Consequently, the ZSAPSO technique needs to be described, which is done in the section that follows.
5. Proposed technique
This work proposes a swarm-based metaheuristic approach that is specifically inspired by the Particle Swarm Optimization (PSO) technique’s optimization methodology, which necessitates an understanding of its underlying principles. Developed in 1995, the PSO is a well-liked and reliable swarm-based metaheuristic technique that has been used extensively to address a variety of engineering problems [29]. The way a flock of fish or birds forages for food served as the model for this technique. The term “particle” refers to the individual fish or birds within the swarm. There are three different velocity components that affect the motion of each particle. The first component is linked to the particle’s inertial movement, while the other two velocity components are influenced by the local best (pbest) and global best (gbest) particles, respectively. The total of the three velocity components mentioned above eventually drives the particle. The three elements influencing the movement of an individual particle in the PSO technique are the inertia weight, the two learning or constriction factors.
In the proposed technique, the execution of the entire iteration is subdivided into two phases:
In the initial phase, the entire search space is categorized into zones such as three zones as illustrated in Figure 6a and the particles are updated according to the resultant velocity of their inertial movement, attraction towards the gbest and the attraction towards the zone-wise pbest particles.
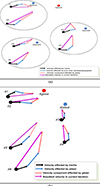 |
Figure 6 (a) Initial phase of zone-wise particle updating strategy (b) second or last phase of particle updating strategy, of the ZSAPSO algorithm. |
Thereafter, in the second phase of execution, the particles are updated using the usual approach of the standard PSO technique, considering the whole searching space instead of separate zones. This is how the PSO algorithm associated to the adaptive control parameters are modified to propose the Zone Segregated APSO (ZSAPSO) technique.
The reason for incorporating the initial phase in the ZSAPSO algorithm is to incur better exploration of the search space at the start of the algorithm’s execution. This concept has come from the behaviour of the huge swarm of birds, which has a few local clusters. Each cluster has its personal best bird, but all the clusters ultimately follow the best bird so far. Depending on this concept, as the search space is distributed initially in different zones, the searching diversity is enhanced, and the probability of the local optima entrapment problem of the algorithm can be reduced to a great extent.
As mentioned above, the proposed technique utilizes the adjustable or controllable variables adaptive demanded by the problem’s need; the adaptive control variables of ZSAPSO are formulated as in [14–16] for the maximization problem.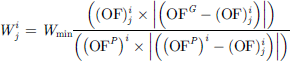 (5)
(5)
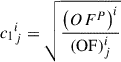 (6)
(6)
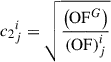 (7)Where,
Wmin: Minimum value of inertia weight.
 ,
,  : Constriction factors corresponding to the jth particle at the ith iteration.
 : Value of OF corresponding to the jth particle at the ith iteration.
 , OFG: Value of OF corresponding to the local best and the global best particles, respectively.
This adaptive inertia weight in (5) satisfies the requirement to adapt itself according to the particle’s condition: if the particle is far from the optimal one, it should have less inertia, which will enable it to move freely in any direction, enhancing the exploration process; if the particle is closer, it should have high inertia in maintaining its current position, which improves algorithmic exploitation; additionally, the step length of the particle’s movement is dictated by the constriction factors, so that larger step lengths are generated using (6) and (7) in order to push the particle in the direction of the optimal solution more rapidly whereas the low value of constriction factors help in well exploring the searching arena.
Thus, using these adaptive control variables, the particles are updated using (8) and (10) at the first or initial phase of the algorithm, where the zone-wise particle updating is executed. On the other hand, in the second or last phase of the algorithm uses the equations (9) and (10) to update the particle velocity and position, respectively. Moreover, it is necessary to include in the discussion that the velocity updating equations in (8) and (9) involve the random numbers RN1 and RN2, which are not derived from a normal distribution; rather, they are obtained from a chaotic sequence [35, 36] as shown by Figure 7a. This is done to avoid redundancy in deriving the random numbers, and thus the chance of recurrence of the same number can be eliminated. This is how the search diversity can be enhanced. Now the proportion of the initial and final phases during the total execution plays an important role in bringing the fine tuning between exploration and exploitation virtue of the proposed technique. Hence, to get the best possible outcome of the algorithm, the proper proportion of the first and second phases in the entire execution of the algorithm. This is done through sensitivity analysis where the initial and final phases within the entire execution are decided by different percentages of the maximum iteration count. As an example, if the maximum iteration count (ItMAX) is 500 and if the Initial Phase (IP) is running for 30% of the entire execution, then the initial phase, i.e., zone-segregated phase, is running for the first 150 iterations, whereas the Last Phase (LP) is running for the last 350 iterations. That is why the sensitivity analysis is accomplished during the start of Section 7 for aptly judging the algorithm’s optimizing efficacy. (8)
(8)
 (9)
(9)
 (10)Where,
 : Particle velocity at jth particle in ith iteration.
 |
Figure 7 (a) Bifurcation diagram of chaos theory. (b) Pseudo-code of particle updating phases in ZSAPSO algorithm. |
 : Particle position at jth particle in ith iteration.
 : Personal best particle position at jth particle in ith iteration of the corresponding zth zone.
 : Personal best particle position at jth particle in ith iteration.
 : Global best particle position up to ith iteration.
RN1, RN2 ∈ [b = r*b*(1 − b)]; i.e. Random numbers derived from Chaotic Logistic map equation; where 3.57 < r < 4 and initial value of “b” lies between 0, 1.
In order to realize the programming implementation of the ZSAPSO algorithm, the pseudo code has been depicted in Figure 7b.
The explanation that follows aims to clearly distinguish ZSAPSO from traditional multi-swarm and segmented metaheuristic frameworks at the algorithmic design level:
Differentiating Structurally from Traditional Multi-Swarm PSO: Conventional multi-swarm techniques like MSPSO, CPSO, and clustered PSO split the population into distinct or partially independent sub-swarms that trade elite particles on a regular basis while operating concurrently. This paradigm increases computational effort and communication load, despite its effectiveness. ZSAPSO, on the other hand, does not keep fixed sub-swarms. Only the initial investigation phase (IP), which accounts for around 30% of all iterations, uses a temporary zone-oriented segregation. The algorithm returns to a single global swarm after this phase. As a result, ZSAPSO maintains the benefits of varied exploration while avoiding ongoing inter-swarm synchronization overhead.
Segmenting Search Space Rather Than Dividing the Population: Particles are grouped together using traditional multi-swarm techniques. In contrast, ZSAPSO divides the search domain into discrete zones, each of which provides a representative local best particle in the early search phase. This region-oriented technique improves coverage of multimodal solution spaces where multiple local optima may coexist, such as P–V characteristics under partial shade. As a result, the guidance technique differs significantly from ring, star, or Von Neumann PSO neighborhood models in that it is spatially regulated rather than topology-based.
Framework for Two-Phase Exploration and Exploitation: Regular multi-swarm PSO techniques frequently use migration or regrouping procedures to strike a balance between exploration and exploitation. Instead, ZSAPSO uses a well-defined two-stage transition (IP to LP), and sensitivity analysis is used to determine the phase proportion. MPPT applications with quickly changing and multimodal operating conditions are especially well-suited to this planned development, which guarantees systematic early-stage diversification followed by targeted exploitation.
Adaptive Parameter Design Focused on Fitness: ZSAPSO calculates acceleration coefficients and inertia weights directly from the fitness relationships between each particle, its local best, and its global best, whereas many multi-swarm variations rely on predefined or heuristically chosen values. This fitness-driven adaptation improves resilience under dynamic irradiance fluctuations and lessens reliance on manual tweaking.
Chaos-Enhanced Method of Randomization: By using logistic-map-based chaotic sequences to produce stochastic coefficients, ZSAPSO reduces repetitive random patterns and increases ergodicity. Conventional MSPSO or CPSO implementations typically lack this kind of chaos-assisted diversity.
MPPT Application-Specific Design: ZSAPSO is specifically designed for nonconvex MPPT problems, in contrast to general multi-swarm optimizers. Under partial shade conditions, its early-stage region-wise scanning method prevents premature convergence toward local maxima.
When taken as a whole, these combined elements represent ZSAPSO’s core technical contribution, which goes beyond a straightforward multi-best guidance update.
6. Experiment details
The MATLAB software platform has been used to simulate this study. The PV panel has been modelled in this work using the specifications listed in Table 1. This specification has been utilized for both hardware validation and simulation.
In real time, the rooftop PV system is mostly subjected to the UI condition because the effective area on the rooftop is found out first by shadow analysis using SKETCH-UP software; thus, the disturbance due to shadow on the panel can be avoided as far as possible. Hence, the simulation results can be validated with the real-time outcome under UI condition only where solar irradiance is of 800 W/m2 and temperature is of 25 °C. But for the sake of insightful observation of the installed PV system, the simulation model of the 1 × 18 PV string is studied under PS conditions also. The irradiance pattern of that PS situation has been presented in Table 2. In the PS condition, the panel temperature is also kept at 25 °C.
Panel-wise irradiance pattern of 1 × 18 PV string in PS condition.
Using a real-time hardware setup, the PV system behaviour under UI is further confirmed while simulating the MPPT procedure under the previously specified UI as well as PS scenarios. Any MPPT technique’s effectiveness is suitably examined under irradiance patterns of PS condition, which makes the MPPT issue extremely difficult, nonlinear, as well as nonconvex. Given this, it is necessary to demonstrate the ZSAPSO technique’s resilience as an MPPT method in contrast to other methods under PS conditions.
The ZSAPSO technique is utilized as an MPP tracker in this work, and its efficacy has been evaluated against that of the traditional PO technique as well as other modern swarm-intelligent metaheuristics, like the PSO, APSO, CFPSO, APSOLF, and SPAPSOLF techniques. Setting the PO technique’s step size is crucial for accurately adjusting the tracking capacity. As a result, 0.01 has been set as the step size. While a very high step size may lead to more unwanted oscillation, a quite tiny step length can also increase Settling Time (ST). ST is the amount of time required by any approach to obtain the final value of the tracked MPP within a given tolerance [36]. The time needed for PV output power to enter and stay within ±2% of the ultimate steady-state value is technically defined as settling time (ST). The authors compare the results of applying each of the aforementioned MPPT techniques in both UI and PS scenarios.
The set of adjustable parameters selected for the MPPT application is shown in Table 3.
Settings of control parameter of different techniques.
The workflow for addressing the MPPT problem has been depicted in the flow charts in Figure 8.
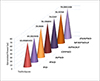 |
Figure 8 Flow chart describingbing MPPT procedure utilizing various swarm-based trackers. |
Each PV string in the rooftop installation is linked to a separate MPPT channel within the string inverter. This implies that maximum power point tracking is done at the string level on an individual basis. Therefore, the duty cycle of each MPPT channel is controlled by the suggested ZSAPSO algorithm. Because of this, modelling a single representative 1 × 18 PV string is adequate to capture the dynamic behaviour of each MPPT unit in the system in real time.
The resulting output power is scaled based on the number of strings in order to match the simulation results with the overall installed plant capacity. The comparative evaluation of important dynamic performance metrics, including settling time (ST), steady-state error (ESS), and tracking efficiency, is unaffected by this scaling, which is only done for presentation.
Mismatch losses are already maintained to a minimum under uniform irradiation conditions by careful string setup during installation and preceding shadow assessment. Furthermore, interactions at the inverter level are essentially negligible because each string has its own decentralized MPPT control.
The full-scale rooftop system has undergone experimental validation to further bolster the study’s practical applicability. To enable real-time authentication of the simulation results in the same test environment, the experimental settings are maintained for both simulation and hardware tests. Implementation features of the suggested ZSAPSO-based MPPT are examined to show practical applicability. In order to maintain a balance between computational load and responsiveness, the sampling interval is chosen in accordance with converter switching dynamics (microsecond–millisecond range). Despite being population-based, the algorithm uses zone-wise search and adaptive parameters to minimize unnecessary calculations, maintaining per-iteration complexity appropriate for embedded devices. Because it does not require complicated operations, it can be easily implemented on common DSPs and microcontrollers (such as the TI C2000). Only particle states and optimal values are involved, so memory needs are quite low. All things considered, the approach has a minimal processing load and works well for real-time embedded MPPT applications.
To provide a quick dynamic response, the sample interval is chosen between 0.5 and 2 ms. With a typical swarm size of 30–50 particles, the algorithm’s overall computational load stays within 500–800 operations per iteration, requiring roughly 25–40 arithmetic operations per particle per iteration. The technique can be used to common embedded processors that run at 50–150 MHz, such as DSPs and microcontrollers. Memory needs are minimal, usually less than 5–10 kB. The algorithm’s applicability for real-time embedded MPPT controllers is confirmed by the numerical results. Using this hardware experimental setup, the PV system simulation, MPPT controller, and boost chopper are verified. The ZSAPSO approach was used to execute MPPT control of a 1 × 18 PV string for hardware validation purposes. The results are analyzed with respect to the previously mentioned techniques.
7. Results and discussion
Before analyzing the proposed technique’s performance in MPPT applications, the best possible outcome of the proposed ZSAPSO technique is determined with the help of the sensitivity analysis. During sensitivity analysis, the proposed technique’s performance is judged under different percentages of IP and LP on challenging shifted and rotated benchmark suites. The power-voltage characteristic of MPPT under partial shade is intrinsically multimodal and nonconvex, and it closely matches the landscapes depicted by conventional benchmark multimodal functions. To emphasize the need for benchmark examination, this analogy has been presented in detail. While the MPPT simulation studies and hardware validation prove the method’s efficacy in the particular application domain, the benchmark testing shows the general optimization strength and robustness of the suggested approach. For greater conceptual clarity, the study clearly distinguishes between general optimization capabilities and application-oriented performance validation. The CEC-06 2019 and CEC BC-2017 benchmark suites include a number of shifted and rotated unimodal, multimodal, hybrid, and composition functions of varying complexity [34]. Table 4 shows the sensitivity analysis, which used one function from each of the aforementioned benchmark suites. CEC 03, CEC 08, CEC 11, and CEC 22 from the CEC-BC-2017 benchmark suite, as well as CEC 07 and CEC 08 rotated and shifted functions from the CEC-06-2019 benchmark suite, are tested with 50 population sizes and 10 dimensions [26, 34]. CEC-BC 2017 and CEC-C06-2019 cover functions with a maximum of 1000 and 500 iterations, respectively. Table 4 presents the statistical findings from 30 trials for each variation of each function.
Adjustable control parametric settings of different variations of proposed ZAPSO technique.
The nonparametric Friedman mean rank test, in which the ZAPSO approach correlates with the lowest value of the Friedman mean rank, can be carried out with the aid of the statistical result in Table 4. As a result, out of all the ZSAPSO variations, the ZSAPSO with IP: 30% of ItMAX , LP: 70% of ItMAX ranks first. A test on a unimodal function with a single optimal point purposefully demonstrates the technique’s exploitation potential.
However, multimodal functions with several optimal solutions evaluate the algorithm’s exploration performance, while an algorithm needs to be able to conduct a global search in order to find the global optima and avoid being trapped in local optima.
Thus, the ZSAPSO with IP: 30% of ItMAX, LP: 70% of ItMAX ranks first in Table 4, which provides strong evidence that it has a superior balance between exploration and exploitation skills than the other variation. On the other hand, when it comes to solving the shifted and rotated composite function, such as CEC22 in Table 4, the ZSAPSO technique (with IP: 30% of ItMAX , LP: 70% of ItMAX) does not perform as well as the other variations. Rotated, extended, and hybridized unimodal and multimodal functions combine to form a composite function. As the ZSAPSO with IP: 30% of ItMAX , LP: 70% of ItMAX performs better than other variations in most of the suites, and it ranks 1, this proportion of IP and LP is set as standard to conduct the power tracking assignment in the MPPT application. Moreover, this proportion is also listed in Table 3 against the proposed ZSAPSO technique.
Thereafter, the simulation works on MPPT using the ZSAPSO technique (with IP: 30% of ItMAX , LP: 70% of ItMAX) are done, and the simulated results for PV power generation using MPPT under UI condition, followed by a hardware setup validation, are analyzed. Additionally, in order to test the performance of the proposed technique in a critical PS condition, the simulation model is subjected to a PS situation. Two different conditions, like UI and PS, have been categorized into the subsections pertaining to PV power generation results.
By providing proper Dt to the semiconductor switch attached to the boost converter, the MPPT technique aims to maximizing power out of the PV string in both real-world cases, viz., PS and UI. Developing an effective and robust MPPT technique is still a research issue since the concerned problem is highly nonlinear and nonconvex, especially in PS conditions. Consequently, the efficacy of several MPP Trackers has been assessed in both UI and PS scenarios in the sections that follow:
7.1. Findings under uniform irradiance
Understanding the P–V and I–V curves in specific irradiance and temperature circumstances is necessary to obtain the correct knowledge of VPV and IPV corresponding to global MPP. In order to do this, Figure 9a shows the said curves of a string consisting of 1 × 18 PV panels (each panel of NOVASYS 550 W) under 800 W/m2 irradiation and 25 °C temperature. These environmental parameters have been chosen as those parameters are practically measured on that particular day when the tests were conducted in real time. Figure 9b zooms in near the operational points close to the global MPP.
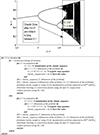 |
Figure 9 Under Uniform irradiance conditions, (a) the P–V and I–V curves and (b) the zoomed portion of the P–V and I–V curves. |
In contrast to the ZSAPSO technique, it is clear that the PO, PSO, APSO, CFPSO, APSOLF, and SPAPSOLF-based MPPT techniques have had trouble bringing their optimizing strategies closer to the actual MPP because of the shaded region’s noticeable flattening structure as shown in Figure 9b. The shaded area in Figure 9b highlights the maximum PPV that was obtained using the aforementioned strategies, and Figure 10 presents the matching power tracking curves for various algorithms, which aid in realizing said techniques’ MPP tracking capabilities. Additionally, Figure 10 shows that in the case of the PO, the tracked power’s steady-state value is tainted with a tiny oscillation. This occurred as a result of the PO algorithm’s preset perturbation value. There is a slight oscillation around the steady-state value of PPV because the PO is unable to maintain a fixed value of Dt due to the fixed perturbation. While it is impossible to completely eradicate these oscillations, they can be lessened by decreasing the perturbation step. On the other hand, a delay in achieving the steady-state value may result from a reduction in perturbation. It is found that the ZSAPSO technique’s tracking curve is far smoother than that of the PO and other swarm-based metaheuristic technique variations. It is evident from the examination of Figures 10a–10g that alternative swarm-based methods are outperforming the traditional PO method. Although the associated curves have attained their steady state values more quickly in the cases of the APSO and CFPSO techniques than in the PSO approach, this is further evident from Figures 10b–10d. This occurred because the PSO algorithm’s static control variables, which encounter local trapping issues, have a significant impact on its convergence. In the case of the APSO, the self-adaptive control parameters of the APSO algorithm can be used to reduce the oscillatory convergence curve, which was found in the case of the PSO. Again, the CFPSO exhibits superior convergence characteristics over the PSO and APSO techniques because of its specially derived constriction factor. The related power tracking curves in Figure 10d are therefore performing better than the PSO and APSO methods. Despite the PSO approach being modified to develop APSOLF and SPAPSOLF procedures, particle updating phases still rely on a few preset control parametric ranges. The limitation of parametric range reliance persists to some degree even when the migrating intelligent searching procedures are introduced in the APSOLF and SPAPSOLF techniques, leading to improved precision. The suggested ZSAPSO approach has been successful in diversifying the searching strategy for optimizing the accuracy by introducing scattered search in the initial phase of the algorithm while taking the adaptive control parameters into consideration. This has helped to mitigate the shortcomings of the APSOLF and SPAPSOLF techniques. The tracking curve of the ZSAPSO in Figure 10g shows that this might work well for the MPPT problem. The ZSAPSO algorithm’s scattered searching technique during the first phase of execution may have caused well exploration, which is why the tracking curve’s settling time was the shortest among all the swarm intelligent tracking methods.
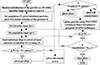 |
Figure 10 MPPT tracking curves for uniform irradiance condition, PPV vs. Time for (a) PO, (b) PSO, (c) APSO, (d) CFPSO, (e) APSOLF, (f) SPAPSOLF, and (g) ZSAPSO techniques. |
One crucial metric for determining an MPP tracker’s tracking speed is the Settling Time (ST). The ST for the various MPPT approaches in this work may be easily identified from Figure 10, and they are reported in Table 5. Out of all the approaches available, the ZSAPSO technique has the lowest ST value in this table. This finding suggests that the ZSAPSO method outperforms the other methods in terms of convergence speed to the optimal solution.
Parameters for comparison of different MPPT techniques under uniform irradiance.
Table 5 also reports the final PPV values derived from the ZSAPSO in addition to other MPPT methods. The tracking efficiency of several MPPT techniques has been calculated and listed in the same table using those final values of PPV with regard to the actual MPP of the PV string i.e., 7959 W (as shown in Fig. 9a). Notably, the ZSAPSO technique is outperforming the other MPPT techniques in terms of tracking efficiency and accuracy, as indicated by the bolded face. The higher tracking efficiency indicates that, in comparison to the other methods, the ZSAPSO algorithm has a better tuning in the proportion between exploration and exploitation properties throughout the entire execution of the algorithm.
The Dt is one of the primary determinants and the MPPT controller’s solution; thus, understanding Dt through various methods is essential. For this reason, Figure 11 displays the Dt vs. Time plot for reported trackers. For the PO approach, sustained oscillations in the tracking curve are caused by a fixed perturbation in Dt, as shown in the zoomed-in section of Figure 11a. It results from the PO algorithm’s fixed perturbation.
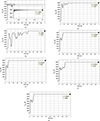 |
Figure 11 Under uniform irradiance, Duty cycle (Dt) vs. Time for (a) PO, (b) PSO, (c) APSO, (d) CFPSO, (e) APSOLF, (f) SPAPSOLF, and (g) ZSAPSO techniques. |
Particle movement step lengths can be carefully adjusted to evaluate precise values of Dt with a higher range of precision since controllable parameters of the ZSAPSO-based MPPT technique are adaptive to the characteristics of the problem, as well as its initial searching diversity explores the search space adequately. Consequently, although having an identical starting position, the ZSAPSO can achieve a superior steady-state value of Dt more quickly without sacrificing the accuracy than the other trackers. The ZSAPSO is capable of reaching the steady-state value of Dt, which is indicated by Figures 11a–11f, in accordance with conclusions drawn from these data.
It is significant to note from these numbers that the PO approach has the lowest tracked maximum PPV. The ZSAPSO has achieved a tracked PPV of 14.8%, 0.72%, 0.76%, 0.012%, 0.5%, and 0.5%, greater than the conventional PO, PSO, CFPSO, APSOLF, and SPAPSOLF approaches, respectively, when the same study is carried out for the other swarm-based trackers. By keeping the same chronological order, the steady state error (ESS) in Table 5 is progressively decreased from the PO technique to the ZSAPSO technique. This insight aids in the analysis of how the PO technique’s fixed perturbation accounts for the retained error, whereas other strategies’ high ESS is caused by an inferior utilization of the best particle than the suggested technique.
The same tests are conducted in a hardware setup with a 1 × 18 PV string connected to the MPPT block to verify the effectiveness of ZSAPSO as an MPP tracker in a practical scenario. But simulation is done on a string of 1 × 18 PV panels, whereas the real-time finding is presented for the entire system having 10 sets of 1 × 18 PV string (i.e. system with 182 panels). That is why the 10 times of a string output comes as the whole system outcome, as shown in Figure 12. Figure 12 shows the daily generation curve under UI conditions for each technique after the MPP tracking algorithms were built into the MPPT controller individually. While just the daily generation curves for the other trackers are displayed in Figures 12b–12g, the whole data logger screenshot for the daily generation curve utilizing PO as an MPP tracker is displayed in Figure 12a. On that day, when the temperature was 25 °C, and the sun irradiation was 800 W/m2, the most noticeable difference was seen at 12:00 pm (at noon). The maximum power tracked by various trackers at 12 pm is specifically depicted in Figure 13 because the difference may not be clearly seen from Figures 12a–12g.
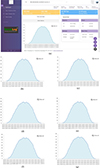 |
Figure 12 The (a) VPV and (b) IPV of the 8 × 1 PV array for proposed technique as MPP tracker. |
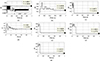 |
Figure 13 Power generated by different techniques. |
It is worth mentioning that Figure 12a also provides additional information like the Capacity Utilization Factor (CUF) and the saving of CO2 emission to generate equivalent energy generated by the PV system. As an example, the amount of energy generated by the PV system could be generated by fossil fuel-based resources and at that time, the 34.18 tons of CO2 could be emitted, costing Rs. 4.14 lacs. Thereby, it is inferred that in the case of the ZSAPSO method, the CUF would have a higher percentage than the traditional tracker, as well as the consequent savings due to equivalent CO2 emission could have been higher.
Although the PSO technique works better in the simulation than the standard PO technique, Figure 13 shows the superiority of the PO technique in real life over the PSO technique. It is noted that the APSO technique performs better than both the PO and PSO procedures. The APSO technique’s performance has been further compared with other PSO variants, including the CFPSO and the more recent ones, such as the APSOLF and SPAPSOLF techniques, in order to verify its effectiveness in the aforementioned application. The results show that the SPAPSOLF outperforms both the CFPSO and the APSOLF. Furthermore, the ZSAPSO is more accurate than the CFPSO and the APSOLF due to improved exploitation brought about by the inclusion of the Self Pollination (SP) searching technique. Because the exploitation ability is enhanced by the help of the SP approach in the SPAPSOLF technique over the APSOLF technique. Furthermore, the comparative study also consists of the ZSAPSO technique’s obtained result, which shows that it can track the MPP more accurately than the PO, PSO, APSO, CFPSO, APSOLF, and SPAPSOLF techniques by 17.81%, 18.83%, 1.3%, 1.13%, 1.35%, and 1.35%, respectively. This observation demonstrates that, among the other techniques, the tracked MPP by the APSOLF and SPASOLF techniques is fairly similar to that of the ZSAPSO technique. However, the ZSAPSO technique’s incremental improvement in tracked power is due to the diversity of searching aided by the zone-wise exploration virtue and well exploitation because of the adaptive nature of the ZSAPSO technique’s control parameters in real-time implementation. Premature convergence is less likely when such a combination is used in the search strategy.
Having only one MPP makes the P–V curve in UI conditions less complex than in PS conditions. As outlined in the following part, additional research is therefore carried out under the PS condition to compare the robustness of various approaches.
7.2. Findings under partial shading
Due to the existence of local peaks in addition to a global MPP, the irradiance pattern under PS conditions introduces complexity and nonlinearity to the PV string’s P–V and I–V curves. Thereby, the concerned problem becomes a multimodal problem. Therefore, understanding a PV string’s characteristic curves is crucial for adhering to the global MPP. Accordingly, Figure 14a shows the P–V and I–V characteristic curves of the aforementioned 1 × 18 PV string under the influence of the irradiance pattern as stated in Table 2. The authors have developed the ZSAPSO technique in MPPT application in PS condition since the latest literature encourages researchers to create newer trackers having greater efficiency in managing the difficult scenario of PS condition. As previously noted, the remarkable tracking capacity of the ZSAPSO-based MPPT strategy is demonstrated by comparing its performance with that of other swarm-based metaheuristics and the traditional PO approach. The zoomed P–V and I–V curves in Figure 14b magnify the zone where the tracked MPPs by the aforementioned trackers can be observed keenly. Furthermore, Figure 15 provides the corresponding power tracking curves for various approaches, which help to further analyze the tracking efficacies of the MPPT techniques.
 |
Figure 14 During PS condition, (a) the P–V and I–V curves and (b) the zoomed portion of Figure 14a. |
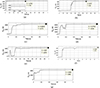 |
Figure 15 Under PS condition, Tracked power (PPV) vs. Time (t) for (a) PO, (b) PSO, (c) APSO, (d) CFPSO, (e) APSOLF, (f) SPAPSOLF and (g) ZSAPSO techniques. |
According to the results obtained in Figure 15, the PO technique settles down to its steady state value more quickly than the rest of the approaches, but stable state value of PPV is lower than that of all other techniques with the exception of PSO. The PSO technique could track the local MPP and be trapped in that only. Other altered versions of PSO, viz. the APSO, CFPSO, APSOLF, and SPAPSOLF, can effectively reduce the limitations of the PSO technique, although they are not entirely exempt from the fixed parametric constraint either. Consequently, the APSO, the CFPSO, the APSOLF, and the SPAPSOLF techniques could search the surrounding region of the global MPP (i.e. 4381 W) as shown in Figure 14b. Therefore, the need for the ZSAPSO technique, which is unrestricted by such limitations, has been considered. Because of this, the searching tendency is the most exacting among all the MPPT methods. As a result, compared to the other methods under investigation, the ZSAPSO method is able to follow the MPP more precisely, as shown in Figure 15. Furthermore, after reaching the MPP, no steady-state oscillation has impacted the ZSAPSO technique’s tracking curve.
Moreover, the observation of the tracking curves shows that the PO technique is prompt in tracking activity, but the other swarm intelligent trackers are more efficient in terms of accuracy. Among the metaheuristic trackers, the PSO is initially sluggish in searching, but after a simulation time of around 3.5 s, the PSO could reach a peak of 4169 W, which is a local peak of the P–V curve under PS. On the other hand, the other techniques in the study, like the APSO, the CFPSO, the APSOLF, the SPAPSOLF and the proposed ZSAPSO could overcome that local maxima trapping problem and reach near the global peak, i.e., 4381 W. The searching approach of the APSO is proven to be steady and gradually approaching the peak with stable footsteps in comparison to the CFPSO technique, as assessed by their respective curves in Figures 15b, 15c, respectively. Furthermore, the APSOLF’s LF searching mechanism makes the proportion of exploration and exploitation properties more balanced, which is further deteriorated in the case of SPAPSOLF owing to excessive exploitation caused by the SP approach in MPPT applications, especially. Finally, the most accurate maxima is tracked by the proposed ZSAPSO technique even with the least ST among the other swarm intelligent trackers. The reason for the improvement in ST, in ZSAPSO, has been attributed to the better convergence speed achieved due to rigorous exploration during its IP. Additionally, the accuracy is highest in the ZSAPSO technique when the technique has 30% IP and 70% LP. In such proportion, the ZSAPSO works better by achieving well-proportioned exploration and exploitation features, which is strengthened by a scattered searching approach owing to chaos-generated random numbers. This phenomenon particularly incurs intense searching diversity [35, 36].
Table 6 lists these brief results about the tracking curves of different trackers, which helps in determining the ST for various trackers in the case of the PS. Findings in Table 6 and Figure 15’s observation demonstrate that the ZSAPSO approach has the lowest ST among other swarm-based metaheuristic trackers. Moreover, the table also exhibits that the ZSAPSO strategy achieves the lowest steady state error among the trackers which shows its level of consistency in exploiting the global solution. Furthermore, Table 6 shows that, out of all the strategies used in this study, the ZSAPSO methodology has the highest tracking efficiency. A higher tracking efficiency value indicates proof of the skill of the trackers to accurately harvest power that is closer to the actual MPP in PS cases. The ZSAPSO technique’s adjustable step-lengths and zone-wise searching phenomena help to incur the convergence dynamics, which shows the time-domain behaviour of the technique. The lowest ESS shows the best steady-state stability and the least power ripple in the case of the ZSAPSO technique. In addition, resilience to multimodal P–V features (reliability of global peak detection) has allowed it to reach such precision. Consequently, the best tracking efficiency is achieved in the case of the proposed tracker in this study.
Parametric comparative analysis of various MPPT techniques under PS condition.
Tracing the corresponding MPP of various MPPT strategies requires an understanding of the Dt, which is the solution to MPPT optimization. As a result, Figure 16 shows the Dt in relation to time for various trackers. Figure 16a depicts the Dt variation during simulation for the PO technique, which has a stable oscillation in the steady-state condition but also creates unwanted oscillations in the steady-state power. The application of metaheuristic approaches effectively reduces this PO technique’s shortcoming. As illustrated in Figure 16b, the PSO approach continues to suffer from trapping into a suboptimal value of Dt. In Figures 16c–16f, the APSO, CFPSO, APSOLF and SPAPSOLF approaches significantly restore the oscillatory convergence pattern of the PSO. These methods, nevertheless, suffer from the limitation of poor exploitation and exploration balance because of fixed control parameter values, even though they are better than the PSO method in determining the better value of Dt. The adaptive control parameter-based ZSAPSO technique has effectively reduced this limitation by determining the appropriate value of Dt, as seen in Figure 16g, for tracking the MPP with a considerable degree of precision. This happens owing to the fact that the ZSAPSO technique incorporates a diversified searching approach during the initial IP of the algorithm. Out of all the swarm-based trackers, the ZSAPSO has attained its final value of Dt, which is the quickest among the other swarm intelligent techniques, as presented in Figure 16.
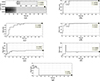 |
Figure 16 Under PS condition, Tracked power (PPV) vs. Time (t) for (a) PO, (b) PSO, (c) APSO, (d) CFPSO, (e) APSOLF, (f) SPAPSOLF and (g) ZSAPSO techniques. |
As a result of the overall observations, it is possible to conclude that ZSAPSO is an efficient swarm-based technique capable of handling various levels of complexity in MPPT applications.
Moreover, to strengthen the comparative analysis of the proposed tracker with respect to the other trackers, a quite complex partial shading issue is considered for further investigation. This partial shading issue is considered as complex as the issue has become highly nonlinear, nonconvex and multimodal with multiple peaks. The panel-wise irradiance pattern is given in Table 7, whose corresponding P–V and I–V curves of 1 × 18 PV string is presented in Figure 17. According to these characteristic curves, the actual global MPP is at 4279 W.
Panel-wise irradiance pattern of a 1 × 18 PV string in complex PS conditions.
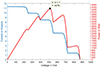 |
Figure 17 The P–V and I–V curves of 1 × 18 PV string under complex PS conditions. |
The tracked power by different MPP trackers under PS condition according to the Table 7 pattern, is enlisted in Table 8. This table also records the tracking efficiencies and steady state errors, so that the trackers’ tracking accuracy, as well as the tracking stability and consistency, can be assessed.
Parametric comparative analysis of various MPPT techniques under complex PS conditions.
The maximum value of tracked power and tracking efficiency is obtained in the case of the proposed ZSAPSO technique. This signifies that the best balance has been achieved by the proposed method among all the methods in the study. Additionally, the lowest value of steady state error (ESS) indicates that the proposed method is appreciably stable towards the optimal solution with the least oscillation. Such findings also ensure that global peak detection reliability is best among all the methods in this investigation, which confirms its robustness in handling complex, multimodal problems too.
8. Conclusion
This paper introduced the Zone Segregated APSO (ZSAPSO) technique, which is a swarm-based metaheuristic algorithm, and can adjust its control parameters depending on the objective function to obtain a relevant step length to suit the task. Additionally, the initial phase of the execution is equipped with a zone-segregating searching scheme, which enhances the exploration property of the algorithm. Owing to this, the algorithm under consideration has a balanced performance concerning exploration and exploitation. Moreover, in order to fetch searching diversity with greater intensity, the authors incorporate the random numbers derived from chaos theory instead of the usual normal distribution. As such, it achieves a higher rate of convergence as compared to the other variations of swarm-based metaheuristic algorithms, including the PSO, APSO, CFPSO, APSOLF and SPAPSOLF algorithms. The given study is the first to apply the ZSAPSO algorithm to the solution of the Maximum Power Point Tracking (MPPT) problem based on the advantages of the zone-segregated exploration combined with adaptive searching.
Under its ability to be well-balanced in the ability to explore/exploit, it can be noted that the ZSAPSO technique is seen to outperform the rest of the said modern techniques in the application of MPPT in terms of Settling Time (ST), accuracy, and tracking efficiency. Specifically, the lowest ST value of the ZSAPSO among the other swarm intelligent trackers means that it converges much faster to the optimal solution in comparison with the traditional PO technique and the variants of the above swarm-based techniques. Besides, all the MPP tracking algorithms are developed separately on the controller of the hardware configuration so that the performance of all trackers in real-time applications can be compared. This comparison study demonstrates better performance of the ZSAPSO approach with other trackers in the real-world application.
Therefore, the ZSAPSO method may be regarded as a robust algorithm in the swarm-based metaheuristic brotherhood that could solve complex, nonlinear, and nonconvex real-world engineering problems with astounding effectiveness, in general.
In future, the optimizer will be implemented to solve the MPPT issue of the PV systems under varying irradiance scenarios.
Conflicts of interests
The authors declare that they have no known competing financial interests or personal relationships that could have appeared to influence the work reported in this paper.
Author contribution statement
Abhishek Bhowmik: Formal analysis, Resources, Writing – original draft. Debanjan Mukherjee: Conceptualization, Methodology, Investigation, Software, Writing – original draft, Writing – review & editing. Angshuman Majumdar: Supervision, Validation, Writing – review & editing.
Acknowledgments
The authors intend to express their feeling of gratitude to the university seed money grant project with the research project numbered “BWU/PRJ/SMG/23-24/005” in the Brainware University, Barasat, Kol-125, India, for providing infrastructure for the real-time validation purpose of the innovative concept.
References
- Yousaf M.Z., Koondhar M.A., Zaki Z.A., Ahmed E.M., Alaas Z.M., Mahariq I., Guerrero J.M. (2025) Improved MPPT of solar PV systems under different environmental conditions utilizes a novel hybrid PSO, Renew. Energy 244, 122709. [Google Scholar]
- Siddique M.A.B., Zhao D., Ouahada K., Rehman A.U., Hamam H. (2025) Performance validation of global MPPT for efficient power extraction through PV system under complex partial shading effects, Sci. Rep. 15, 1–24. [Google Scholar]
- Kumar A., Kumar P. (2021) Power quality improvement for grid-connected PV system based on distribution static compensator with fuzzy logic controller and UVT/ADALINE-based least mean square controller, J. Mod. Power Syst. Clean Energy 9, 1289–1299. [Google Scholar]
- Bollipo R.B., Mikkili S., Bonthagorla P.K. (2020) Critical review on PV MPPT techniques: classical, intelligent and optimisation, IET Renew. Power Gener. 14, 1433–1452. [Google Scholar]
- Mishra, V.L., Chauhan, Y.K., & Verma, K.S. (2022). A critical review on advanced reconfigured models and metaheuristics-based MPPT to address complex shadings of solar array. Energy Convers. Manage. 269, 116099. [Google Scholar]
- Endiz M.S., Gökkuş G., Coşgun A.E., Demir H. (2025) A review of traditional and advanced MPPT approaches for PV systems under uniformly insolation and partially shaded conditions, Appl. Sci. 15, 1031. [Google Scholar]
- Ibrahim A., Aboelsaud R., Obukhov S. (2019) Improved particle swarm optimization for global maximum power point tracking of partially shaded PV array, Electr. Eng. 101, 443–455. [Google Scholar]
- Basha C.H., Rani C. (2020) Different conventional and soft computing MPPT techniques for solar PV systems with high step-up boost converters: A comprehensive analysis, Energies 13, 1–27. [Google Scholar]
- Bhukya, L., Kedika, N.R., & Salkuti, S.R. (2022). Enhanced maximum power point techniques for solar photovoltaic system under uniform insolation and partial shading conditions: a review. Algorithms, 15(10), 365. [CrossRef] [Google Scholar]
- Ali, A., Irshad, K., Khan, M.F., Hossain, M.M., Al-Duais, I.N., & Malik, M.Z. (2021). Artificial intelligence and bio-inspired soft computing-based maximum power plant tracking for a solar photovoltaic system under non-uniform solar irradiance shading conditions – A review. Sustainability 13(19), 10575. [Google Scholar]
- Pervez I., Antoniadis C., Massoud Y. (2022) A reduced search space exploration metaheuristic algorithm for MPPT, IEEE Access 10, 26090–26100. [Google Scholar]
- Aygül K., Murat C., Tuğçe D., Mehmet T. (2019) Butterfly optimization algorithm based maximum power point tracking of photovoltaic systems under partial shading condition, Energy Sour., Part A: Recovery, Util., Environ. Effects, 1–19. [Google Scholar]
- Pal R.S., Mukherjee V. (2020) Metaheuristic based comparative MPPT methods for photovoltaic technology under partial shading condition, Energy 212, 1–23. [Google Scholar]
- Koad R.B.A., Zobaa A.F., El-Shahat A. (2016) A novel MPPT algorithm based on particle swarm optimization for photovoltaic systems, IEEE Trans. Sustain. Energy 8, 468–476. [Google Scholar]
- Obukhov A.I.S., Diab A.A.Z., Al-Sumaiti A.S., Aboelsaud R. (2020) Optimal performance of dynamic particle swarm optimization based maximum power trackers for stand-alone PV system under partial shading conditions, IEEE Access 8, 20770–20785. [CrossRef] [Google Scholar]
- Mallick S., Ghoshal S.P., Acharjee P., Thakur S.S. (2013) Optimal static state estimation using improved particle swarm optimization and gravitational search algorithm, Int. J. Electr. Power Energy Syst. 52, 254–265. [Google Scholar]
- Mukherjee D., Mallick S., Rajan A. (2022) A Levy Flight motivated meta-heuristic approach for enhancing maximum loadability limit in practical power system, Appl. Soft Comput. 114, 1–36. [Google Scholar]
- Merchaoui M., Hamouda M., Sakly A., Mimouni M.F. (2020) Fuzzy logic adaptive particle swarm optimisation based MPPT controller for photovoltaic systems, IET Renew. Power Gener. 14, 2933–2945. [Google Scholar]
- Chen X., Chai Y., Wang Y. (2020) Application of adaptive particle swarm optimization in multi-peak MPPT of photovoltaic array, in: 2020 IEEE 4th Information Technology, Networking, Electronic and Automation Control Conference (ITNEC) 1, 165–169. [Google Scholar]
- Eltamaly A.M., Al-Saud M.S., Abokhalil A.G., Farh H.M. (2020) Simulation and experimental validation of fast adaptive particle swarm optimization strategy for photovoltaic global peak tracker under dynamic partial shading, Renew. Sustain. Energy Rev. 124, 1–14. [Google Scholar]
- Sen P., Bana P.R., Panda K.P. (2019) Firefly assisted genetic algorithm for selective harmonic elimination in PV interfacing reduced switch multilevel inverter, Int. J. Renew. Energy Res. 9, 32–43. [Google Scholar]
- Nzoundja Fapi C.B., Tchakounté H., Ndje M., Wira P., Abdeslam D.O., Louzazni M., Kamta M. (2025) Fuzzy logic-based maximum power point tracking control for photovoltaic systems: A review and experimental applications, Arch. Comput. Methods Eng., 1–24. [Google Scholar]
- Azad M.A., Tariq M., Sarwar A., Sajid I., Ahmad S., Bakhsh F.I., Sayed A.E. (2023) A particle swarm optimization–adaptive weighted delay velocity-based fast-converging maximum power point tracking algorithm for solar PV generation system, Sustainability 15, 15335. [Google Scholar]
- Eberhart R., Kennedy J. (1995) A new optimizer using particle swarm theory, in: Proceedings of the Sixth International Symposium on Micro Machine and Human Science, pp. 39–43. [Google Scholar]
- Mukherjee D., Mallick S. (2024) Efficient operation of photovoltaic-interfaced reduced switch 11-level inverter using adaptive swarm-based metaheuristic, Electr. Eng. 106, 521–551. [Google Scholar]
- Mukherjee D., Mallick S. (2023) Utilization of adaptive swarm intelligent metaheuristic in designing an efficient photovoltaic interfaced static synchronous series compensator, Eng. Appl. Artif. Intell. 123, 106346. [Google Scholar]
- Mukherjee D., Mallick S. (2024) A swarm intelligent metaheuristic approach for efficient series compensation resulting in system loadability enhancement, Arab. J. Sci. Eng., 1–29. [Google Scholar]
- Panda K.P., Panda G. (2018) Application of swarm optimisation-based modified algorithm for selective harmonic elimination in reduced switch count multilevel inverter, IET Power Electron. 11, 1472–1482. [Google Scholar]
- Li F., Wang Y., Wu F., Huang Y., Liu Y., Zhang X., Ma M. (2020) Review of real-time simulation of power electronics, J. Mod. Power Syst. Clean Energy 8, 796–808. [Google Scholar]
- Mohanty S., Subudhi B., Ray P. K. (2015) A new MPPT design using grey wolf optimization technique for photovoltaic system under partial shading conditions, IEEE Trans. Sustain. Energy 7, 181–188. [Google Scholar]
- Ayop R., Tan C.W. (2017) A comprehensive review on photovoltaic emulator, Renew. Sustain. Energy Rev. 80, 430–452. [Google Scholar]
- Mohan N., Undeland T.M., Robbins W.P. (2003) Power electronics: converters, applications, and design, John Wiley and Sons. [Google Scholar]
- Mirza A.F., Mansoor M., Ling Q. (2020) A novel MPPT technique based on Henry gas solubility optimization. Energy Convers. Manage. 225, 1–22. [Google Scholar]
- Atha R., Rajan A., Mallick S. (2024) An enhanced equilibrium optimizer for solving complex optimization problems, Inf. Sci. 660, 120077. [Google Scholar]
- Nagadurga T., Dhana Raju V., Barnawi A.B., Bhutto J.K., Razak A., Wodajo A.W. (2025) Global MPPT optimization for partially shaded photovoltaic systems, Sci. Rep. 15, 10831. [Google Scholar]
- Rajanala P., Kumar M.K., Giriprasad A., Choi J.H., Rao K.V.G., Sravan V.S., Reddy C.R. (2025) Intelligent MPPT and coordinated control for voltage stability in brushless DFIG wind turbines, Sci. Rep. 15, 22669 [Google Scholar]
All Tables
Adjustable control parametric settings of different variations of proposed ZAPSO technique.
Parametric comparative analysis of various MPPT techniques under complex PS conditions.
All Figures
|
Figure 1 Practical rooftop PV system of total 182 panels on the (a) east side and (b) west side of the roof. |
| In the text | |
|
Figure 2 (a) MPPT provisions embedded in inverter casing, (b) DCDB, inverter and ACDB, (c) common bus bar where DG, PV and conventional supply are connected. |
| In the text | |
|
Figure 3 Flow chart of practical rooftop grid-tied PV system. |
| In the text | |
|
Figure 4 One diode model of PV cell. |
| In the text | |
|
Figure 5 Simulated model of the PV system. |
| In the text | |
|
Figure 6 (a) Initial phase of zone-wise particle updating strategy (b) second or last phase of particle updating strategy, of the ZSAPSO algorithm. |
| In the text | |
|
Figure 7 (a) Bifurcation diagram of chaos theory. (b) Pseudo-code of particle updating phases in ZSAPSO algorithm. |
| In the text | |
|
Figure 8 Flow chart describingbing MPPT procedure utilizing various swarm-based trackers. |
| In the text | |
|
Figure 9 Under Uniform irradiance conditions, (a) the P–V and I–V curves and (b) the zoomed portion of the P–V and I–V curves. |
| In the text | |
|
Figure 10 MPPT tracking curves for uniform irradiance condition, PPV vs. Time for (a) PO, (b) PSO, (c) APSO, (d) CFPSO, (e) APSOLF, (f) SPAPSOLF, and (g) ZSAPSO techniques. |
| In the text | |
|
Figure 11 Under uniform irradiance, Duty cycle (Dt) vs. Time for (a) PO, (b) PSO, (c) APSO, (d) CFPSO, (e) APSOLF, (f) SPAPSOLF, and (g) ZSAPSO techniques. |
| In the text | |
|
Figure 12 The (a) VPV and (b) IPV of the 8 × 1 PV array for proposed technique as MPP tracker. |
| In the text | |
|
Figure 13 Power generated by different techniques. |
| In the text | |
|
Figure 14 During PS condition, (a) the P–V and I–V curves and (b) the zoomed portion of Figure 14a. |
| In the text | |
|
Figure 15 Under PS condition, Tracked power (PPV) vs. Time (t) for (a) PO, (b) PSO, (c) APSO, (d) CFPSO, (e) APSOLF, (f) SPAPSOLF and (g) ZSAPSO techniques. |
| In the text | |
|
Figure 16 Under PS condition, Tracked power (PPV) vs. Time (t) for (a) PO, (b) PSO, (c) APSO, (d) CFPSO, (e) APSOLF, (f) SPAPSOLF and (g) ZSAPSO techniques. |
| In the text | |
|
Figure 17 The P–V and I–V curves of 1 × 18 PV string under complex PS conditions. |
| In the text | |
Current usage metrics show cumulative count of Article Views (full-text article views including HTML views, PDF and ePub downloads, according to the available data) and Abstracts Views on Vision4Press platform.
Data correspond to usage on the plateform after 2015. The current usage metrics is available 48-96 hours after online publication and is updated daily on week days.
Initial download of the metrics may take a while.