


Open Access
Figure 2
Download original image
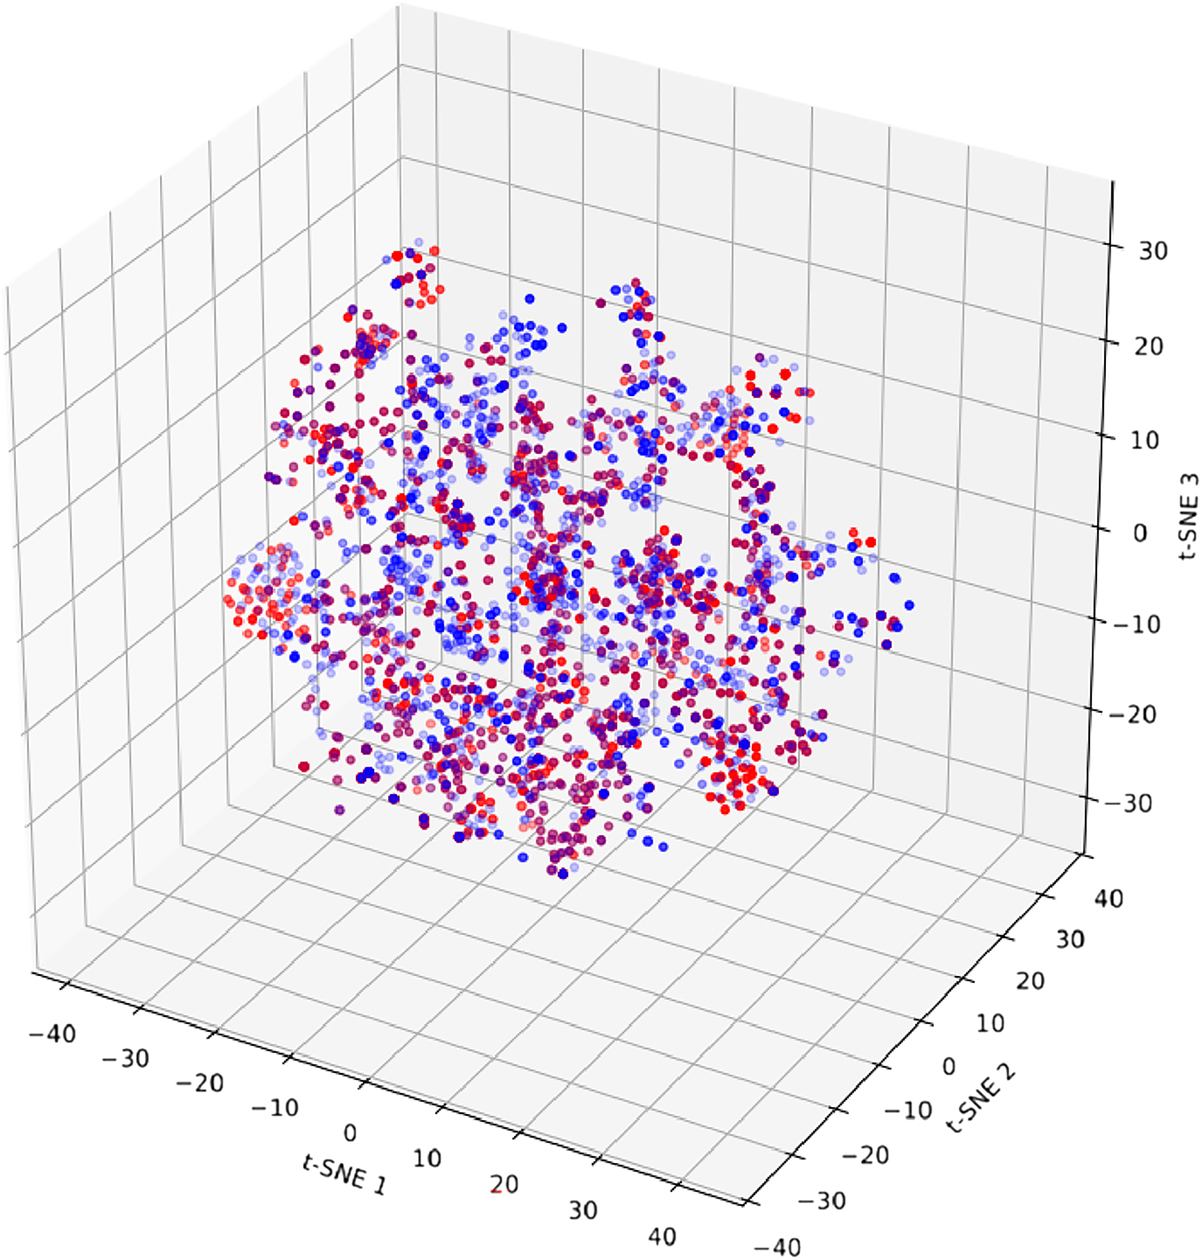
Projections of mixture samples into the space formed by t-SNE1, t-SNE2, and t-SNE3. Blue and red symbols stand for mixtures in the DB database and in the SDB1 dataset, respectively. t-SNE1, t-SNE2 and t-SNE3 are unitless.
Current usage metrics show cumulative count of Article Views (full-text article views including HTML views, PDF and ePub downloads, according to the available data) and Abstracts Views on Vision4Press platform.
Data correspond to usage on the plateform after 2015. The current usage metrics is available 48-96 hours after online publication and is updated daily on week days.
Initial download of the metrics may take a while.