")
")
| Issue |
Sci. Tech. Energ. Transition
Volume 80, 2025
|
|
|---|---|---|
| Article Number | 37 | |
| Number of page(s) | 12 | |
| DOI | https://doi.org/10.2516/stet/2025017 | |
| Published online | 3 juin 2025 | |
Regular Article
Energy optimization and low-carbon development of prefabricated buildings enabled by BIM technology
1
Department of Engineering Management, Sichuan College of Architectural Technology, 4 Jialingjiang West Road, Jingyang District, Deyang, Sichuan 618000, PR China
2
Department of Engineering and Built Environment, SEGi University, No. 9, Jalan Teknologi, Taman Sains Selangor, Kota Damansara PJU 5, 47810 Petaling Jaya, Selangor Darul Ehsan, Malaysia
* Corresponding author: Cette adresse e-mail est protégée contre les robots spammeurs. Vous devez activer le JavaScript pour la visualiser.
Received:
3
March
2025
Accepted:
30
April
2025
Abstract
Against the backdrop of the global energy crisis and climate change, prefabricated buildings, with their high efficiency, energy saving and environmental protection, have become an important direction for the transformation and upgrading of the construction industry. However, despite the promising prospects of Building Information Modeling (BIM) technology and prefabricated buildings in the industry, prefabricated buildings still face many challenges in practical applications, especially in terms of energy efficiency, carbon emission control, and renewable energy integration, which urgently need further optimization. There are still many challenges in the actual application process, and the impact of factors such as government regulatory mechanisms, technical standard formulation, and talent training on the high-quality development of the prefabricated building industry cannot be ignored. Therefore, through literature research, model construction and case analysis, this paper explores the integrated application of BIM and energy management technology in prefabricated buildings, proposes a high-quality development evaluation model based on the Analytical Hierarchy Process (AHP)-fuzzy comprehensive evaluation method, and verifies the effectiveness of the model through the case of prefabricated building projects in Chengdu. The research results show that BIM technology plays an important role in improving the energy efficiency and low-carbon performance of prefabricated buildings. Through the analysis of prefabricated building projects in Chengdu, the feasibility of the model is verified, and strategic measures based on energy optimization are further proposed to promote the prefabricated building industry based on BIM technology to develop in a high-quality, low-carbon, and sustainable direction.
Key words: Prefabricated / Building information modelling / High-quality development assessment / Analytic hierarchy process / Fuzzy comprehensive evaluation method
© The Author(s), published by EDP Sciences, 2025
 This is an Open Access article distributed under the terms of the Creative Commons Attribution License (https://creativecommons.org/licenses/by/4.0), which permits unrestricted use, distribution, and reproduction in any medium, provided the original work is properly cited.
1 Introduction
With the rapid development of industrialization, the problems of high pollution and high consumption in the construction industry are becoming more and more obvious. According to the Annual Development Research Report of China’s Building Energy Conservation (2020), the whole process energy consumption of buildings in China in 2018 was 2.147 billion TCE, accounting for 46.5% of the national energy consumption, and the total carbon emission of the whole process of buildings was 4.93 billion tCO2, accounting for 51.3% of the national carbon emission. In this context, prefabricated buildings, with the advantages of low pollution, high-quality, energy saving and high efficiency, actively respond to the environmental protection concept of green buildings and have gained high attention in the construction industry. By 2020, prefabricated buildings will account for more than 15% of new buildings in China, and the number of key areas has reached more than 20%. Prefabricated buildings have gradually become one of the important directions for the development of architectural structures in China [1].
Prefabricated buildings can promote the development of emerging industries, thus driving economic development, and have been paid attention to by the country’s provinces and cities. Driven by relevant government policies, prefabricated buildings have developed rapidly in recent years. For example, Chengjianfa [2020] No. 35 stipulates that projects with an assembly rate exceeding 50% are eligible for a financial subsidy of 300 yuan/m2. In a typical 10,000 m2 project, this represents a subsidy of up to 3 million yuan, covering approximately 8–12% of total project costs. This policy provides a significant economic incentive for developers to adopt prefabricated and Building Information Modeling (BIM)-integrated construction. And the newly started area of prefabricated buildings has increased rapidly, as shown in Figure 1.
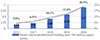 |
Fig. 1 Area of newly started prefabricated buildings from 2016 to 2020. |
However, with the rapid development of the prefabricated construction industry, its focus is on the functional role, while ignoring the quality problems in the development process of the prefabricated construction industry, resulting in many disadvantages. For example, prefabricated buildings lack a complete project management and supervision system, and the related policies and supervision system are not mature [2]. The prefabricated construction project management mode mostly follows the traditional cast-in-place construction management mode, and the communication and management efficiency between various departments is low [3]. The prefabricated construction enterprises lack construction experience and professional personnel in the field of prefabricated construction [4]. The prefabricated buildings lack effective evaluation indicators to identify the quality of prefabricated buildings [5]. Therefore, in the new development stage, it is urgent to take high-quality development as the connotation to guide the development of the prefabricated construction industry.
With the development of the computer industry, the emergence of BIM technology has brought intelligence, information, and visualization to the construction management of prefabricated buildings [6]. According to the “14th Five-Year Construction Industry Development Plan” issued by the Ministry of Housing and Urban-Rural Development in January 2022, it is clearly stated that by 2025, BIM technical standard framework and standard system will be basically formed, data interaction and safety standards will be improved, digital collaboration in all aspects of design, production and construction will be strengthened, and digital deliverability and application of the whole process of engineering construction will be promoted [7]. The advantages of BIM technology are in line with the characteristics of refinement and industrialization required by prefabricated buildings. The use of BIM technology in the construction safety management of prefabricated buildings has a good role in promoting the development of prefabricated buildings [8].
However, the application of BIM technology has not been able to adapt to the huge, prefabricated construction boom. At present, BIM technology is still in the exploration stage in enterprises, and it is difficult for enterprises to obtain corresponding returns from the application process of BIM technology [9]. BIM technology often becomes a gimmick for enterprises to bid, which means that the model is not continuously applied and updated in the implementation process, and the real value of BIM is not realized. At present, BIM technology is mature, and diversified and multi-functional software can meet the application needs. The real dilemma lies in how to use BIM technology. With the rapid development of prefabricated buildings today, a mature BIM technology application system is needed to promote the development of prefabricated buildings and the major reform of the construction method of the construction industry.
This paper makes several significant contributions to the field of prefabricated building development.
-
It proposes a high-quality development evaluation model for prefabricated buildings based on the Analytical Hierarchy Process (AHP)-fuzzy comprehensive evaluation method, offering a theoretical framework to support the industry’s high-quality development.
-
The paper verifies the feasibility of the proposed model through a case study of prefabricated building projects in Chengdu, demonstrating the crucial role of BIM technology in enhancing energy efficiency and low-carbon performance.
-
The paper provides strategic recommendations for promoting the high-quality and low-carbon development of the prefabricated building industry, facilitating the effective integration of BIM technology with energy management practices.
Based on the development status of the prefabricated construction industry based on BIM technology and the connotation of high-quality development, this paper identifies the key factors affecting the high-quality development of the prefabricated construction industry based on BIM technology through literature research and document interpretation and puts forward suggestions for improvement on the high-quality development of the prefabricated construction industry through case analysis and model verification results.
2 Literature review
Prefabricated buildings have been widely used around the world, such as in Japan, Europe, America, and North America [10], due to their advantages in reducing labour demand, reducing environmental impact and improving construction quality [11]. With the rapid development of prefabricated buildings, the demand for prefabricated quality management in the construction industry has increased rapidly, and China’s Ministry of Housing and Urban-Rural Development has proposed that prefabricated buildings should account for more than 50% of new buildings by 2025 [12]. However, the construction technology of prefabricated buildings is more complex than that of traditional buildings, and the quality management of prefabricated buildings is still in its infancy. Liu studied the quality management of prefabricated buildings from the perspective of the construction process and put forward universal quality improvement measures [13]. Ren found that the problems to be solved in prefabricated buildings are to improve regulations and construction techniques and to strengthen quality management with new technologies and standards [14]. Due to the early start of prefabricated buildings in foreign countries, in order to improve the quality of prefabricated buildings, foreign scholars have conducted rich research on their influencing factors and achieved many results. Kylili et al. analyzes factors affecting the quality of prefabricated buildings from the perspective of macro-environment [15]. Faridah et al. analyzed and sorted out the influencing factors affecting the quality of prefabricated buildings through a questionnaire survey and obtained a corresponding evaluation system using the AHP [16]. Some studies start from the construction stage and analyze the quality problems of prefabricated construction from production to assembly.
The above research shows that the current research on the quality of prefabricated buildings is relatively single, and the influencing factors only consider construction, management and policy, so the main factors affecting the high-quality development of prefabricated buildings cannot be comprehensively analyzed. This study is based on the connotation of construction quality management, analyzes on the basis of existing literature, and combines the actual development situation of the prefabricated construction industry to build a high-quality development evaluation model of the prefabricated construction industry, which has theoretical innovation significance for promoting the development of the prefabricated construction industry.
3 Index selection
3.1 Index source
Authoritative databases such as CNKI, Wanfang database, China Science and Technology Journal Database, and Engineering Village were used to search the literature, and the quality influencing factors related to this paper were summarized from the literature.
3.2 Indicator determination
According to the expert interview method and literature analysis, the indicators are refined and summarized into five aspects: policy, economy, technology, environment, and market. Through these indicators, the prefabricated building quality management evaluation index system is obtained, as shown in Table 1.
Quality evaluation index system of prefabricated buildings based on literature research method.
3.3 Index interpretation
See Table 2.
Index interpretation.
Composition of experts by title.
4 Methodology
In the context of this study, the AHP-fuzzy comprehensive evaluation method is chosen due to its strong capability to handle complex, multi-level decision-making problems involving both qualitative and quantitative factors. The assessment of high-quality development in BIM-enabled prefabricated buildings requires the integration of subjective judgments (e.g., policy effectiveness, market recognition, technological maturity) that cannot be fully captured by purely quantitative models. AHP allows for the structured decomposition of the evaluation criteria and derives relative weights based on expert input, while the fuzzy method addresses the inherent uncertainty and ambiguity in qualitative assessments. Compared with methods such as SEM-SDM (Structural Equation Modeling and Structural Data Modeling), which require large-scale objective datasets and focus on modeling variable relationships based on statistical analysis, AHP-fuzzy offers a more practical and adaptable framework for decision-making in scenarios with limited data but rich expert knowledge. SEM-SDM typically relies on extensive datasets to establish direct and indirect relationships between variables, making it more suitable for studies where empirical data is abundant. However, in settings where such data is scarce and expert input is more prominent, the AHP-fuzzy approach becomes a more effective choice.
4.1 AHP
AHP considers complex decision-making problems as a system, decomposes the overall goal into several standard levels, and combines the different standard levels into decision levels [17]. By constructing the decision matrix of each level, the eigenvectors are calculated. Determine the weight of each indicator at each level.
4.1.1 Build the hierarchical model
The first step of the AHP is to determine the evaluation objectives of the problems faced, find out the influencing factors, summarize the influencing factors into different levels, and build a multi-level structure.
The hierarchy of this article is shown in Figure 2.
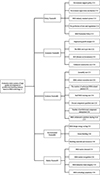 |
Fig. 2 Index hierarchy model of prefabricated building. |
4.1.2 Determine the weight
This paper uses the analytic hierarchy process to determine the index weight. The questionnaire was distributed to relevant technical personnel engaged in prefabricated building research, as well as technical research and development personnel and construction personnel of prefabricated building enterprises. A total of 200 questionnaires were distributed, and invalid questionnaires and those with incomplete information were excluded. There were 177 valid questionnaires and the effective rate was 88.5%. The specific titles are shown in the Table 3.
According to the results of the questionnaire, the weight of each index was obtained. The results are shown in Table 4.
Weighting table for indicators of quality impact factors of assembled buildings.
4.2 Fuzzy comprehensive evaluation method
The fuzzy comprehensive evaluation method is a comprehensive evaluation method based on fuzzy theory [18], which has strong operability and calculation and can be used to evaluate the quality factors. In the case of a lack of qualitative data, more accurate and scientific conclusions can be drawn.
4.2.1 Basic steps of fuzzy comprehensive evaluation method
The fuzzy comprehensive evaluation method is a kind of overall evaluation method based on fuzzy theory, and its basic steps are shown in Table 5.
Basic steps of fuzzy integrated evaluation method.
5 Case study
This paper chooses prefabricated buildings in Chengdu as an evaluation case. Existing prefabricated buildings in Chengdu account for less than one-thousandth of new construction area, which is a small proportion compared to cities such as Beijing, Shanghai, and Shenzhen, but also indicates that the market for prefabricated building development in Chengdu is huge. In 2016, Chengdu, as one of the pilot cities, undertook the task of promoting pilot prefabricated buildings. It proposed that “by 2020, buildings with assembly rate of more than 30% should account for 30% of new buildings; Buildings with an assembly rate of more than 40% and a proportion of new buildings of 50% by 2025 overall target”. Therefore, it is representative and feasible to take Chengdu prefabricated construction industry as a case for value assessment research.
5.1 Evaluation model
5.1.1 Create an evaluation set
According to the actual situation, this paper divides the quality evaluation of the prefabricated construction industry in Chengdu into five levels: {excellent, good, general, poor, unqualified}, that is, the comment set V={excellent, good, general, poor, unqualified}. Among them, the evaluation criteria established by the quantitative indicators after reviewing the relevant data are shown in Table 6.
Quantitative indicators evaluation criteria.
5.1.2 Establish the fuzzy relation matrix of factor set
In this study, Delphi method was used to consult 10 experts of prefabricated construction, and an expert consultation form was issued anonymously to invite them to score the quality influencing factors of Chengdu prefabricated construction industry. The score was 1–5, and the higher the score, the higher the relative impact. The scoring results are shown in Table 7.
Secondary index score table.
According to the evaluation results in Table 8, the fuzzy comprehensive evaluation matrix of the second-level index is obtained as follows:![Mathematical equation: $$ \begin{array}{c}\mathrm{R}1=\left[\begin{array}{ccc}0& 0.7& \begin{array}{cc}0.3& \begin{array}{cc}0& 0\end{array}\end{array}\\ 0& 0.1& \begin{array}{cc}0.3& \begin{array}{cc}0.3& 0.1\end{array}\end{array}\\ \begin{array}{c}0\\ \begin{array}{c}0\\ 0\end{array}\end{array}& \begin{array}{c}0.1\\ \begin{array}{c}0.4\\ 0\end{array}\end{array}& \begin{array}{c}\begin{array}{cc}0.5& \begin{array}{cc}0.4& 0.2\end{array}\end{array}\\ \begin{array}{cc}\begin{array}{c}0.4\\ 0.4\end{array}& \begin{array}{cc}\begin{array}{c}0.2\\ 0.3\end{array}& \begin{array}{c}0\\ 0.3\end{array}\end{array}\end{array}\end{array}\end{array}\right]\mathrm{R}2=\left[\begin{array}{ccc}0& 0& \begin{array}{ccc}1& 0& 0\end{array}\\ 0.1& 0.7& \begin{array}{ccc}0.2& 0& 0\end{array}\\ \begin{array}{c}0\\ 0\end{array}& \begin{array}{c}0\\ 0.1\end{array}& \begin{array}{ccc}\begin{array}{c}1\\ 0.3\end{array}& \begin{array}{c}0\\ 0.4\end{array}& \begin{array}{c}0\\ 0.2\end{array}\end{array}\end{array}\right]\mathrm{R}3=\left[\begin{array}{ccc}0& 1& \begin{array}{cc}0& \begin{array}{cc}0& 0\end{array}\end{array}\\ 0& 1& \begin{array}{cc}0& \begin{array}{cc}0& 0\end{array}\end{array}\\ \begin{array}{c}0\\ 0\\ \begin{array}{c}0\\ 0\\ 0\end{array}\end{array}& \begin{array}{c}0\\ 0\\ \begin{array}{c}1\\ 0\\ 0.3\end{array}\end{array}& \begin{array}{c}\begin{array}{cc}1& \begin{array}{cc}0& 0\end{array}\end{array}\\ \begin{array}{cc}1& \begin{array}{cc}0& 0\end{array}\end{array}\\ \begin{array}{c}\begin{array}{cc}0& \begin{array}{cc}0& 0\end{array}\end{array}\\ \begin{array}{cc}1& \begin{array}{cc}0& 0\end{array}\end{array}\\ \begin{array}{cc}0.7& \begin{array}{cc}0.4& 0\end{array}\end{array}\end{array}\end{array}\end{array}\right]\\ \mathrm{R}4=\left[\begin{array}{cc}0& \begin{array}{ccc}0.2& 0.4& \begin{array}{cc}0.4& 0\end{array}\end{array}\\ \begin{array}{c}0\\ 0\end{array}& \begin{array}{ccc}\begin{array}{c}0\\ 0.2\end{array}& \begin{array}{c}0.6\\ 0.7\end{array}& \begin{array}{c}\begin{array}{cc}0.4& 0\end{array}\\ \begin{array}{cc}0.1& 0\end{array}\end{array}\end{array}\end{array}\right]\mathrm{R}5=\left[\begin{array}{ccc}0& 0.2& \begin{array}{ccc}0.8& 0& 0\end{array}\\ 0& 0.2& \begin{array}{ccc}0.6& 0.2& 0\end{array}\\ \begin{array}{c}0\\ 0\end{array}& \begin{array}{c}0.4\\ 0.2\end{array}& \begin{array}{ccc}\begin{array}{c}0.6\\ 0.7\end{array}& \begin{array}{c}0\\ 0.1\end{array}& \begin{array}{c}0\\ 0\end{array}\end{array}\end{array}\right].\end{array} $$](/articles/stet/full_html/2025/01/stet20250109/stet20250109-eq1.gif)
Secondary indicator evaluation score table.
Factor weight and fuzzy relation matrix synthesis:![Mathematical equation: $$ \mathrm{F}1=\mathrm{W}1\times \mathrm{R}1=(\begin{array}{ccc}0.2493& 0.2105& \begin{array}{cc}0.1848& \begin{array}{cc}0.1332& 0.2222\end{array}\end{array})\end{array}\times \left[\begin{array}{cc}0& \begin{array}{ccc}0.7& 0.3& \begin{array}{cc}0& 0\end{array}\end{array}\\ \begin{array}{c}0\\ 0\\ \begin{array}{c}0\\ 0\end{array}\end{array}& \begin{array}{c}\begin{array}{ccc}0.1& 0.3& \begin{array}{cc}0.3& 0.1\end{array}\end{array}\\ \begin{array}{ccc}0.1& 0.5& \begin{array}{cc}0.4& 0.2\end{array}\end{array}\\ \begin{array}{ccc}\begin{array}{c}0.4\\ 0\end{array}& \begin{array}{c}0.4\\ 0.4\end{array}& \begin{array}{cc}\begin{array}{c}0.2\\ 0.3\end{array}& \begin{array}{c}0\\ 0.3\end{array}\end{array}\end{array}\end{array}\end{array}\right]=(\begin{array}{ccc}0& 0.26732& \begin{array}{cc}0.37764& \begin{array}{cc}0.23037& 0.12467\end{array}\end{array})\end{array} $$](/articles/stet/full_html/2025/01/stet20250109/stet20250109-eq2.gif)
![Mathematical equation: $$ \mathrm{F}2=\mathrm{W}2\times \mathrm{R}2=(\begin{array}{ccc}0.2185& 0.2724& \begin{array}{cc}0.3008& 0.2083\end{array})\end{array}\times \left[\begin{array}{cc}0& \begin{array}{ccc}0& 1& \begin{array}{cc}0& 0\end{array}\end{array}\\ \begin{array}{c}0.1\\ 0\\ 0\end{array}& \begin{array}{c}\begin{array}{ccc}0.7& 0.2& \begin{array}{cc}0& 0\end{array}\end{array}\\ \begin{array}{ccc}0& 1& \begin{array}{cc}0& 0\end{array}\end{array}\\ \begin{array}{ccc}0.1& 0.3& \begin{array}{cc}0.4& 0.3\end{array}\end{array}\end{array}\end{array}\right]=(\begin{array}{ccc}0& 0.26732& \begin{array}{cc}0.37764& \begin{array}{cc}0.23037& 0.12467\end{array}\end{array})\end{array} $$](/articles/stet/full_html/2025/01/stet20250109/stet20250109-eq3.gif)
![Mathematical equation: $$ \mathrm{F}3=\mathrm{W}3\times \mathrm{R}3=(\begin{array}{ccc}0.0589& 0.1840& \begin{array}{cc}0.0926& \begin{array}{cc}0.1731& \begin{array}{cc}0.2576& \begin{array}{cc}0.1059& 0.1279\end{array}\end{array}\end{array}\end{array})\end{array}\times \left[\begin{array}{ccc}0& 1& \begin{array}{cc}0& \begin{array}{cc}0& 0\end{array}\end{array}\\ 0& 1& \begin{array}{cc}0& \begin{array}{cc}0& 0\end{array}\end{array}\\ \begin{array}{c}0\\ 0\\ \begin{array}{c}0\\ 0\\ 0\end{array}\end{array}& \begin{array}{c}0\\ 0\\ \begin{array}{c}1\\ 0\\ 0.3\end{array}\end{array}& \begin{array}{c}\begin{array}{cc}1& \begin{array}{cc}0& 0\end{array}\end{array}\\ \begin{array}{cc}1& \begin{array}{cc}0& 0\end{array}\end{array}\\ \begin{array}{c}\begin{array}{cc}0& \begin{array}{cc}0& 0\end{array}\end{array}\\ \begin{array}{cc}1& \begin{array}{cc}0& 0\end{array}\end{array}\\ \begin{array}{cc}0.7& \begin{array}{cc}0.4& 0\end{array}\end{array}\end{array}\end{array}\end{array}\right]=(\begin{array}{ccc}0& 0.53887& \begin{array}{cc}0.40997& \begin{array}{cc}0.05116& 0\end{array}\end{array})\end{array} $$](/articles/stet/full_html/2025/01/stet20250109/stet20250109-eq4.gif)
![Mathematical equation: $$ \mathrm{F}4=\mathrm{W}4\times \mathrm{R}4=(\begin{array}{ccc}0& \begin{array}{cc}0.6298& \begin{array}{cc}0.2082& 0.1620\end{array}\end{array}& )\end{array}\times \left[\begin{array}{ccc}0& 1& \begin{array}{cc}0& \begin{array}{cc}0& 0\end{array}\end{array}\\ 0& 1& \begin{array}{cc}0& \begin{array}{cc}0& 0\end{array}\end{array}\\ \begin{array}{c}0\\ 0\\ \begin{array}{c}0\\ 0\\ 0\end{array}\end{array}& \begin{array}{c}0\\ 0\\ \begin{array}{c}1\\ 0\\ 0.3\end{array}\end{array}& \begin{array}{c}\begin{array}{cc}1& \begin{array}{cc}0& 0\end{array}\end{array}\\ \begin{array}{cc}1& \begin{array}{cc}0& 0\end{array}\end{array}\\ \begin{array}{c}\begin{array}{cc}0& \begin{array}{cc}0& 0\end{array}\end{array}\\ \begin{array}{cc}1& \begin{array}{cc}0& 0\end{array}\end{array}\\ \begin{array}{cc}0.7& \begin{array}{cc}0.4& 0\end{array}\end{array}\end{array}\end{array}\end{array}\right]=(\begin{array}{ccc}0& 0.15836& \begin{array}{cc}0.49024& \begin{array}{cc}0.3514& 0\end{array}\end{array})\end{array} $$](/articles/stet/full_html/2025/01/stet20250109/stet20250109-eq5.gif)
![Mathematical equation: $$ \mathrm{F}5=\mathrm{W}5\times \mathrm{R}5=(\begin{array}{ccc}0.1516& \begin{array}{cc}0.1284& \begin{array}{cc}0.4011& 0.3189\end{array}\end{array}& )\end{array}\times \left[\begin{array}{ccc}0& 0.2& \begin{array}{ccc}0.8& 0& 0\end{array}\\ 0& 0.2& \begin{array}{ccc}0.6& 0.2& 0\end{array}\\ \begin{array}{c}0\\ 0\end{array}& \begin{array}{c}0.4\\ 0.2\end{array}& \begin{array}{ccc}\begin{array}{c}0.6\\ 0.7\end{array}& \begin{array}{c}0\\ 0.1\end{array}& \begin{array}{c}0\\ 0\end{array}\end{array}\end{array}\right]=(\begin{array}{ccc}0& 0.28022& \begin{array}{cc}0.66221& \begin{array}{cc}0.05757& 0\end{array}\end{array})\end{array}. $$](/articles/stet/full_html/2025/01/stet20250109/stet20250109-eq6.gif)
The final score of the fuzzy comprehensive evaluation vector is usually calculated by the maximum membership principle or the weighted average principle. However, the maximum membership principle often causes information loss, so the weighted average principle is chosen in this paper. After the fuzzy synthesis vector F is processed by the weighted average principle, the final score of each second-level index is obtained, as shown in Table 7.
Finally, according to the second-level index score and weight of the prefabricated construction industry in Chengdu, the comprehensive quality score of the prefabricated construction industry in Chengdu is as follows:
According to the score, it can be seen that the development quality of the prefabricated building industry in Chengdu is between average and good, which is also in line with the actual development situation of prefabricated buildings in Chengdu and proves the desirability of the index evaluation system.
6 Suggestions and countermeasures
Improve the policy support and supervision mechanism, clarify the responsibilities of personnel in relevant positions, and improve the control of the responsible parties on BIM management and prefabricated building quality through clear responsibility division. Establish a quality assurance system and related rules and regulations, and supervise the prefabricated building components transported to the construction site through spot checks. Construct a complete BIM-related legal and standard system and BIM industry standard system. Use BIM for special design of various prefabricated components. At the same time, moderate publicity and promotion of BIM should be carried out to improve the visibility of BIM. To strengthen BIM implementation in prefabricated construction, a university-industry collaboration model is proposed. In this model, government agencies fund up to 50% of joint programs, including training platforms and pilot projects, while enterprises provide technical support and project resources. A representative case is a partnership between Sichuan College of Architectural Technology and local construction firms, which since 2021 has supported BIM training and student involvement in real-world prefabricated projects. While more localized than Tsinghua University’s national-level initiatives, this model demonstrates strong adaptability in third-tier cities.
6.2 Economic factors
In the process of prefabricated construction, the cost of materials, labour and equipment is carefully controlled through BIM technology, and the cost deviation is found and solved in time to improve the engineering profit margin. Choose the right BIM software and tools to ensure that the cost of investment matches the benefit to improve work efficiency. In addition, the experience of projects that have applied BIM technology will be summarized, and cases will be shared, to provide reference for subsequent projects and accelerate the realization of ROI. Standardized and modular design is adopted to optimize the production and installation process of prefabricated building components and reduce unilateral construction costs. BIM technology is used to collect and analyze data during construction and assembly to identify potential cost savings, optimize construction processes, and reduce costs.
For SMEs with annual revenues below ¥5 million, a “BIM Lite” program is proposed. This involves low-cost cloud-based BIM tools (e.g., Trimble Connect, BIM 360 Basic), standard prefabrication modules, and government co-subsidies. A 50% government subsidy for training and software licensing is suggested, with an expected ROI increase of 15–25% for projects under ¥10 million. This initiative ensures BIM inclusivity and avoids the digital marginalization of small players.
6.3 Technical factors
Establish a cooperation platform between enterprises and universities, improve the personnel training mechanism, and carry out professional skills training. Combined with BIM technology and database technology, supervise the whole process of assembly parts in production, transportation and installation. Other advanced technologies, such as Radio Frequency Identification (RFID) and other Internet technologies, are integrated into prefabricated buildings. Virtual technology is used to realise the autonomous identification and information integration of components, and the Internet is used to establish a quality traceability mechanism, to improve the quality management level of prefabricated buildings. While BIM can improve collaboration among stakeholders, real-world applications often encounter interoperability challenges. For example, Revit (commonly used for architectural and MEP design) and Tekla Structures (mostly used for structural steel modelling) may generate incompatible models due to differences in file formats and geometric processing. In some prefabricated construction projects, steel components modelled by Tekla cannot be directly imported into Revit, resulting in misalignment during collision detection. By converting these two models into IFC (Industrial Base Class) format, cross-platform coordination through a unified BIM environment is addressed. In addition, the problem of inconsistent component naming and parameters between platforms is resolved through standardized parameter mapping protocols and validation and attribute integration using tools such as Solibri. For instance, in a pilot public school project in Qingyang District, RFID tags were affixed to prefabricated concrete beams. These tags communicated with the BIM model in real-time using UHF RFID scanners, allowing for automated inventory checks and construction progress tracking. The system achieved ≤5 cm positional accuracy during on-site hoisting, reducing rework incidents by 18%.
6.4 Environmental factors
Embed energy simulation tools such as DesignBuilder (which uses EnergyPlus as its simulation engine) in BIM technology to assess building energy performance at the design stage. Key parameters in the simulation include the U-values of the building envelope (e.g., 0.5 W/m2 · K for external walls), indoor temperature settings (setpoint of 26 °C in summer and 20 °C in winter), lighting power density (10 W/m2), and ventilation rates (0.5 air changes per hour). Designers can simulate and optimize with different design options to find the most energy-efficient solution. Similar research has demonstrated that the integration of EnergyPlus with BIM tools enables accurate prediction and adjustment of energy performance throughout the design phase. At the same time, BIM technology and an intelligent control system are combined to realize intelligent monitoring and optimization of building energy consumption. Using data from BIM models, intelligent control strategies are established to improve the energy efficiency of buildings. Encourage the adoption of international or national green building certification standards, such as LEED, BREEAM, etc. BIM technology can help designers and construction teams better meet the standard requirements of green certification. Integrate ecosystem information, such as vegetation, rainwater harvesting, etc., into the BIM model to achieve better integration with the natural environment and ecological benefits. Establish a BIM library to record and manage building material and component information. Through the BIM library, teams can view material information, performance, and inventory in real-time, avoiding waste and duplicate purchases.
6.5 Market factors
The teaching content of BIM technology is added to the professional education of architecture so that students can contact and master BIM technology from the campus stage. Encourage construction enterprises to promote the application of BIM technology, establish a sharing platform for BIM data in the industry, promote the standardization and interoperability of BIM data, and facilitate the data exchange and use of all parties. Thus, improving public recognition and acceptance, and promoting the development of prefabricated buildings.
Although specific statistical data from the Chengdu Housing Bureau regarding the annual BIM adoption rate in public tenders is not publicly disclosed, relevant policy incentives and local initiatives suggest a notable upward trend. For instance, the Chengjianfa [2020] No. 35 policy provides up to 300 yuan/m2 in subsidies for projects exceeding a 50% prefabrication rate, which often requires the integration of BIM. Moreover, since 2021, local institutions such as the Sichuan College of Architectural Technology have partnered with construction firms to implement BIM training and pilot projects, indicating a growing institutional commitment to BIM. These developments collectively reflect a rising trajectory of BIM adoption in Chengdu’s prefabricated construction sector, even though exact figures remain inaccessible.
7 Conclusion
Government policies, regulatory compliance, supervisory enforcement, standard setting and promotion, and technology and market play a significant role in the development of the prefabricated construction industry and the application of BIM technology. Active policy promotion and effective regulation at the governmental level provide a favourable development environment and safeguards for the prefabricated construction industry, which also promotes the widespread application of BIM technology within the industry. The extensive application of BIM technology implies better data collaboration, enhanced accuracy and consistency in design, and effective management and maintenance of assembled components throughout the design, construction, and operation phases of prefabricated construction. This contributes to improving the quality and efficiency of prefabricated construction and propels the entire industry towards higher-quality development. Concurrently, the high-quality development of the prefabricated construction industry requires a balance between economic benefits and market demand, with government support policies and regulatory mechanisms being crucial for reducing costs, enhancing competitiveness, and expanding market demand. Furthermore, as technological innovation continues to advance, the prefabricated construction industry will place greater emphasis on the transformation towards intelligence and digitization to meet the development needs of the future construction market.
Funding
The authors received no financial support for the research, authorship, and/or publication of this article.
Conflicts of interest
The authors declared no potential conflicts of interest with respect to the research, authorship, and/or publication of this article.
Data availability statement
The datasets used and/or analyzed during the current study are available from the corresponding author upon reasonable request.
References
- Li Y, Li F, Zou Yu, Ma X, Lv Z, Wu X (2016) Construction safety and quality assessment of prefabricated concrete buildings, Build. Technol 47, 4, 305–309. https://doi.org/10.13731/j.issn.1000-4726.2016.04.004. [Google Scholar]
- Wang P (2019) Analysis of engineering project management and development of prefabricated buildings, Green Build. Mater. 6, 185–186. https://doi.org/10.16767/j.cnki.10-1213/tu.2019.06.139. [CrossRef] [Google Scholar]
- Ding S (2021) Research on the project management mode of the whole industry chain of prefabricated buildings based on BIM, Constr. Econ. 42, 8, 67–71. https://doi.org/10.14181/j.cnki.1002-851x.202108067. [Google Scholar]
- Chen K (2020) Analysis of problems and countermeasures in the development of prefabricated buildings, Econ. Res. Guide 9, 191–193+197. [Google Scholar]
- Li T, You X (2022) Analysis of factors affecting the quality of prefabricated buildings based on Apriori, Tongji Univ. Nat. Sci. Ed. 50, 2, 147–152. [Google Scholar]
- An XH, Li YY, Lu JJ, et al. (2025) BIM+MES-based information management platform for prefabricated buildings, Brick Tile 2025, 4, 124–126+129. https://doi.org/10.16001/j.cnki.1001-6945.2025.04.027. [Google Scholar]
- Zhang JX, Yin ML, Ouyang HY, Wang ZX (2024) Intelligent construction system architecture and development pathways, Constr. Technol. 53, 19, 1–7. [Google Scholar]
- Cheng Y, Zhou BY, Zhang LW, Xie Y (2024) Application of BIM technology in refined management of prefabricated building construction process, Sichuan Cement 2024, 8, 106–108. [Google Scholar]
- Zhu XY, Peng YW (2025) Construction of digital management mode for prefabricated buildings based on BIM, Shanghai Real Estate 2025, 2, 26–29. https://doi.org/10.13997/j.cnki.cn31-1188/f.2025.02.007. [Google Scholar]
- Li XJ (2020) Research on investment risk influence factors of prefabricated building projects, J. Civil Eng. Manag. 26, 7, 599–613. https://doi.org/10.3846/jcem.2020.12917. [CrossRef] [Google Scholar]
- Ng A, Loosemore M (2007) Risk allocation in the private provision of public infrastructure, Int. J. Proj. Manag. 25, 1, 66–76. https://doi.org/10.1016/j.ijproman.2006.06.005. [CrossRef] [Google Scholar]
- Li XJ, Wang C, Mukhtar AK, Hamed HA, Samuel B (2022) Evaluation method for quality risks of safety in prefabricated building construction using SEM-SDM approach, Int. J. Environ. Res. Public Health 19, 9, 5180. https://doi.org/10.3390/IJERPH19095180. [CrossRef] [Google Scholar]
- Liu X (2020) Prefabricated construction process quality influence factors evaluation and application research on, Master’s Degree Thesis, Xihua University. https://doi.org/10.27411/d.cnki.gscgc.2020.000528. [Google Scholar]
- Ren X (2018) BIM-based prefabricated building quality management, Sichuan Cement 4, 202–204. [Google Scholar]
- Kylili A, Fokaides PA, Christou P, Kalogirou SA (2014) Infrared thermography (IRT) applications for building diagnostics: a review, Appl. Energy 134, 531–549. https://doi.org/10.1016/j.apenergy.2014.08.005. [CrossRef] [Google Scholar]
- Faridah I, Norazian MY, Har EAB (2012) Management factors for successful IBS projects implementation, Procedia Soc. Behav. Sci. 68, 99–107. https://doi.org/10.1016/j.sbspro.2012.12.210. [CrossRef] [Google Scholar]
- Han B, Liu X, Wang G, Guo B (2019) System reliability evaluation of prefabricated RC hollow slab bridges considering hinge joint damage based on modified AHP, Appl. Sci. 9, 22, 4841. https://doi.org/10.3390/app9224841. [CrossRef] [Google Scholar]
- Zhou Y, Cai J, Xu Y, Wang Y, Jiang C, Zhang Q (2021) Operation performance evaluation of green public buildings with AHP-fuzzy synthetic assessment method based on cloud model, J. Build. Eng. 42, 102775. https://doi.org/10.1016/J.JOBE.2021.102775. [CrossRef] [Google Scholar]
All Tables
Quality evaluation index system of prefabricated buildings based on literature research method.
All Figures
|
Fig. 1 Area of newly started prefabricated buildings from 2016 to 2020. |
| In the text | |
|
Fig. 2 Index hierarchy model of prefabricated building. |
| In the text | |
Current usage metrics show cumulative count of Article Views (full-text article views including HTML views, PDF and ePub downloads, according to the available data) and Abstracts Views on Vision4Press platform.
Data correspond to usage on the plateform after 2015. The current usage metrics is available 48-96 hours after online publication and is updated daily on week days.
Initial download of the metrics may take a while.