")
")
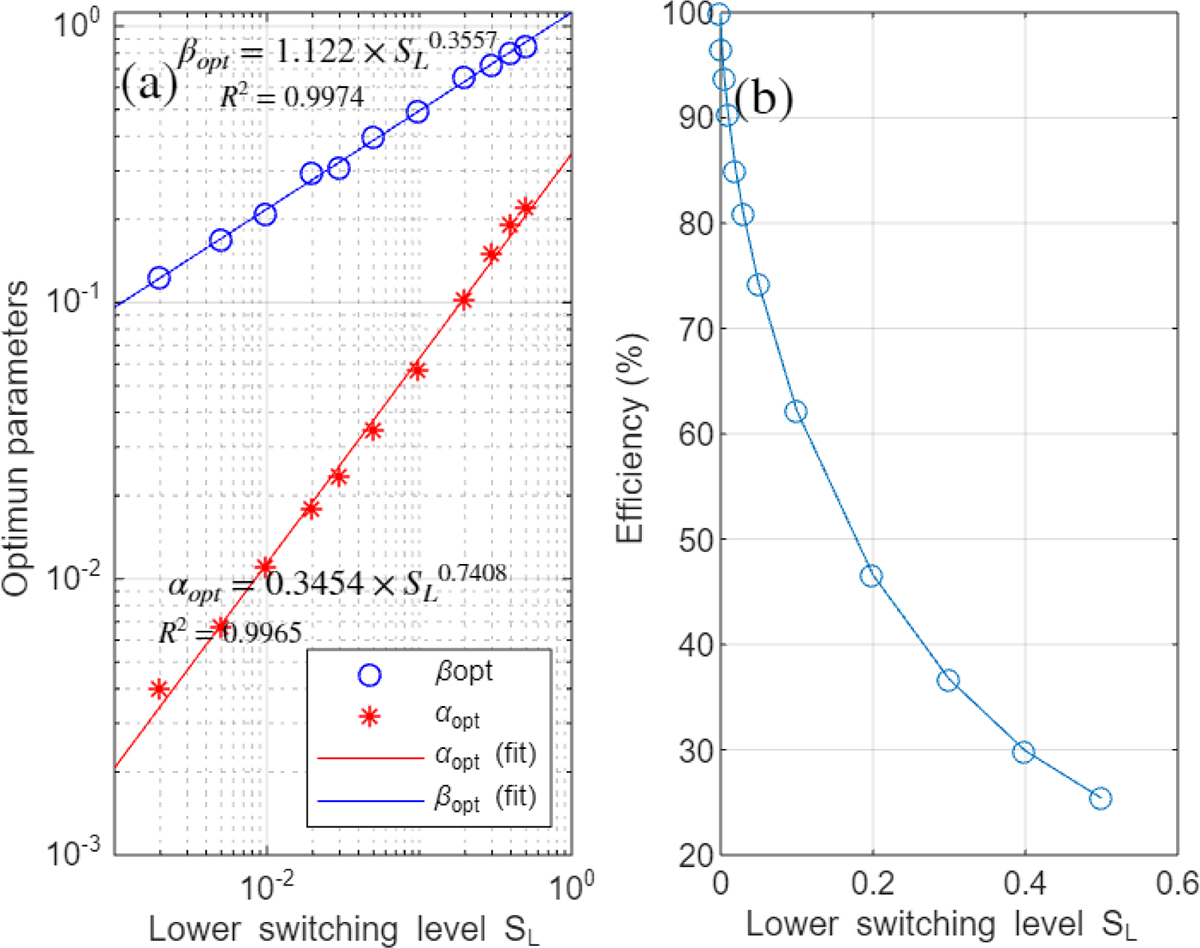
Fig. 7
Download original image
a) Evolution of the optimum parameters αopt and βopt as a function of the lower switching level SL. The relationships between optimum parameters and SL are obtained from the linear fit of the data in the log-log plot. b) Evolution of the optimum efficiency ηopt as a function of the lower switching level SL.
Current usage metrics show cumulative count of Article Views (full-text article views including HTML views, PDF and ePub downloads, according to the available data) and Abstracts Views on Vision4Press platform.
Data correspond to usage on the plateform after 2015. The current usage metrics is available 48-96 hours after online publication and is updated daily on week days.
Initial download of the metrics may take a while.