")
")
| Issue |
Sci. Tech. Energ. Transition
Volume 81, 2026
|
|
|---|---|---|
| Article Number | 12 | |
| Number of page(s) | 20 | |
| DOI | https://doi.org/10.2516/stet/2026011 | |
| Published online | 10 April 2026 | |
Regular Article
An adaptive NRLF with PQV and P/Q buses for loss minimization and voltage stability improvement of optimally reconfigured and DG integrated radial distribution systems
1
Department of Electrical Engineering, IIT (BHU) Varanasi, Varanasi 221005, UP, India
2
Department of Electrical Engineering, Rajkiya Engineering College, Ambedkar Nagar, UP 224122, India
3
Department of Electrical Engineering, Government Engineering College, Siwan, Bihar 841226, India
* Corresponding author: This email address is being protected from spambots. You need JavaScript enabled to view it.
Received:
20
November
2024
Accepted:
12
February
2026
Abstract
This paper proposes an adaptive Newton-Raphson Load Flow (NRLF) method and a multi-objective function for loss minimization and Voltage Stability (VS) enhancement of Radial Distributed System (RDS) in the presence of PQV and P/Q buses. Enhancement in VS of the network is presented in terms of maximum loadability. In the presence of two novel sets of buses, generation bus (i.e., P/Q-bus) and remotely controlled bus (i.e., PQV-bus), optimal DG integration and network reformation in RDS is also presented in this paper. The specified or known quantity for the P/Q bus is only active/reactive power generation. For the PQV bus, the known quantities are Watt and VAr power generations together with the voltage magnitude to be maintained by the generation bus (i.e., P/Q-bus). A multi-objective function is proposed here for P/Q-bus selection, optimal DG integration, and network reformation of RDS. Simulations have been carried out on IEEE 33-bus and 69-bus RDS to demonstrate the effectiveness of the proposed method. Also, the simulation findings are compared with those of relevant peers in the literature to justify the validity of the proposed work.
Key words: NRLF / PQV and P/Q buses / DG / RDS / Maximum loadability
© The Author(s), published by EDP Sciences, 2026
 This is an Open Access article distributed under the terms of the Creative Commons Attribution License (https://creativecommons.org/licenses/by/4.0), which permits unrestricted use, distribution, and reproduction in any medium, provided the original work is properly cited.
1 Introduction
Power system utilities continuously serve the demanded load by distribution system end customers. The existing network infrastructure faces several challenges during planning and operation because of many technical and economic constraints, such as higher network losses, lower voltage stability, and thermal overloading of the lines. Voltage stability is a critical factor in maintaining a system’s security [1]. Increasing load growth in the distribution network may lead to greater voltage instability. This incident may lead to voltage collapse and thus power blackouts in a certain or whole part of the power system network. Additional power injection through integrated renewable Distributed Generation (DG) on a small scale located near the load centers seems to be an effective measure for maintaining voltage stability [2]. Distribution systems, in general, are branched in nature, and current flows from the substation downstream to the end node; hence, a significant amount of increasing voltage drop results in a lower voltage level at the end node, limiting the loadability of that bus as well as the overall system [3]. At the maximum load level, buses would experience a drastic voltage drop, threatening to compromise the system security in terms of voltage stability. The presence of DGs has a great mitigation effect on these challenges. These DGs not only improve system performance but also prove to be the key remedial solution against voltage insecurity if planned properly. The location and size of these resources for planning and execution of the power network are very important in terms of power loss minimization, voltage profile enhancement, maintenance of network security, and other key features. Furthermore, the proper penetration of renewables leads to economic and environmentally friendly solutions over the traditional centralized generation [4].
Voltage stability has been improved by identifying the weakest bus prone to voltage collapse and allocating reactive power compensation at this bus with a novel reactive loss index and fuzzy logic approach [5]. Load factor sensitivity-based Static VAr Compensator placement has been done in [6] to improve the system voltage stability. A sensitivity-based, various DG-type allocation has been investigated in [7] for the enhancement of system loadability with the help of Particle Swarm Optimization (PSO). Maximum loadability in terms of voltage stability limit has been enhanced through renewable DG by allocating optimally within the distribution system [8]. Considering apparent losses and loadability, an index has been proposed in [9] to optimally locate the DG in a voltage-stressed distribution system. DG placement at a growing load has been optimized with the objective to improve voltage stability margin based on a voltage stability index [10]. In another work [11], a practical Japanese test system has been selected to improve the maximum loadability of the system by introducing solar and wind energy-based DGs. The hybrid of PSO and the differential evolutionary algorithm has been presented in [12] to reduce the system losses and improve maximum loadability. In [13] and [14], the impact of optimal DG integration on system loadability, losses, voltage stability, and voltage profile has been tested using an analytical approach. A wind-based Squirrel Cage Induction Generator (SCIG) with a permanently connected capacitor is installed to enhance the voltage collapse index and voltage profile [15]. In [16] authors minimize the IEEE 33 and 69 bus network power loss using a novel hybrid approach, a hybrid of the Plant Growth Simulation (PGS) Algorithm and PSO in the presence of Type-1 and Type-IV DGs. An optimal coordinated operation of volt control devices, distribution network reconfiguration, and photovoltaic inverter for loss reduction and energy saving is proposed in [17] using the Binary Grey Wolf Optimization Algorithm (BGWO).
Altering the network topology by opening and closing the switches and transferring the load to other feeder paths is termed reconfiguration [18, 19]. Different combinations of industrial, commercial, and residential loads are apparent in distribution systems. These loads keep varying at different times of day, month, and year. In such a case, load scheduling by altering the topology may be achieved more efficiently, which leads to reduced losses and improved voltage stability of the system [20, 21]. Network reconfiguration is a fundamental tool to enhance the system performance during the operation of systems such as load balancing, loadability enhancement, voltage profile enhancement, and loss minimization [22, 23]. Loadability enhancement and VAr loss minimization using the solution obtained in the first stage, employing network reformation, has been proposed [24]. A fuzzy rule-based genetic optimization has been presented to improve the VS of a newly reconfigured network [25]. A discrete Artificial Bee Colony approach for loadability improvement of the system based on the Continuation Power Flow (CPF) has been presented in [26, 27]. An efficient multi-objective ɛ-constraints optimizer known as a teaching and learning algorithm is used to enhance the maximum loadability and reduce power loss by altering the topology of the network and placing DGs [28]. Authors in [29] build a general framework for optimal DG integration in a real distribution network to bring sustainability and resilient planning synergy. In [30], a demand response-based optimal planning of DGs and energy storage devices has been proposed by the authors to ensure the financial benefits of both consumers and distribution system operators. Authors in [31] proposed an advanced approach for optimal DG integration in distribution networks for minimizing power loss, voltage deviation, and maximizing system stability and reliability.
A conventional power system usually consists of PQ and PV buses apart from the slack bus. In recent years, researchers have worked on systems with the presence of novel sets of buses known as P, Q, and PQV buses. A P bus has only pre-defined real power generation, but unknown VAr power generation, and a voltage phasor. Similar to the P bus, a Q bus has pre-defined reactive power generation but unknown real power generation, voltage magnitude, and angle. A PQV bus has a voltage angle as the only unknown, and the remaining three quantities are predefined. The voltage magnitude at the PQV bus may be regulated through variation of known quantities at the P bus and/or Q bus. In order to regulate the voltage magnitude of the PQV bus, a P bus is equipped with a variable reactive power source, whereas a Q bus is equipped with a variable real power source [32–34].
The PQV bus was selected based on a criterion of being the farthest bus with the lowest voltage magnitude. For the selection of a P bus in the presence of a PQV bus, the optimization procedure is performed with the connection of a shunt capacitor/reactive power injection device (since at the P bus, reactive power is an unknown variable) to each bus considered at a time. The bus that results in the minimum value of the fitness function with placement of the shunt capacitor/ reactive power injection device is selected as P bus. Similarly, for the selection of a Q bus in the presence of a PQV bus, the optimization procedure is performed with the connection of a Type-1 DG/active power injection device (since at the Q bus, active power is an unknown variable) at each bus considered at a time. The bus that results in the minimum value of the fitness function with placement of Type-1 DG/active power injection device is selected as the Q bus.
In recent works, DG placement and network reconfiguration have been considered in a system employing P and PQV buses for loss minimization [35, 36]. Loss minimization together with voltage stability enhancement has been considered in a system having P and PQV buses [37] through optimal network reconfiguration and DG placement.
1.1 Research gaps and contribution
It has been seen from the literature that very few attempts seem to be made in voltage stability enhancement through voltage magnitude regulation of PQV bus by varying VAr power at P buses. No attempt seems to be made in voltage stability enhancement through regulating the voltage magnitude at the PQV bus by varying the Watt power at the Q bus. The main contributions of this work are:
-
Voltage Stability Margin (VSM) improvement in terms of maximum loadability through regulation of voltage of a remote PQV bus by variable reactive power injection at P bus and variable real power injection at Q bus is proposed.
-
A new multi-objective function comprising a weighted sum of voltage stability margin and power loss is proposed. The proposed multi-objective function is optimized to get minimum power loss and maximum voltage stability margin. Optimization is performed through the Grey Wolf Optimization (GWO) algorithm [38], considering DG size, DG location, and branches to be opened for network reconfiguration as decision variables.
The paper has been structured as follows: Section 2 formulated an objective function for loss minimization and voltage stability enhancement under a set of system operating conditions. Section 3 presents the definition of new bus types and elaborates on the concept of solving Newton–Raphson Load Flow (NRLF) through modification in the Jacobian matrix, considering P/Q and PQV buses. Section 4 presents the methodology to improve the loadability of the network by optimal network reconfiguration and DG integration. Simulations are presented in Section 5, and finally, Section 6 concludes with the research findings of the paper.
2 Objective function and constraints
The present work has proposed a new multi-objective function that has been minimized for a reconfigured distribution network under optimally placed DG with P/Q and PQV buses. Results obtained on multi-objective functions proposed in this work have been compared with the results obtained in [37]. The optimization has been performed using a modified grey wolf optimization approach [38].
2.1 Proposed objective function
Real power loss ( ) has been considered as the first objective function
  that has been minimized using
![Mathematical equation: $$ \mathrm{minimize}\left[{f}_1=\enspace {P}_{{loss}}=\sum_{i=1}^bs{w}_i\left[{I}_i^2{R}_i\right]\right],\enspace $$](/articles/stet/full_html/2026/01/stet20240426/stet20240426-eq3.gif) (1)
(1)
where, Ii, Ri, and b are the ith branch current, resistance, and total branches of the network, respectively. The binary variable swi represents the switch status of branch-i with 1 and 0 representing closed and open status, respectively.
Quality Load Index (QLI) presented in [31] has been considered here for calculating the maximum loadability of the network. The maximum loadability of a system depends upon its current loading. A lightly loaded system is expected to have a higher loading margin compared to a heavily loaded one. The base case voltage at buses may also determine its maximum loadability, as a bus with a higher voltage magnitude may have more distance from the maximum loading point compared to a bus having a lower voltage magnitude. Therefore, the present work has considered QLI as the second objective function f2 to maximize voltage stability margin through maximum loadability enhancement as given below:![Mathematical equation: $$ \mathrm{maximize}\enspace \left[{f}_2={QLI}=\sum_{i=1}^{{nb}}\left[{P}_{{load},i}{V}_i\right]\right], $$](/articles/stet/full_html/2026/01/stet20240426/stet20240426-eq4.gif) (2)
(2)
where, Pload,i and Vi are the real power demand and voltage magnitude at bus-i, and nb represents the total number of buses in the network.
The two objective functions have been combined to form a single multi-objective function g. The minimization of the proposed new multi-objective function considers the minimization of real power loss in the network and ensures loadability enhancement by supplying the maximum amount of quality load to the consumers at an enhanced voltage magnitude. The proposed new multi-objective function is minimized using![Mathematical equation: $$ \mathrm{minimize}\enspace \left[g=\enspace {w}_1{f}_1-{w}_2{f}_2\right], $$](/articles/stet/full_html/2026/01/stet20240426/stet20240426-eq5.gif) (3)
(3)
 (4)
(4)
where, w1 and w2 represent weight assigned to f1 and f2, respectively. The new multi-objective function considers both the real power loss reduction as well as the voltage stability margin enhancement. The proposed multi-objective function given by (3) is minimized for optimal network reformation and DG integration in RDS with P/Q and PQV buses subjected to various constraints. The effectiveness of the proposed multi-objective function is tested by comparing results with results obtained by minimization of multi-objective function proposed in [37] as,![Mathematical equation: $$ \mathrm{minimize}\enspace \left[f={w}_1{f}_1-{w}_2{f}_3\right], $$](/articles/stet/full_html/2026/01/stet20240426/stet20240426-eq7.gif) (5)
(5)
where,![Mathematical equation: $$ {f}_3={DVS}{I}_{{system}}=\sum_{i=1}^{{nb}}\left[{VS}{I}_i\right], $$](/articles/stet/full_html/2026/01/stet20240426/stet20240426-eq8.gif) (6)
(6)
where, (7)
(7)
DVSIsystem defined by (6) represents the Voltage Stability Index for the whole distribution system, whereas VSIi given by (7) represents the Voltage Stability Index for the bus-i [39].
2.2 Constraints
2.2.1 Equality constraints of power balance:
 (8)
(8)
 (9)
(9)
where,  are Watt and VAr power supplied by the grid, respectively. Pload,i, Qload,i are the Watt and VAr demand, respectively, at ith bus and Ploss,i, Qloss,i are Watt and VAr power losses, respectively, in ith branch. PDG,i, QDG,i are Watt and VAr, respectively, supplied by ith DG, Qsh represents the VAr injected at P bus by a variable VAr source, PQbus represents the Watt power injected by a variable real power source at Q bus, and ndg is the number of DGs available.
In this work, only one P bus and only one Q bus have been considered to regulate the voltage magnitude of the PQV bus. However, the work may be extended to consider multiple numbers of P and Q buses. Also, placement of one additional DG (apart from the DG at the Q bus) at an optimal location is considered in this work in case of loss minimization and voltage stability enhancement under the Q, PQV bus pair.
2.2.2 Inequality constraints of DG size and system operation:
 (10)
(10)
 (11)
(11)
 (12)
(12)
 (13)
(13)
 (14)
(14)
 (15)
(15)
Where equation (10) represents the maximum Watt power generated by the Type-1 DG, which should be less than or equal to the sum of the total load and loss of the network. Similarly, equation (11) shows the maximum VAr power generation limit for Type-2 DG. Equations (14) and (15) represent the volt and Ampere limits for each bus of the network.
2.2.3 Radiality constraint
Radiality of the reconfigured network must be ensured without letting any load bus be disconnected from the system. (16)
(16)
3 An adaptive NRLF with PQV and P/Q buses
3.1 Types of buses for NRLF studies
Conventional Newton–Rapson Load Flow (NRLF) method considers three types of buses (viz., slack bus, P bus, and Q bus). However, the modified NRLF presented in this work considered additional bus types- P bus, Q bus, and PQV bus. The specified and unknown quantities at different types of buses are given in Table 1.
Types of buses.
3.2 Jacobian matrix for an adaptive NRLF with PQV and Q buses
Inclusion of the Q and PQV bus pair in the system needs to update the Jacobian matrix for solving the Newton–Raphson load flow. Here, the voltage of the PQV bus is regulated by the Watt power injection at the Q bus. A Q bus is equipped with a controllable real power source, with its real power generation not pre-specified, and fixed reactive power generation. In this work, the Q bus is considered to be connected to a variable real power source, only, and therefore, VAr power generation at the Q bus is considered zero here. Hence, the Watt power generation at the Q bus needs to be solved as a state variable. The concept of Q and PQV buses has been explained through a 5 bus system in Figure 1 with bus-3 and bus-5 considered as the Q bus, and PQV bus, respectively. Since the real power at the Q bus is not known, hence ∆P3 at Q bus-3 is removed from the mismatch vector. For the system having bus-3 as the Q bus to control the voltage of PQV bus-5, the augmented set of equations for corrections and mismatches take the form given by (17) and (18).![Mathematical equation: $$ \mathbf{\Delta V}=\left[\begin{array}{ccc}{\Delta V}_2& {\mathrm{\Delta V}}_3& {\mathrm{\Delta V}}_4\end{array}\right], $$](/articles/stet/full_html/2026/01/stet20240426/stet20240426-eq21.gif) (17)
(17)
![Mathematical equation: $$ \mathbf{\Delta }{P}=\left[\begin{array}{ccc}\Delta {P}_2& \Delta {P}_4& \Delta {P}_5\end{array}\right]. $$](/articles/stet/full_html/2026/01/stet20240426/stet20240426-eq22.gif) (18)
(18)
 |
Figure 1 Five bus network with novel Q, PQV bus pair. |
Let, (19)
(19)
where,![Mathematical equation: $$ {Y}={[\begin{array}{cc}\Delta {P}_2& \Delta {P}_4\end{array}\enspace \Delta {P}_5\enspace \Delta {Q}_2\enspace \Delta {Q}_3\enspace \Delta {Q}_4\enspace \Delta {Q}_5]}^T, $$](/articles/stet/full_html/2026/01/stet20240426/stet20240426-eq24.gif) (20)
(20)
![Mathematical equation: $$ {X}={[\begin{array}{cc}{\mathrm{\Delta \delta }}_2& {\mathrm{\Delta \delta }}_3\end{array}{\enspace \mathrm{\Delta \delta }}_4{\enspace \mathrm{\Delta \delta }}_5{\enspace \mathrm{\Delta V}}_2{\enspace \mathrm{\Delta V}}_3{\enspace \mathrm{\Delta V}}_4]}^T, $$](/articles/stet/full_html/2026/01/stet20240426/stet20240426-eq25.gif) (21)
(21)
![Mathematical equation: $$ {J}=\left[\begin{array}{c}\frac{{{\partial P}}_2}{\partial {\delta }_2}\enspace \frac{{{\partial P}}_2}{\partial {\delta }_3}\enspace \frac{{{\partial P}}_2}{\partial {\delta }_4}\enspace \frac{{{\partial P}}_2}{\partial {\delta }_5}\enspace \frac{{{\partial P}}_2}{\partial {V}_2}\enspace \frac{{{\partial P}}_2}{\partial {V}_3}\enspace \frac{{{\partial P}}_2}{\partial {V}_4}\\ \frac{{{\partial P}}_4}{\partial {\delta }_2}\enspace \frac{{{\partial P}}_4}{\partial {\delta }_3}\enspace \frac{{{\partial P}}_4}{{{\partial \delta }}_4}\enspace \frac{{{\partial P}}_4}{{{\partial \delta }}_5}\enspace \frac{{{\partial P}}_4}{{{\partial V}}_2}\enspace \frac{\partial {P}_4}{{{\partial V}}_3}\enspace \frac{{{\partial P}}_4}{\partial {V}_4}\\ \frac{{{\partial P}}_5}{{{\partial \delta }}_2}\enspace \frac{{{\partial P}}_5}{{{\partial \delta }}_3}\enspace \frac{{{\partial P}}_5}{{{\partial \delta }}_4}\enspace \frac{{{\partial P}}_5}{{{\partial \delta }}_5}\enspace \frac{{{\partial P}}_5}{{{\partial V}}_2}\enspace \frac{{{\partial P}}_5}{{{\partial V}}_3}\enspace \frac{{{\partial P}}_5}{{{\partial V}}_4}\\ \frac{{{\partial Q}}_2}{{{\partial \delta }}_2}\enspace \frac{{{\partial Q}}_2}{{{\partial \delta }}_3}\enspace \frac{{{\partial Q}}_2}{{{\partial \delta }}_4}\enspace \frac{{{\partial Q}}_2}{{{\partial \delta }}_5}\enspace \frac{{{\partial Q}}_2}{\partial {V}_2}\enspace \frac{{{\partial Q}}_2}{{{\partial V}}_3}\enspace \frac{{{\partial Q}}_2}{\partial {V}_4}\\ \frac{{{\partial Q}}_3}{{{\partial \delta }}_2}\enspace \frac{{{\partial Q}}_3}{{{\partial \delta }}_3}\enspace \frac{{{\partial Q}}_3}{{{\partial \delta }}_4}\enspace \frac{{{\partial Q}}_3}{{{\partial \delta }}_5}\enspace \frac{{{\partial Q}}_3}{\partial {V}_2}\enspace \frac{{{\partial Q}}_3}{{{\partial V}}_3}\enspace \frac{{{\partial Q}}_3}{\partial {V}_4}\\ \frac{{{\partial Q}}_4}{{{\partial \delta }}_2}\enspace \frac{{{\partial Q}}_4}{{{\partial \delta }}_3}\enspace \frac{{{\partial Q}}_4}{{{\partial \delta }}_4}\enspace \frac{{{\partial Q}}_4}{{{\partial \delta }}_5}\enspace \frac{{{\partial Q}}_4}{{{\partial V}}_2}\enspace \frac{{{\partial Q}}_4}{{{\partial V}}_3}\enspace \frac{{{\partial Q}}_4}{{{\partial V}}_4}\\ \frac{{{\partial Q}}_5}{{{\partial \delta }}_2}\enspace \frac{{{\partial Q}}_5}{\partial {\delta }_3}\enspace \frac{{{\partial Q}}_5}{{{\partial \delta }}_4}\enspace \frac{\partial {Q}_5}{{{\partial \delta }}_5}\enspace \frac{{{\partial Q}}_5}{{{\partial V}}_2}\enspace \frac{\partial {Q}_5}{{{\partial V}}_3}\enspace \frac{{{\partial Q}}_5}{{{\partial V}}_4}\end{array}\right]. $$](/articles/stet/full_html/2026/01/stet20240426/stet20240426-eq26.gif) (22)
(22)
With the above modification in the NRLF equation, unknown voltage magnitudes and angles are calculated to find real power injection at Q bus-3 as follows:![Mathematical equation: $$ {\mathrm{P}}_3=\mathrm{Re}\left[{\bar{V}}_3^{\mathrm{*}}\sum_{j=1}^5{\bar{y}}_{3j}{\bar{V}}_j\right]. $$](/articles/stet/full_html/2026/01/stet20240426/stet20240426-eq27.gif) (23)
(23)
In conventional load flow with bus-1 as slack bus and remaining buses as PQ buses, the Jacobian matrix (J
old
) was:![Mathematical equation: $$ {{J}}^{{old}}=\left[\begin{array}{c}\frac{{{\partial P}}_2}{\partial {\delta }_2}\enspace \frac{{{\partial P}}_2}{\partial {\delta }_3}\enspace \frac{{{\partial P}}_2}{\partial {\delta }_4}\enspace \frac{{{\partial P}}_2}{\partial {\delta }_5}\enspace \frac{{{\partial P}}_2}{\partial {V}_2}\enspace \frac{{{\partial P}}_2}{\partial {V}_3}\enspace \frac{{{\partial P}}_2}{\partial {V}_4}\enspace \frac{{{\partial P}}_2}{\partial {V}_5}\\ \frac{{{\partial P}}_3}{\partial {\delta }_2}\enspace \frac{{{\partial P}}_3}{\partial {\delta }_3}\enspace \frac{{{\partial P}}_3}{\partial {\delta }_4}\enspace \frac{{{\partial P}}_3}{\partial {\delta }_5}\enspace \frac{{{\partial P}}_3}{\partial {V}_2}\enspace \frac{{{\partial P}}_3}{\partial {V}_3}\enspace \frac{{{\partial P}}_3}{\partial {V}_4}\enspace \frac{{{\partial P}}_3}{\partial {V}_5}\\ \frac{{{\partial P}}_4}{\partial {\delta }_2}\enspace \frac{{{\partial P}}_4}{\partial {\delta }_3}\enspace \frac{{{\partial P}}_4}{{{\partial \delta }}_4}\enspace \frac{{{\partial P}}_4}{{{\partial \delta }}_5}\enspace \frac{{{\partial P}}_4}{{{\partial V}}_2}\enspace \frac{\partial {P}_4}{{{\partial V}}_3}\enspace \frac{{{\partial P}}_4}{\partial {V}_4}\enspace \frac{{{\partial P}}_4}{\partial {V}_5}\\ \frac{{{\partial P}}_5}{{{\partial \delta }}_2}\enspace \frac{{{\partial P}}_5}{{{\partial \delta }}_3}\enspace \frac{{{\partial P}}_5}{{{\partial \delta }}_4}\enspace \frac{{{\partial P}}_5}{{{\partial \delta }}_5}\enspace \frac{{{\partial P}}_5}{{{\partial V}}_2}\enspace \frac{{{\partial P}}_5}{{{\partial V}}_3}\enspace \frac{{{\partial P}}_5}{{{\partial V}}_4}\enspace \frac{{{\partial P}}_5}{{{\partial V}}_4}\\ \frac{{{\partial Q}}_2}{{{\partial \delta }}_2}\enspace \frac{{{\partial Q}}_2}{{{\partial \delta }}_3}\enspace \frac{{{\partial Q}}_2}{{{\partial \delta }}_4}\enspace \frac{{{\partial Q}}_2}{{{\partial \delta }}_5}\enspace \frac{{{\partial Q}}_2}{\partial {V}_2}\enspace \frac{{{\partial Q}}_2}{{{\partial V}}_3}\enspace \frac{{{\partial Q}}_2}{\partial {V}_4}\enspace \frac{{{\partial Q}}_2}{\partial {V}_5}\\ \frac{{{\partial Q}}_3}{{{\partial \delta }}_2}\enspace \frac{{{\partial Q}}_3}{{{\partial \delta }}_3}\enspace \frac{{{\partial Q}}_3}{{{\partial \delta }}_4}\enspace \frac{{{\partial Q}}_3}{{{\partial \delta }}_5}\enspace \frac{{{\partial Q}}_3}{\partial {V}_2}\enspace \frac{{{\partial Q}}_3}{{{\partial V}}_3}\enspace \frac{{{\partial Q}}_3}{\partial {V}_4}\enspace \frac{{{\partial Q}}_3}{\partial {V}_5}\\ \frac{{{\partial Q}}_4}{{{\partial \delta }}_2}\enspace \frac{{{\partial Q}}_4}{{{\partial \delta }}_3}\enspace \frac{{{\partial Q}}_4}{{{\partial \delta }}_4}\enspace \frac{{{\partial Q}}_4}{{{\partial \delta }}_5}\enspace \frac{{{\partial Q}}_4}{{{\partial V}}_2}\enspace \frac{{{\partial Q}}_4}{{{\partial V}}_3}\enspace \frac{{{\partial Q}}_4}{{{\partial V}}_4}\enspace \frac{{{\partial Q}}_4}{{{\partial V}}_5}\\ \frac{{{\partial Q}}_5}{{{\partial \delta }}_2}\enspace \frac{{{\partial Q}}_5}{\partial {\delta }_3}\enspace \frac{{{\partial Q}}_5}{{{\partial \delta }}_4}\enspace \frac{\partial {Q}_5}{{{\partial \delta }}_5}\enspace \frac{{{\partial Q}}_5}{{{\partial V}}_2}\enspace \frac{\partial {Q}_5}{{{\partial V}}_3}\enspace \frac{{{\partial Q}}_5}{{{\partial V}}_4}\enspace \frac{{{\partial Q}}_5}{{{\partial V}}_5}\end{array}\right]. $$](/articles/stet/full_html/2026/01/stet20240426/stet20240426-eq28.gif)
Thus, the Jacobian matrix with bus-3 as the Q bus and bus-5 as the PQV bus is quite different from the Jacobian matrix of the conventional NRLF method.
In this work, the voltage of the PQV bus is controlled by assuming a dispatchable Type-1 DG placed at the Q bus to inject variable real power.
In Figure 1, PDG3 represents the amount of real power injected by the dispatchable Type-1 DG. This may be calculated by the equation (24) given below to keep the voltage at PQV bus-5 constant. (24)
(24)
where, P3 = net Watt power injection at bus-3 by equation (23).
PDG3 = actual DG Wattage output at bus-3.
Pload,3 = specified Wattage of bus-3.
3.3 NRLF equation with PQV and P buses
Similarly, inclusion of the P & PQV bus pair in the network needs to update the Jacobian matrix for solving NRLF [32]. Here, the voltage magnitude of the PQV bus is controlled by regulating the VAr injection at the P bus. A P bus is equipped with a controllable VAr source with its VAr generation not pre-specified, and fixed Watt power generation. In this work, P bus is considered to be connected to a variable reactive power source only, and therefore, the actual Wattage at P bus is considered zero here. Hence, the VAr generation at the P bus needs to be solved as a state variable [37]. The concept of P & PQV buses has been explained through a 5 bus system in Figure 2, with bus-3 and bus-5 considered as P bus & PQV bus, respectively.
 |
Figure 2 Simple 5 bus network with novel P, PQV bus pair |
In Figure 2, QSC3 represents the VAr power injected by the shunt capacitor. This may be calculated by the equation (25) given below. (25)
(25)
where, Q3 = net VAr power injection at bus-3 by the adaptive NRLF method.
QSC3 = actual capacitor VAr output at bus-3.
Pload,3 = rated VAr load at bus-3.
4 Methodology
Simultaneous optimal network reconfiguration and DG placement have been done in this paper to minimize the multi-objective function given by equation (3) using the modified Grey Wolf Optimization (GWO) algorithm [38]. DG size, location, and branches to be opened through sectionalizer switches are considered as decision variables in the modified GWO algorithm. Opening and closing of branches are performed using Fundamental Loop Analysis (FLA) as presented below:
To reconfigure the network, combinations of switches are generated as the search agents. These switches need to be opened to configure the network with its radial topology maintained, and no load being disconnected. Populations of these search agents are huge in number, of which many violate the system radial topology. Network reconfiguration by FLA using Graph Theory (GT) removes impractical population [40]. The formation of FLs is illustrated through a single-line diagram of the IEEE 33 bus RDS shown in Figure 3. This system has five fundamental loops (FLs). Each fundamental loop is associated with a tie-line that normally remains open, whereas the remaining branches of the network normally remain closed. All normally closed branches, as well as tie-lines, are provided with sectionalizer switches. Closing a tie-line makes a fundamental loop closed. Five fundamental loops of the network with associated branches and tie-lines are shown in Table 2. Network is reconfigured through closing of tie switches and opening of sectionalizer switches, maintaining radiality of the network intact, with no bus remaining isolated.
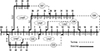 |
Figure 3 single-line diagram of 33- bus system. |
Elements of fundamental loops of 33-bus system.
Element Aij of a connection matrix A consists of b rows and nb columns [41] may be represented as, (26)
(26)
Rows of matrix A corresponding to elements of search agents are first eliminated. Then the sum of elements in every column is calculated. The column corresponding to a bus number for which the calculated sum of absolute value is equal to one is identified, and row elements in matrix A corresponding to the branches connected to that bus are made zero.
Opening and closing of branches by the above procedure may lead to the isolation of one or more buses, sometimes. In order to ensure radiality and integration of each bus of the network, the following three rules are followed to perform branch removals:
Rule-1: Ensure that at least one branch element should participate from each FL.
Rule-2: If a set of branches is common to two fundamental loops, ensure that, so far as possible single branch element should be chosen.
Rule-3: Ensure not to remove the restricted group of branches in different fundamental loops whose simultaneous removal makes some of the buses isolated.
In a radial distribution system, a sectionalizer switch is associated with every branch. To maintain the radial topology of the network, at most one sectionalizer switch associated with the respective branch in each fundamental loop must be opened while all other branches remain closed. Hence, for network reconfiguration, elements of the search agent become equal to the number of tie-lines available. The positions of the switches to be opened (search agents) need to be known. Hence, decision variables (DVR) for search agents are marked using switches associated with the actual branch number to be opened as![Mathematical equation: $$ {{DV}}_R=\left[{S}_1,\enspace {S}_2,\enspace \dots \dots,\enspace {S}_{{NTie}}\right], $$](/articles/stet/full_html/2026/01/stet20240426/stet20240426-eq34.gif) (27)
(27)
where, Si is the status of the sectionalizer switch in ith fundamental loop, and NTie represents the number of tie lines.
During voltage stability analysis, determining VSM in terms of maximum loadability is a substantial measure. For a particular load pattern, voltage stability margin could be obtained through successive load flows till the minimum system voltage (assumed to be the collapse point) is obtained [42]. The VSM is calculated in terms of the maximum loadability of the loading factor (λ) versus the voltage magnitude curve. The active and reactive load power depends on λ and is represented as: (28)
(28)
 (29)
(29)
where, P0 and Pnew are the active power load demand at the initial loading factor (λ = 0) and a new loading factor λ, respectively. Similarly, Q0 and Qnew are the reactive power load demand at initial loading (λ = 0) and at the new λ, respectively. The loading factor λ has been changed in steps of 0.01 pu in this work.
The flowchart of MGWO for the proposed work is shown in Figure 4. Solution variables in the decision vector DVRDG consists of switch position plus DG location as a discrete variable and DG size as a continuous variable, as given below;![Mathematical equation: $$ {{DV}}_{{RDG}}=\left[\genfrac{}{}{0pt}{}{{S}_1,\enspace {S}_2,\enspace \dots \dots,\enspace {S}_{{NTie}}}{{switch}\enspace {numbers}}\genfrac{}{}{0pt}{}{{{DG}}_l}{{DG}\enspace {location}}\genfrac{}{}{0pt}{}{{{DG}}_s}{{DG}\enspace {size}}\right]. $$](/articles/stet/full_html/2026/01/stet20240426/stet20240426-eq37.gif) (30)
(30)
 |
Figure 4 Flow chart for voltage stability enhancement and loss reduction by proposed simultaneous DG placement and Reconfiguration under P/Q and PQV bus pair. |
Where Si, DGl, DGs are sectionalizer switch of branch-i is to be opened, DG location, and DG size, respectively. These variables are represented as wolves in the modified GWO algorithm. The objective function to be optimized is treated as prey.
Impact of optimal network reformation and DG integration with PQV & P/Q buses in the system on loss reduction and VSM enhancement in terms of loading factor λ has been studied over five cases given below.
Case 1: P/Q, PQV buses allocation for base case system. (i.e., without optimal network reformation and DG integration).
Case 2: Reconfiguration with P/Q, PQV bus pair. (no placement of DG except Type-1 DG at Q-bus).
Case 3: Reconfiguration & Type-1 DG allocation (apart from Type-1 DG at Q-bus) with P/Q, PQV buses.
Case 4: Reconfiguration &Type-3 DG (0.82 pf, the optimal power factor obtained in [26]) allocation with P/Q, PQV buses.
Case 5: Reconfiguration &Type-3 DG (0.9 pf) allocation with P/Q, PQV buses.
5 Results and discussion
To validate the effectiveness of the proposed methodology, numerical simulation is accomplished on the IEEE 33-bus network [21] and 69-bus network [29] reconfigurable distribution systems. The simulation findings over two test systems are presented below.
5.1 Test system 1 (IEEE 33-bus RDS)
The IEEE 33-bus network is taken here as the first test system to test the proposed methodology. It consists of 32 generally closed branches and 5 generally opened tie-switches with 4 feeders. The first bus of this test system is considered the substation bus or reference bus, and the rest of the buses are load buses for load flow analysis. The total Watt and VAr demand is 3.715 MW and 2.3 MVAr, respectively.
5.1.1 Selection of PQV bus
The PQV bus was selected based on a criterion of being the farthest bus with the lowest voltage magnitude. Base case minimum voltage magnitude  of 33-bus test system has been shown in Table 3. It is observed from Table 3 that remote bus-18 has got a voltage magnitude of 0.9131 pu, which is lowest. Therefore, bus-18 was selected as the PQV bus in the 33-bus RDS. The pre-defined voltage of the PQV bus (bus-18) was set as 0.93 pu for the base case condition.
Results before and after selection of P, PQV buses in the IEEE 33-bus RDS.
5.1.2 Simulation results with PQV and P buses
For the selection of a P bus, the optimization procedure is performed with the connection of the shunt capacitor at each bus considered at a time. The bus that results in the minimum value of the fitness function defined by equation (3) with the placement of a shunt capacitor is selected as P bus. In Figure 5, results are presented for every possible bus to be assigned as the P bus to keep the desired voltage level of 0.93 pu at PQV bus-18. It is observed that consideration of bus-29 as P bus minimizes the proposed objective function with minimum system power loss and enhanced QLI with higher maximum loadability. Therefore, bus-29 is selected and assigned as the P bus with a shunt capacitor injecting 1.74646 MVAr of reactive power, as shown in Table 3. Also, Table 3 shows real power loss (APL), reactive power loss (QPL), and maximum loadability (λmax), minimum Voltage Stability Index (VSImin) [35], minimum voltage (Vmin) and maximum voltage (Vmax) in absence of P, PQV buses as well as in the presence of P, PQV buses. It is observed from Table 3 that choosing bus-29 as P bus yields maximum system loadability, minimum Watt & VAr losses are 2.95, 151.25 kW, and 102.81 kVAr, respectively, and minimum value of VSI as 0.7580. A significant enhancement of 12.17% has been achieved in maximum system loadability, and a significant reduction in Watt and VAr loss is achieved as 25.38% and 23.92%, respectively, with P and PQV buses in the system.
 |
Figure 5 P bus selection criterion for IEEE 33-bus RDS. |
Table 4 presents real and reactive power loss, percentage reduction in real power loss (APLR%), percentage reduction in reactive power loss (QPLR%), and maximum loadability (λmax), minimum voltage magnitude (Vmin) along with the bus number, the maximum voltage magnitude (Vmax) along with the bus number for the five cases considered for the 33-bus system incorporating P, PQV buses by the proposed method. Incorporating P, PQV buses, followed by network reconfiguration (but no DG placement) by opening the switches associated with a set of lines (7, 9, 14, 28, 32), the real power loss drops from 151.25 kW to 109.55 kW, while the loadability of the system increases to 4.75 pu from the base case value of 2.95 pu. The minimum voltage of the network has improved to 0.9477 pu (occurring at bus-33), which is above the set target value of 0.93 pu. Further, the application of simultaneous reconfiguration and Type-1 DG (injecting only real power of 1.94446 MW operating at unity power factor) allocation at bus-25 enhances the loadability of the system to 6.93 pu while keeping the active power loss to a minimum of 49.27 kW, thus improving the loadability by 163.5% while the real power loss reduction (APLR) is 75.69%. In this case, the system minimum voltage magnitude has further enhanced to 0.9644 pu at bus-17. The reactive power loss reduction (RPLR) for this case is 68.33%.
Results with P and PQV buses for IEEE 33-bus RDS.
As shown in Table 4, further investigations have been carried out under Type-3 DG in the system, injecting both real and reactive power operating at 0.82 power factor (Case 4) and 0.90 power factor (Case 5), respectively. For Case 4, considering the network reconfiguration and Type-3 DG at 0.82 power factor, the optimal solution has been found as DG of 2.80449 MVA placed at bus-9 and opening the switches associated with the set of lines (14, 20, 28, 32, 35). It is observed from Table 4 that Case 4 results in an enhancement in the system maximum loadability by 175.67% to 7.25, while reducing the real power loss to 84.45 kW and the reactive power loss to 65.58 kVAr. The minimum system voltage has been improved to 0.9909 pu at bus-25. For Case 5, placing a DG of 3.0190 MVA at 0.90 power factor and opening the switches associated with the set of lines (14, 20, 32, 35, 37) increases the maximum system loadability by 153.61% to 6.67, while reducing the Watt and VAr losses by 61.85% and 54.90% to 77.32 kW and 60.95 kVAr, respectively.
Figures 6–9 are drawn for the maximum system loadability, voltage profile, system loss and voltage stability indices, respectively, for all the cases under study. Figure 6 shows that the highest maximum system loadability is achieved by implementation of Case 4. Figure 7 shows that voltage magnitudes are lying well within the permissible limits except for Case 1 and Case 2. From Figure 8 it can be observed that system loss is lowest for Case 3 compared to other cases. Figure 9 presents Voltage Stability Index (VSI) for all the buses (defined as per (7)) of the system for all the cases from which it can be observed that minimum VSI is highest for Case 4 compared to other cases. Consequently, Case 4 awards a considerable enhancement in the performance indices and harvests best maximum loadability at highest voltage profile improvement.
 |
Figure 6 Loadability curve of cases with P, PQV buses for IEEE 33-bus RDS. |
 |
Figure 7 Voltage profile of cases with P, PQV buses for IEEE 33-bus RDS. |
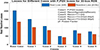 |
Figure 8 System losses of cases with P, PQV buses for IEEE 33-bus RDS. |
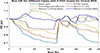 |
Figure 9 VSI of cases with P, PQV buses for IEEE 33-bus RDS. |
5.1.3 Comparison of results of two multi-objective functions
Table 5 presents the comparison of results obtained by the multi-objective function proposed in this work with the multi-objective function proposed in [37] for enhancing system performances under P, PQV buses. Table 5 shows that system performances have been greatly enhanced in terms of loss reduction and maximum system loadability enhancement with the proposed multi-objective function compared to the multi-objective function proposed in [37]. The method proposed in this work results in a better improvement in terms of real power loss reduction as well as maximum system loadability enhancement, as compared to the method with objective function proposed in [37] for P, PQV bus allocation, under different cases as observed from Table 5.
Comparison of results for different cases with P, PQV buses for IEEE 33-bus RDS.
5.1.4 Results with Q, PQV buses
For selection of a Q bus, the optimization procedure is performed with dispatchable Type-1 DG connected at each bus considered at a time using the fitness function defined by equation (3). The bus with the minimum value of the fitness function defined by equation (3) is selected as the Q bus. The objective fitness function considers both reduction in real power loss and enhancement in load quality to be served that ultimately enhances the maximum system loadability. Figure 10 shows the Watt and VAr losses of the system, QLI, and real power injected through Type-1 DG (PDG,Qbus) connected at the bus under consideration as the Q bus. In Figure 10, results are presented for every possible bus to be assigned as the Q bus to keep the desired voltage level of 0.93 pu at PQV bus-18. It is observed that consideration of bus-30 as the Q bus minimizes the multi-objective function with minimum real power loss and enhanced QLI with higher maximum loadability. Therefore, bus-30 is selected and assigned as the Q bus with Type-1 DG placed at the bus, injecting 1.101042 MW of real power, as shown in Table 6. Table 6 also shows Watt and VAr losses, λmax, VSImin [37] and Vmin and Vmax in the absence of Q, PQV buses, as well as in the presence of Q, PQV buses. It is observed from Table 6 that choosing bus-30 as Q bus yields enhanced maximum system loadability, and reduced Watt and VAr losses of the system as 2.91, 123.94 kW and 84.65 kVAr, respectively, and a minimum value of VSI as 0.7580. A significant enhancement of 10.65% has been achieved in maximum system loadability, and a significant reduction of 38.85% and 37.36%, respectively, has been obtained in Watt and VAr losses, with the incorporation of selected Q, PQV pair of buses in the system.
 |
Figure 10 Q bus selection criterion for IEEE 33-bus RDS. |
Results before and after selection of Q, PQV buses in the IEEE 33-bus RDS.
Table 7 shows the Watt and VAr losses along with percentage reduction in their values compared to the base case, maximum and minimum voltage magnitudes along with bus numbers where these occur, and maximum loadability for the five cases considered for the 33-bus system incorporating Q, PQV buses by the proposed method. Incorporating Q, PQV buses, followed by network reconfiguration by opening the switches associated with set of lines (7, 9, 14, 28, 32) with only Type-1 DG at Q bus and no other DG placed in the system, the real power loss drops from 151.25 kW to 91.69 kW, while maximum loadability of the system increases to 4.69 pu from the base case value. The Vmin has improved to 0.9477 pu at bus-33, which is above the set target value of 0.93 pu. Further, the application of simultaneous reconfiguration and Type-1 DG (1.05647 MW at bus-14) allocation (in addition to Type-1 DG at Q bus-30) enhances the loadability of the system to 6.26 pu while reducing the Watt losses to a value of 64.95 kW, thus improving the loadability by 138.02% while the Watt loss is reduced by 67.95%. In this case, the voltage has further enhanced to 0.9617 pu at bus-32.
Results after Q, PQV buses consideration for IEEE 33-bus RDS.
As presented in Table 7, further investigations have been carried out for Type-3 DG injecting both Watt and VAr power at 0.82 power factor (Case 4) and 0.90 power factor (Case 5), respectively (in addition to Type-1 DG placed at Q bus-30), while reconfiguring the network, simultaneously. For Case 4, considering the network reconfiguration and Type-3 DG at 0.82 power factor, the optimal solution has been reported as DG of 2.40518 MVA placed at bus-25 (apart from Type-1 DG placed at Q bus-30) and opening the switches associated with set of lines (7, 10, 13, 15, 25), and it increases the system maximum loadability by 184.41% to 7.48 while reducing the network Watt and VAr losses to 55.87 kW and 47.59 kVAr, respectively. The Vmin has been improved to 0.9650 pu at bus-14, which is above the set target value of 0.93 pu. For Case 5, placing a DG of 3.13818 MVA at bus-7 with 0.90 power factor (apart from Type-1 DG placed at Q bus-30) and opening the switches associated with set of lines (12, 20, 32, 35, 37) increases the maximum system loadability by 149.81% to 6.57, while reducing the Watt and VAr losses to 74.38 kW and 60.56 kVAr, respectively. With Case 5 into consideration, the network Watt and VAr losses have been reduced by 63.30% and 55.18%, respectively. Case 4 proves to be a highly favorable solution as it enhances the system performance, mostly compared to all other cases under study, considering Q, PQV pair of buses for the 33-bus reconfigurable test system.
Figures 11–14 are drawn for the maximum system loadability, voltage profile, system loss, and Voltage Stability Index VSI (defined as per (7)) for all the cases under study. Figure 11 shows that the highest maximum system loadability is achieved by the implementation of Case 4 compared to other cases under the presence of a Q, PQV pair of buses. Figure 12 shows that voltage magnitudes are lying well within the permissible limits except for Cases 1 and 2. It is observed from Figure 13 that minimum loss is achieved with Case 4 compared to all other cases in the presence of the Q, PQV pair of buses. From Figure 14, it is observed that maximum enhancement in VSI for all the buses is obtained with Case 5 as compared to other cases.
 |
Figure 11 Loadability curve for cases with Q, PQV buses for IEEE 33-bus RDS. |
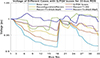 |
Figure 12 Voltage profile for cases with Q, PQV buses for IEEE 33-bus RDS. |
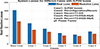 |
Figure 13 Loss profile for cases with Q, PQV buses for IEEE 33-bus RDS. |
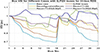 |
Figure 14 VSI for cases with Q, PQV buses for IEEE 33-bus RDS. |
5.2 Test system 2 (IEEE 69-bus RDS)
The IEEE 69-bus network is taken here as the second test system to test the proposed methodology. It consists of 68 branches and 5 tie-switches with 7 feeders. The first bus of this test system is considered as the substation bus or reference bus, and the rest of the buses are load buses for load flow analysis. The total Watt and VAr demands are 3.802 MW and 2.694 MVAr, respectively.
5.2.1 Selection of PQV bus
The PQV bus was selected based on a criterion of being the farthest bus with the lowest voltage magnitude. Base case minimum voltage magnitudes (Vmin) of 69-bus test system have been shown in Table 8. It shows that remote bus-65 has a voltage magnitude of 0.9092 pu, which is the lowest. Therefore, bus-65 was selected as the PQV bus for the 69-bus RDS. The pre-defined voltage of the PQV bus (bus-65) was set as 0.93 pu for the base case condition.
Results before and after selection of P, PQV buses in the IEEE 69-bus RDS.
5.2.2 Results with PQV & P buses
For the selection of a P bus, the optimization procedure is performed with the connection of a shunt capacitor at each bus considered at a time. The bus with the minimum value of the fitness function defined by equation (3) after shunt capacitor placement is selected as the P bus. The objective function considers both reduction in real power loss and enhancements in load quality to be served that ultimately enhance the maximum system loadability. Figure 15 shows the Watt & VAr losses of the system, QLI, and VAr injected through the shunt capacitor connected at the bus under consideration as P bus for all the buses present in the system except the reference bus-1 and PQV bus-65. In Figure 15, results are presented for every possible bus to be assigned as the P bus to keep the desired voltage level of 0.93 pu at PQV bus-65. It is observed that consideration of bus-61 as P bus minimizes the proposed objective function with minimum real power loss and enhanced QLI with higher maximum loadability. Therefore, bus-61 is selected and assigned as the P bus with a shunt capacitor injecting 1.2812 MVAr of reactive power, as shown in Table 8. Table 8 also shows real power loss (APL), reactive power loss (QPL), and maximum loadability (λmax), minimum Voltage Stability Index (VSImin) [37], minimum voltage (Vmin) and maximum voltage (Vmax) of the system in the absence of P, PQV buses, as well as in the presence of P, PQV buses. It is observed from Table 8 that choosing bus-61 as the P bus yields maximum system loadability (λmax) and Watt & VAr losses of the system as 2.49, 152.1 kW, and 70.57 kVAr, respectively, and the minimum value of the Voltage Stability Index (VSImin) as 0.7481. A significant enhancement of 12.16% has been achieved in maximum system loadability, and a significant reduction of 32.39% and 30.91%, respectively, has been obtained in Watt & VAr losses, respectively, with P & PQV buses.
 |
Figure 15 P bus selection criterion for IEEE 69-bus RDS. |
Table 9 presents different performance indices for the five cases considered for the 69-bus system incorporating P, PQV buses by the proposed method. Incorporating P, PQV buses, followed by network reconfiguration (but no DG placement) by opening the switches associated with a set of lines (14, 57, 62, 69, 70), the Watt losses drop from 152.1 kW to 74.25 kW, while λmax increases to 4.8 pu by 116.22% from the base case value of 2.49. The Vmin improved to 0.9676 pu (occurring at bus-63), which is above the set target of 0.93 pu. Further, the application of simultaneous reconfiguration and Type-1 DG (injecting only real power of 2.25638 MW operating at unity power factor) allocation at bus-62 enhances the loadability of the system to 9.48 pu while keeping the Watt losses to a minimum value of 18.72 kW, and reactive power loss to 12.15 kVAr, thus improving the loadability by 327.03% while APLR and QPLR are 91.68% and 88.1%, respectively. In this case, the system minimum voltage magnitude has further enhanced to 0.9885 pu at bus-19.
Results after P and PQV bus consideration for IEEE 69-bus RDS.
As depicted in Table 9, further investigations have been carried out under Type-3 DG in the system, injecting both Watt & VAr power operating at 0.82 power factor (Case 4) and 0.90 power factor (Case 5), respectively. For Case 4, considering the simultaneous network reconfiguration and Type-3 DG at 0.82 power factor, the optimal solution has been found as DG of 1.84736 MVA placed at bus-62 and opening the switches associated with the set of lines (14, 23, 54, 69, 70). It is obtained from Table 9 that Case 4 results in an enhancement in the system maximum loadability by 659.46% to 16.86, while reducing the network Watt & VAr losses to 37.86 kW and 26.80 kVAr, respectively. In this case, the Watt & VAr losses have been reduced by 83.17% and 73.76%, respectively. The Vmin has been improved to 0.9896 pu at bus-22. For Case 5, placing a DG of 1.98855 MVA at bus-63 operating at 0.90 power factor and opening the switches associated with the set of lines (13, 18, 22, 54, 69) increases the maximum system loadability by 663.06% to 16.94, while reducing the Watt & VAr losses to 31.92 kW and 19.56 kVAr, respectively. The Watt & VAr losses have been reduced by 85.81% and 80.85%, respectively, with Case 5.
Figures 16–19 are drawn for the maximum system loadability, voltage profile, system loss, and VSI, for all the cases under study. Figure 16 shows that the highest maximum system loadability is achieved by the implementation of Case 5. Figure 17 shows that voltage magnitudes are lying well within the permissible limits except for Case 1. From Figure 18, it can be observed that system loss is lowest for Case 3 compared to other cases. Figure 19 presents VSI for all the buses (defined as per equation (7)) of the system buses for all the cases, from which it can be observed that the minimum VSI is highest for Case 4 compared to other cases. Looking at different aspects, Case 5 awards a considerable enhancement in the performance indices and harvests the best λmax at the highest voltage profile improvement.
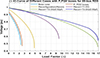 |
Figure 16 Loadability curve of cases with P, PQV buses for IEEE 69-bus RDS. |
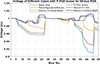 |
Figure 17 Voltage profile of cases with P, PQV buses for IEEE 69-bus RDS. |
 |
Figure 18 System loss of cases with P, PQV buses for IEEE 69-bus RDS. |
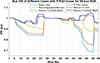 |
Figure 19 VSI of cases with P, PQV buses for IEEE 69-bus RDS. |
5.2.3 Results with Q, PQV buses
For selection of a Q bus, the optimization procedure is performed with dispatchable Type-1 DG connected at each bus considered at a time using the fitness function defined by Equation (3). The bus with the minimum value of the fitness function defined by equation (3) is selected as the Q bus. The objective fitness function considers both reduction in Watt loss and enhancement in load quality to be served that ultimately enhances the maximum system loadability.
In Figure 20, results are presented for every possible bus to be assigned as the Q bus to keep the desired voltage level of 0.93 pu at PQV bus-65. It is observed that consideration of bus-61 as the Q bus minimizes the proposed objective function with minimum real power loss and enhanced QLI with higher maximum loadability. Therefore, bus-61 is selected and assigned as the Q bus, with a Type-1 DG placed at bus injecting 0.5270 MW of real power, as shown in Table 10. Table 10 also presents Watt & VAr losses, λmax, VSImin [34] and minimum and maximum system voltage in the absence of Q, PQV buses, as well as in the presence of Q, PQV buses. It has been observed from Table 10 that choosing bus-61 as the Q bus yields enhanced maximum system loadability, and reduced real and reactive power loss of the system as 2.43, 153.19 kW, and 71.58 kVAr, respectively, and a minimum value of VSI as 0.7481. A significant enhancement of 9.46% has been achieved in maximum system loadability, and a significant reduction of 31.90% and 29.92%, respectively, has been obtained in Watt & VAr losses, respectively, with the incorporation of selected Q, PQV pair of buses in the system.
 |
Figure 20 Q bus selection criterion for 69-bus RDS. |
Results before and after selection of Q, PQV buses in the IEEE 69-bus RDS.
Table 11 presents the real and reactive power losses and their % reduction compared to the base case, minimum and maximum voltage magnitude, along with bus numbers where these occur, and maximum loadability for the five cases considered for the 69-bus system incorporating Q, PQV buses by the proposed method. Incorporating Q, PQV buses, followed by network reconfiguration by opening the switches associated with a set of lines (14, 56, 61, 69, 70) with only Type-1 DG at Q bus and no other DG placed in the system, the Watt losses drop from 153.19 kW to 69.52 kW, while λmax increases to 4.77 pu. The network reconfiguration in the presence of Q, PQV pair of buses enhances the maximum loadability by 114.86%, and Watt & VAr losses have been reduced by 69.1% and 35.44%, respectively. The Vmin of the network has improved to 0.9615 pu at bus-61, which is above the set target of 0.93 pu. Further, the application of simultaneous network decomposition and Type-1 DG deployment of size 1.02398 MW at bus-63 (in addition to Type-1 DG placed at Q bus-61) enhances the loadability of the system to 7.95 pu while reducing the Watt & VAr losses to a value of 51.35 kW and 44.57 kVAr, respectively, thus improving the loadability by 258.11% while Watt & VAr losses are reduced by 77.17% and 56.36%, respectively. In this case, the voltage has further enhanced to 0.9676 pu at bus-64.
Results after Q, PQV buses consideration for IEEE 69-bus RDS.
As depicted in Table 11, further investigations have been carried out for Type-3 DG injecting both Watt & VAr power at 0.82 power factor (Case 4) and 0.90 power factor (Case 5), respectively (in addition to the Type-1 DG placed at Q bus-61), while reconfiguring the network simultaneously. For Case 4, considering the network reconfiguration and Type-3 DG at 0.82 power factor, the optimal solution has been reported as DG of 1.62011 MVA placed at bus-62 (apart from Type-1 DG placed at Q bus-61) and opening the switches associated with set of lines (12, 58, 64, 69, 70), and it increases the maximum system loadability by 642.34% to 16.48, while reducing the network loss to 17.99 kW and 15.67 kVAr, respectively. For Case 4, Watt & VAr losses reduced by 92.01% and 84.66%, respectively. The Vmin improved to 0.9831 pu at bus-65. For Case 5, placing a DG of 1.89411 MVA at bus-62 with 0.90 power factor (apart from Type-1 DG placed at Q bus-61) and opening the switches associated with set of lines (12, 21, 58, 69, 70) increases the maximum system loadability by 614.41% to 15.86 pu, while reducing the Watt & VAr losses to 21.90 kW and 17.36 kVAr, respectively. With Case 5 into consideration, the network Watt & VAr losses reduced by 90.26% and 82.99%, respectively. The Vmin was enhanced to 0.9893 on bus-21 with Case 5. Case 4 proves to be a highly favorable solution, as it enhances the system performance, mostly, compared to all other cases under study, considering the Q-PQV pair of buses for the 69-bus reconfigurable distribution system as well.
Figures 21–24 are drawn for the maximum system loadability, voltage profile, system loss, and voltage stability indices for all the cases under study. Figure 21 shows that the highest maximum system loadability is achieved by the implementation of Case 4 compared to other cases under the presence of a Q, PQV pair of buses. Figure 22 shows that voltage magnitudes are lying well within the permissible limits except for Case 1. It is observed from Figure 23 that minimum loss is achieved with Case 4 compared to all other cases in the presence of the Q, PQV pair of buses. From Figure 24, it is observed that Voltage Stability indices are improved greatly with Case 5 compared to the other cases.
 |
Figure 21 Loadability curve of cases with Q, PQV buses for IEEE 69-bus RDS. |
 |
Figure 22 Voltage profile of cases with Q, PQV buses for IEEE 69-bus. |
 |
Figure 23 Loss profile of cases with Q, PQV buses 69-bus RDS. |
 |
Figure 24 VSI of cases with Q, PQV buses 69-bus RDS. |
6 Conclusion
This work has presented a novel approach to reduce the system power loss as well as improve voltage stability in terms of maximum loadability of the distribution system with the application of P or Q bus and PQV bus. The main findings of the work are as follows:
-
Quite effective in the reduction of network losses.
-
Significant enhancement in maximum loadability.
-
Presence of P bus is found more effective than Q bus in voltage stability as the P bus has a variable reactive source, whereas the Q bus has a variable active power source. Voltage stability margin can be better controlled by the control of injected reactive power.
-
Considerable improvement in the voltage profile of the network.
It can also be observed that better performance is achieved through network reformation and DG deployment with the incorporation of P, PQV pair of buses, as well as Q, PQV pair of buses in the system, with the proposed objective function compared to an existing approach. Placement of Type-1 DG, Type-3 DG at 0.82 power factor, and Type-3 DG at 0.9 power factor have been considered in this work. Allocating a Type-3 DG at an optimal power factor of 0.82 improves the network performance compared to Type-1 DG and Type-3 DG at 0.9 power factor, as Type-3 DG at 0.9 power factor results in overcompensation of reactive power.
References
- Ajjarapu V., Christy C. (1992) The continuation power flow: a tool for steady state voltage stability analysis, IEEE Transac. Power Syst. 7, 416–423. [Google Scholar]
- Poornazaryan B., Karimyan P., Gharehpetian G. B., Abedi M. (2016) Optimal allocation and sizing of DG units considering voltage stability, losses and load variations, Int. J. Elect. Power Energ. Syst. 79, 42–52. [Google Scholar]
- Mithulananthan N., Oo T. (2006) Distributed generator placement to maximize the loadability of a distribution system, Int. J. Elect. Eng. Educ. 43, 107–118. [Google Scholar]
- Esmaili M. (2013) Placement of minimum distributed generation units observing power losses and voltage stability with network constraints, IET Generation Transm. Distr. 7, 8, 813–821. [Google Scholar]
- Moger T., Dhadbanjan T. (2015) A novel index for identification of weak nodes for reactive compensation to improve voltage stability, IET Generation Transm. Distr. 9, 14, 1826–1834. [Google Scholar]
- Verma M.K., Srivastava S.C. (2005) Optimal placement of SVC for static and dynamic voltage security enhancement, Int. J. Emerg. Electr. Power Syst. 2, 2. [Google Scholar]
- Hien N.C., Mithulananthan N., Bansal R.C. (2013) Location and sizing of distributed generation units for loadabilty enhancement in primary feeder, IEEE Syst. J. 7, 4, 797–806. [Google Scholar]
- Al Abri R.S., El-Saadany E.F., Atwa Y.M. (2012) Optimal placement and sizing method to improve the voltage stability margin in a distribution system using distributed generation, IEEE Transact. Power Syst. 28, 1, 326–334. [Google Scholar]
- Hung D.Q., Mithulananthan N. (2014) Loss reduction and loadability enhancement with DG: A dual-index analytical approach, Appl. Energ.. 115, 233-241. [Google Scholar]
- Murty V.V., Kumar A. (2015) Optimal placement of DG in radial distribution systems based on new voltage stability index under load growth, Int. J. Electric. Power Energ. Syst. 69, 246–256. [Google Scholar]
- Mostafa M., Elshahed M., Elmarsfawy M. (2016) Power flow study and voltage stability analysis for radial system with distributed generation Int. J. Comp. Appl. 137, 9, 19–26. [Google Scholar]
- Gnanambal K., Babulal C.K. (2012) Maximum loadability limit of power system using hybrid differential evolution with particle swarm optimization, Int. J. Electr. Power Energ. Syst. 43, 1, 150–155. [Google Scholar]
- Aman M.M., Jasmon G.B., Mokhlis H., Bakar A.H.A. (2012) Optimal placement and sizing of a DG based on a new power stability index and line losses, Int. J. Electr. Power Energ. Syst. 43, 1, 1296–1304. [Google Scholar]
- Karimyan P., Gharehpetian G.B., Abedi M., Gavili A. (2014) Long term scheduling for optimal allocation and sizing of DG unit considering load variations and DG type, Int. J. Electr. Power Energ. Syst. 54, 277–287. [Google Scholar]
- Raja P., Selvan M.P., Kumaresan N. (2013) Enhancement of voltage stability margin in radial distribution system with squirrel cage induction generator based distributed generators, IET Generation Transm. Distr. 7, 8, 898–906. [Google Scholar]
- Parihar S. S., Malik N. (2024) Network reconfiguration in the presence of optimally integrated multiple distributed generation units in a radial distribution network, Eng. Optimiz. 56, 5, 679–699. [Google Scholar]
- Pamshetti V. B., Singh S., Singh S.P. (2019) Combined impact of network reconfiguration and volt-VAR control devices on energy savings in the presence of distributed generation, IEEE Syst. J. 14, 1, 995–1006. [Google Scholar]
- Baran M.E., Wu F.F. (1989) Network reconfiguration in distribution systems for loss reduction and load balancing, IEEE Transact. Power Deliv. 4, 2, 1401–1407. [Google Scholar]
- Gupta N., Swarnkar A., Niazi K.R. (2011) Reconfiguration of distribution systems for real power loss minimization using adaptive particle swarm optimization, Electr. Power Comp. Syst. 39, 4, 317–330. [Google Scholar]
- Shojaei F., Rastegar M., Dabbaghjamanesh M. (2020) Simultaneous placement of tie-lines and distributed generations to optimize distribution system post-outage operations and minimize energy losses, CSEE J. Power Energ. Syst. 7, 2, 318–328. [Google Scholar]
- Hemmatpour M.H. (2019) Optimum interconnected islanded microgrids operation with high levels of renewable energy, Smart Sci. 7, 1, 47–58. [Google Scholar]
- Amanulla B., Chakrabarti S., Singh S.N. (2012) Reconfiguration of power distribution systems considering reliability and power loss, IEEE Transact. Power Deliv. 27, 2, 918–926. [Google Scholar]
- Krishan R., Verma A., Mishra S. (2018) Loadability analysis of DC distribution systems, Int. J. Electr. Power Energ. Syst. 103, 176–184. [Google Scholar]
- Tyagi A., Verma A., Bijwe P.R. (2018) Reconfiguration for loadability limit enhancement of distribution systems, IET Generation Transm. Distr. 12, 1, 88–93. [Google Scholar]
- Sahoo N.C., Prasad K. (2006) A fuzzy genetic approach for network reconfiguration to enhance voltage stability in radial distribution systems, Energ. Conv. Manag. 47, 18–19, 3288–3306. [Google Scholar]
- Yadav L.K., Verma M.K. (2022) Optimal integration of classified dispersed generation units for loss minimization and voltage profile enhancement in radial distribution networks, J. Electr. Syst. 54, 3, 354–368. [Google Scholar]
- Aman M.M., Jasmon G.B., Mokhlis H., Bakar A.H.A. (2016) Optimum tie switches allocation and DG placement based on maximisation of system loadability using discrete artificial bee colony algorithm, IET Generation Transm. Distr. 10, 10, 2277–2284. [Google Scholar]
- Quadri I.A., Bhowmick S., Joshi D. (2018) Multi‐objective approach to maximise loadability of distribution networks by simultaneous reconfiguration and allocation of distributed energy resources, IET Generation Transm. Distr. 12, 21, 5700–5712. [Google Scholar]
- Kayal P., Kumar R. K. (2024) Allocation and sizing of dispatchable distributed generators considering value addition in resiliency and sustainability of power delivery infrastructure, Sust. Resilient Infrastruc. 9, 3, 223–241. [Google Scholar]
- Ramesh B., Khedkar M., Kotha S. K., Pemmada S. (2024) A demand response-based optimal scheduling framework considering renewable sources and energy storage: a deterministic approach, Electr. Eng. 22, 1–20. [Google Scholar]
- Raza A., Zahid M., Chen J., Qaisar S. M., Ilahi T., Waqar A., Alzahrani A. (2023) A novel integration technique for optimal location & sizing of DG units with reconfiguration in radial distribution networks considering reliability, IEEE Acc. 11, 123610–123624. [Google Scholar]
- Variz A.M., Pereira J.L.R., Martins N. (2003) Improved representation of control adjustments into the Newton–Raphson power flow, Int. J. Electr. Power Energ. Syst. 25, 7, 501–513. [Google Scholar]
- Garcia P.A.N., Pereira J.L.R., Carneiro S.J. (2001) Voltage control devices models for distribution power flow analysis, IEEE Transact. Power Syst. 16, 4, 586–594. [Google Scholar]
- Zhao J., Zhou C., Chen G. (2013) A novel bus-type extended continuation power flow considering remote voltage control, 2013 IEEE Power Energ Soc General Meet. 1–5. [Google Scholar]
- Das S., Das D., Patra A. (2017) Reconfiguration of distribution networks with optimal placement of distributed generations in the presence of remote voltage controlled bus, Renew. Sust. Energ. Revi. 73, 772–781. [Google Scholar]
- Tah A., Das D. (2016) Novel analytical method for the placement and sizing of distributed generation unit on distribution networks with and without considering P and PQV buses, Int. J. Electr. Power Energ. Syst. 78, 401–413. [Google Scholar]
- Barnwal A.K., Yadav L.K., Verma M.K. (2022) A multi-objective approach for voltage stability enhancement and loss reduction under PQV and P buses through reconfiguration and distributed generation allocation, IEEE Acc. 10, 16609–16623. [Google Scholar]
- Barnwal A.K., Verma M.K. (2021) A modified GWO based approach for optimal placement of multi-distributed generations. J. Electr. Syst. 17, 4, 515–528. [Google Scholar]
- Ranjan R., Das D. (2003) Voltage stability analysis of radial distribution networks, Electr. Power Comp. Syst. 31, 5, 501–511. [Google Scholar]
- Dolatdar E., Soleymani S., Mozafari B. (2009) A new distribution network reconfiguration approach using a tree model, Int. J. Comp. Informat. Eng. 3, 10, 2480–2487. [Google Scholar]
- Abdelaziz A.Y., Mohamed F.M., Mekhamer S.F., Badr M.A.L. (2010) Distribution system reconfiguration using a modified Tabu search algorithm, Electric Power Syst. Res. 80, 8, 943–953. [Google Scholar]
- Aman M.M., Jasmon G.B., Bakar A.H.A., Mokhlis H. (2014) A new approach for optimum simultaneous multi-DG distributed generation Units placement and sizing based on maximization of system loadability using HPSO (hybrid particle swarm optimization) algorithm, Energy 66, 202–215. [Google Scholar]
Appendix
The Voltage Stability Index (VSI) of bus-i defined by (7) is obtained from two bus equivalents shown in Figure A1 [39]. In Figure A1, Pei and Qei are the total effective real and reactive power load at ith bus, which is calculated by adding all the loads beyond ith bus and load at ith bus itself and losses occurred in all the branches downstream to ith bus, Ri and Xi represent reactance and resistance of the branch-i, respectively.
 |
Figure A1 Two-bus equivalent of simple distribution network. |
| DG rating = 4 MVA | Population Size = 50 | Maximum iterations = 100 | w1 = w2 = 0.5 |
All Tables
All Figures
|
Figure 1 Five bus network with novel Q, PQV bus pair. |
| In the text | |
|
Figure 2 Simple 5 bus network with novel P, PQV bus pair |
| In the text | |
|
Figure 3 single-line diagram of 33- bus system. |
| In the text | |
|
Figure 4 Flow chart for voltage stability enhancement and loss reduction by proposed simultaneous DG placement and Reconfiguration under P/Q and PQV bus pair. |
| In the text | |
|
Figure 5 P bus selection criterion for IEEE 33-bus RDS. |
| In the text | |
|
Figure 6 Loadability curve of cases with P, PQV buses for IEEE 33-bus RDS. |
| In the text | |
|
Figure 7 Voltage profile of cases with P, PQV buses for IEEE 33-bus RDS. |
| In the text | |
|
Figure 8 System losses of cases with P, PQV buses for IEEE 33-bus RDS. |
| In the text | |
|
Figure 9 VSI of cases with P, PQV buses for IEEE 33-bus RDS. |
| In the text | |
|
Figure 10 Q bus selection criterion for IEEE 33-bus RDS. |
| In the text | |
|
Figure 11 Loadability curve for cases with Q, PQV buses for IEEE 33-bus RDS. |
| In the text | |
|
Figure 12 Voltage profile for cases with Q, PQV buses for IEEE 33-bus RDS. |
| In the text | |
|
Figure 13 Loss profile for cases with Q, PQV buses for IEEE 33-bus RDS. |
| In the text | |
|
Figure 14 VSI for cases with Q, PQV buses for IEEE 33-bus RDS. |
| In the text | |
|
Figure 15 P bus selection criterion for IEEE 69-bus RDS. |
| In the text | |
|
Figure 16 Loadability curve of cases with P, PQV buses for IEEE 69-bus RDS. |
| In the text | |
|
Figure 17 Voltage profile of cases with P, PQV buses for IEEE 69-bus RDS. |
| In the text | |
|
Figure 18 System loss of cases with P, PQV buses for IEEE 69-bus RDS. |
| In the text | |
|
Figure 19 VSI of cases with P, PQV buses for IEEE 69-bus RDS. |
| In the text | |
|
Figure 20 Q bus selection criterion for 69-bus RDS. |
| In the text | |
|
Figure 21 Loadability curve of cases with Q, PQV buses for IEEE 69-bus RDS. |
| In the text | |
|
Figure 22 Voltage profile of cases with Q, PQV buses for IEEE 69-bus. |
| In the text | |
|
Figure 23 Loss profile of cases with Q, PQV buses 69-bus RDS. |
| In the text | |
|
Figure 24 VSI of cases with Q, PQV buses 69-bus RDS. |
| In the text | |
|
Figure A1 Two-bus equivalent of simple distribution network. |
| In the text | |
Current usage metrics show cumulative count of Article Views (full-text article views including HTML views, PDF and ePub downloads, according to the available data) and Abstracts Views on Vision4Press platform.
Data correspond to usage on the plateform after 2015. The current usage metrics is available 48-96 hours after online publication and is updated daily on week days.
Initial download of the metrics may take a while.