")
")
| Issue |
Sci. Tech. Energ. Transition
Volume 80, 2025
Innovative Strategies and Technologies for Sustainable Renewable Energy and Low-Carbon Development
|
|
|---|---|---|
| Article Number | 17 | |
| Number of page(s) | 12 | |
| DOI | https://doi.org/10.2516/stet/2024104 | |
| Published online | 27 January 2025 | |
Regular Article
Multi-timescale scheduling optimization of cascade hydro-solar complementary power stations considering spatio-temporal correlation
1
Southwest Branch of State Grid Co., Ltd., Chengdu 610041, Sichuan Province, PR China
2
College of Electrical Engineering, Sichuan University, Chengdu 610065, Sichuan Province, PR China
* Corresponding author: This email address is being protected from spambots. You need JavaScript enabled to view it.
Received:
8
October
2024
Accepted:
18
November
2024
Abstract
The water-PV hybrid generation system is an effective approach to promoting renewable energy integration; however, most existing hydropower stations are run-of-river type with limited annual regulation capacity. Enhancing the PV absorption capacity of such run-of-river hydropower is thus crucial for achieving localized renewable energy utilization. This study proposes a multi-timescale optimization scheduling method for cascade water-PV complementary systems, accounting for spatiotemporal correlations. First, using historical data and Frank-Copula based correlation analysis, we identify the spatiotemporal interactions between water and PV outputs to generate numerous scenarios that capture the coupled characteristics of water-PV generation within the watershed. Considering constraints related to reservoir capacity, water level, flow rate, and individual unit output, a multi-timescale optimization scheduling model is formulated with a single unit as the smallest dispatch unit. To improve computational efficiency, a triangular weighting method is introduced to simplify complex constraints. Finally, a case study within a watershed in Southwest China validates the model’s effectiveness and reliability, providing a valuable reference for enhancing PV absorption capacity through the utilization of run-of-river cascade hydropower.
Key words: Cascade Hydro-Photovoltaic complementary system / Copula spatio-temporal correlation / Optimal dispatch
© The Author(s), published by EDP Sciences, 2025
 This is an Open Access article distributed under the terms of the Creative Commons Attribution License (https://creativecommons.org/licenses/by/4.0), which permits unrestricted use, distribution, and reproduction in any medium, provided the original work is properly cited.
Nomenclature
I : Hydroelectric unit number
N : Cascade hydropower station number
Phydro, P : Decision variables, cascade hydropower station output and unit output
Qp, Qd: Decision variables, power generation water flow and waste water flow
T : Scheduling period
U : Decision variable, 0-1 variable, 1 represents startup, 0 represents shutdown
Vi,t : The reservoir capacity of station i at the end of time period t
Y : Decision variable, 0-1 variable, 1 represents implementation of action, 0 represents no action
Zdown: Decision variable, tailwater level
Zup: Decision variable, water level in front of the dam
1 Introduction
1.1 Motivation
With the global demand for clean energy rising, accelerating the development of renewable energy sources – particularly hydropower and photovoltaic (PV) systems – has become essential for constructing modern power systems. However, the inherent intermittency, volatility, and uncertainty of PV energy present significant challenges to the secure and stable operation of power grids [1–3]. Integrating flexible resources with renewable energy to form complementary generation systems is expected to enhance the absorption capacity for new energy sources. By employing bundled transmission for hydropower and PV energy through shared transmission channels – such as those in systems along the Yarlung Tsangpo, Jinsha River, and Longyangxia – this approach mitigates the disadvantages of renewable energy and improves overall utilization. This method provides a promising solution for configuring source-load structures in future power systems [4–6]. In Southwest China, where hydropower dominates the energy structure and run-of-river hydropower accounts for as much as 65%, only about 10% of hydropower facilities have annual regulation capacity. Therefore, the effective utilization of run-of-river hydropower for the absorption of PV energy serves as the motivation for this study.
1.2 Literature review
To achieve complementary absorption of run-of-river hydropower and photovoltaic (PV) energy, reliable predictions of PV resources within the watershed are essential. Given the substantial uncertainties in PV generation, extensive research has been conducted to accurately forecast PV output and create representative scenarios incorporating random factors [7]. In scenario generation, reference [8] applies kernel density estimation to simulate the probability distribution of PV power output, generating multiple power output scenarios and utilizing the K-means clustering method to form a representative power set. Additionally, this study explores optimal scheduling methods for water-wind complementary systems to maximize economic benefits. Reference [9] develops an opportunity-constrained model for water-PV hybrid systems, while reference [10] assumes that wind and PV power outputs follow a normal distribution, proposing an optimal scheduling method capable of meeting all sampled scenario requirements. Reference [11] leverages coupled loci regression theory and dimensionality reduction clustering techniques to analyze historical new energy data, establishing an optimal scheduling model for water-PV integration.
To address regional spatiotemporal characteristics, reference [12] proposes a wind power output scenario generation method based on Copula theory, describing the spatiotemporal correlations of wind power in regions with hydropower plants. References [13, 14] introduce a wind power generation method based on Markov chains, specifying extreme day types, locations, and durations, with the quality of generated scenarios verified through numerical examples. Finally, reference [15] uses principal component analysis to examine the correlation characteristics of wind and PV outputs, generating low-dimensional wind-PV coupling scenarios.
In the construction of water-PV hybrid systems, operational scheduling has been a focal point, involving planning and design consideration [16–18]. Reference [19] presents a scheduling model aimed at minimizing output fluctuations in water-PV hybrid systems, while reference [20] addresses the short-term volatility of PV generation by proposing a medium- and long-term optimal scheduling method to reduce short-term curtailment risks. By employing a PV energy loss function, reference [21] establishes the connection between short-term and long-term scheduling models and introduces an adaptive operating rule for water-PV systems. Reference [22] develops a PV power forecasting model along with a short-term optimal scheduling model based on a stepwise optimization algorithm to address the challenges of large-scale grid integration of PV energy. Reference [23] and [24] focus on optimizing energy scheduling in systems integrating Renewable Energy Sources (RESs), Electrical Energy Storage (EES), and Demand-Side Management (DSM) strategies to minimize operational costs, emissions, and load deviations, which can be extended to optimize the scheduling of water-solar hybrid systems for improved energy efficiency and grid stability. Collectively, these studies provide valuable reference frameworks for optimizing the scheduling of multi-energy complementary systems from various perspectives.
1.3 Study gaps
Despite existing models primarily optimizing scheduling based on hydropower stations as basic units [25–27], they often overlook the response characteristics of different units during the optimization process. For instance, when scheduling the output of hydropower stations, different units may exhibit unique operational characteristics, which can significantly affect the overall efficiency and effectiveness of the scheduling strategy. Furthermore, there is limited research focused on enhancing the capacity for integrating run-of-river hydropower and PV systems [28].
Building on previous studies, this paper employs non-parametric kernel density estimation in conjunction with Frank-Copula correlation analysis to derive the probability density function of water-solar output. We conduct detailed modelling for each unit of the run-of-river hydropower system, thereby constructing a multi-timescale optimization scheduling model aimed at minimizing the output fluctuations of the water-solar complementary system. Additionally, we employ piecewise linearization to address several nonlinear constraints, and the effectiveness of the proposed model is validated through simulation experiments.
1.4 Contributions
The main contributions of this paper are as follows:
-
We developed an optimization scheduling model for run-of-river hydropower and PV systems that is precise to each unit. This model addresses the weak regulation capacity of run-of-river hydropower and enhances the capability for integrating renewable energy sources, ultimately improving the ability of existing hydropower stations to accommodate PV generation.
-
By considering the spatiotemporal correlations, we enhance the predictive accuracy of water-solar output scenarios. This approach effectively addresses the forecasting challenges associated with the strong coupling of water and solar output in regions with complex terrain.
-
We provide a novel methodology for linearizing complex nonlinear constraints, which significantly improves the solution speed of the model.
2 Multi time scale scheduling model for cascade hydro photovoltaic complementarity considering spatiotemporal correlation
2.1 System composition and scheduling operation mode
The composition and scheduling operation mode of the time-scale cascade water-light complementary system are shown in Figure 1.
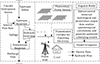 |
Fig. 1 Cascade hydropower and photovoltaic complementary joint generation system operation mode. |
As illustrated in Figure 1, the cascaded water-light complementary system consists of a runoff hydropower station, a photovoltaic power station, and a delivery system. Since the cascade hydropower in this example primarily relies on the runoff type power station, it lacks annual adjustment and water storage capabilities, commonly referred to as “relying on the weather for power generation”, meaning that electricity production is directly proportional to the available water supply.
Therefore, accurate predictions of water and solar resources in this region are essential. Copula correlation analysis, incorporating temporal and spatial correlations, is employed to generate a large number of scenarios, which are then aggregated to form typical scenarios. The objective function is to minimize fluctuations in external power supply, leading to multi-time scale scheduling for both the cascade runoff hydropower stations and PV power stations. When photovoltaic power generation is high, the output from the hydropower station is reduced; conversely, when photovoltaic generation is low or absent, the output of the hydropower station is increased to mitigate fluctuations in the outgoing power. This process primarily aims to discuss the maximum photovoltaic absorption capacity of the region, particularly in scenarios where the development of basin power stations is constrained.
Mixed Integer Linear Programming (MILP) offers advantages such as convenient expression of objective functions and constraints, along with good practicality, which has led to its widespread application in engineering practice. However, MILP also face challenges, including difficulties in handling nonlinear problems and high computational complexity. In this study, nonlinear constraints, such as reservoir water level and capacity constraints, are addressed using linearization techniques, including the introduction of binary indicator variables and head discretization. This transforms the original problem into the MILP framework, which is solved using the commercial solver GUROBI in MATLAB. Finally, the model’s effectiveness is validated through a case study involving five hydropower stations with a total of 13 generating units and one photovoltaic output group in a region of Sichuan province.
2.2 Scene generation considering water-light uncertainty and correlation
Water-light complementary systems often maximize delivery capacity by harnessing new energy sources. However, in the same region, the spatial and temporal correlations of water and light resources can significantly affect system performance. Ignoring these differences across regions may lead to solutions that do not accurately reflect the specific circumstances. Therefore, it is essential to consider the correlation between water and light when optimizing the scheduling of water-light complementary systems in a given area.
Copula functions are employed to study correlations between variables, capturing linear, nonlinear, symmetric, and asymmetric relationships. Common types include elliptic copulas (e.g., Gaussian copula, t-copula), Archimedean copulas (e.g., Clayton copula, Frank copula, Joe copula), and quadratic copulas. This paper selects the widely used Frank copula for analysis.
Firstly, the probability density functions for wind turbine and PV output over 720 h in a month are established using a non-parametric kernel density estimation method. Secondly, the joint probability distribution function for the two variables during each period is constructed using the Frank copula. Finally, sampled values for wind turbine and PV output in each period are obtained. Since the probability density functions derived from non-parametric kernel density estimation are expressed in a summative form, calculating the inverse function of their cumulative distribution functions can be challenging. To address this, cubic spline interpolation is utilized to determine the sample values corresponding to the cumulative probabilities.
2.2.1 Photovoltaic probability density function
Based on 30 days of historical water-light processing data, non-parametric kernel density estimation method is used to select Gaussian kernel function to generate the probability density function of water-light: (1)where: t = 1, 2, …, 720 represents 720 periods; xt, yt, respectively, hydropower and photovoltaic output in the t period;
  , respectively, represents the hydropower and photovoltaic output on the d day t hour; is the bandwidth; K(·) is a Gaussian kernel function, i.e.
![Mathematical equation: $$ K\left(\frac{{x}^t-{X}_d^t}{h}\right)=\left(\frac{1}{\sqrt{2\pi }}\right)\mathrm{exp}\left[-\frac{{\left({x}^t-{X}_d^t\right)}^2}{2{h}^2}\right]. $$](/articles/stet/full_html/2025/01/stet20240368/stet20240368-eq3.gif) (2)
(2)
2.2.2 Water light power generation
Obtained using the probability density function  , calculate the corresponding cumulative distribution function
  and
and  , and based on Frank-copulas connect function each time above the joint distribution of output function is established.
 (3)
(3)
Equation C is the Frank Copula function, which is:![Mathematical equation: $$ C\left({u}^t,{v}^t;{\lambda }^t\right)=-\frac{1}{{\lambda }^t}\mathrm{ln}\left[1+\frac{\left({\mathrm{e}}^{-{\lambda }^t{u}^t}-1\right)\left({\mathrm{e}}^{-{\lambda }^t{v}^t}-1\right)}{{\mathrm{e}}^{-{\lambda }^t}-1}\right], $$](/articles/stet/full_html/2025/01/stet20240368/stet20240368-eq8.gif) (4)where
(4)where  ;
;  ;
;  is the correlation coefficient, in which Kendall rank correlation coefficient, λt ∈ (−1, 1), λt ≠ 0. Where, λt > 0 indicates that ut, vt is positively correlated, λt → 0 indicates that ut, vt is nearly independent, and λt < 0 indicates that ut, vt is negatively correlated.
The joint distribution function of each period is sampled, and cubic spline interpolation is used to solve the problem of abrupt change of sampling points and sample hydraulic and photovoltaic output.
Taking hydropower output as an example, its cumulative probability interval is divided into d − 1 cell interval, i.e. ![Mathematical equation: $ \left[{\hat{F}}_{{Y}_d^t}\left({y}_d^t\right),{\hat{F}}_{{Y}_{d+1}^t}\left({y}_{d+1}^t\right)\right]$](/articles/stet/full_html/2025/01/stet20240368/stet20240368-eq12.gif) . With v as the independent variable and y as the dependent variable, it’s fitting polynomial is obtained by cubic spline interpolation method as follows:
. With v as the independent variable and y as the dependent variable, it’s fitting polynomial is obtained by cubic spline interpolation method as follows: (5)where: d denotes the number of days. For any sampling cumulative probability value
  , f = 1, 2, … , F is the sampling scale, which must fall within
 ![Mathematical equation: $ \left[{\hat{F}}_{{Y}_d^t}\left({y}_d^t\right),{\hat{F}}_{{Y}_{d+1}^t}\left({y}_{d+1}^t\right)\right]$](/articles/stet/full_html/2025/01/stet20240368/stet20240368-eq15.gif) . By plugging
. By plugging  into the above fitting polynomial, the PV output of each period can be obtained.
2.3 Multi time scale optimal scheduling model
2.3.1 Objective function
Considering the fluctuation of photovoltaic output, the function can be expressed as follows (6), with the goal of minimizing the fluctuation of the outgoing electricity of the water-light complementary system: (6)where: T = 24,168,720 is the number of short, medium and long term scheduling periods; N is the number of hydropower units, n is the unit number; Pplan Export power plan for a water-light complementary system.
2.3.2 Constraint condition
In the optimization scheduling model parameters, there are numerous constants and variables. Among these, certain variables hold significant importance for understanding the model proposed in this paper, as outlined in Nomenclature.
2.3.2.1 Reservoir level constraint
 (7)where:
  ,
, 
 are respectively the water level, upper and lower limits of the water level in the t period of the reservoir where the i Grade hydropower station is located.
2.3.2.2 Initial and final water level constraints
The water level at the end of the regulation period must be controlled to ensure that the effect on the next scheduling period is small (9). (8)
(8)
 (9)
(9)
In the formula,  ,
,  represent the water level at the beginning and end of the operation of Class i hydropower station respectively.
  indicates the allowable expected water level at the end of dispatching. ΔZ indicates the allowable water level difference.
2.3.2.3 Reservoir water balance constraint
Due to the time-delay characteristic of the water flow in a run-of-river cascade hydropower station, and the fact that the inflow to each station includes not only the discharge from the upstream plant but also the flow from the reach between stations, the water level balance can be expressed by the following equations (10), (11), and (12): (10)
(10)
 (11)
(11)
 (12)where: Vi,t, stands for the storage capacity at the end of the t period of the i class hydropower station; Ii,t refers to the average inflow flow of the i hydropower station during the t period, in m3/s; τ is the duration of water flow stagnation of the Grade i hydropower station and its higher hydropower station; Ri,t, which represents the interval natural flow of the upper reaches of Class i hydropower station;
  ,
,  , respectively represent the generation flow and waste water flow of Grade i hydropower station; Qi−1,t−τ indicates the discharge from the upper hydropower station to the lower hydropower station after the water flow delay is considered.
2.3.2.4 Constraints on outgoing flow of power station
The maximum allowable discharge of each hydropower station is limited: (13)where:
  ,
,  , represents the upper and lower limits of the discharge flow in the t period of the i hydropower station; Qi,t, stands for the discharge of the i hydropower station during the t period.
2.3.2.5 Output constraint of hydropower station
 (14)where:
  ,
,  respectively represent the lower limit and upper limit of output in the t period of the i hydropower station;
  indicates the output of a Class i hydropower station during the t period.
2.3.2.6 Water-storage relationship
The water level-storage capacity function of each cascade hydropower station is different and is typically fitted using a cubic spline, as shown in equation (15): (15)where:
  represents the water level in front of the dam in the t period of the i hydropower station;
  represents the water-storage relationship curve function of Grade i hydropower station.
2.3.2.7 Function relationship between tail water level and discharge volume
The relationship between tailwater level and discharge is typically fitted using a high-order polynomial, which is usually determined through hydraulic experiments. (16)where: Qi,t is the average discharge volume of the grade-i hydropower station during the t period;
  indicates the elevation of the tail water level at the end of the t period of the Class i hydropower station;
  is the functional relationship between the altitude of the tail water level and the discharge of the Grade-i hydropower station.
2.3.2.8 Unit output constraint
 (17)where: ui,n,t represents the start and stop status mark of hydropower unit n of the i hydropower station in the t period, where 1 indicates that it is running, and 0 indicates that it is stopped; Pi,n,t refers to the output of the hydropower unit n of the Class i hydropower station in the t period.
The relationship between Pi,n,t and the output of Grade i hydropower station is as follows: (18)
(18)
2.3.2.9 Climbing constraint
 (19)where:
  ,
,  respectively represent the downhill climbing capacity and uphill climbing capacity of hydropower unit n of Class i hydropower station.
2.3.2.10 Constraints on generating flow of units (Tab. 1)
 (20)where:
  ,
,  respectively represent the upper and lower limits of the generation flow of the hydropower unit n of the Class i hydropower station;
  indicates the generation flow of hydropower unit n of Class i hydropower station. Therefore, the total generation flow of each cascade power station can be written as:
 (21)
(21)
The constraints of multi time scale optimal scheduling model.
2.3.2.11 Start-stop constraint
 (22)
(22)
 (23)
(23)
In the formula, Hi,n,t,  are 0 − 1 variables, respectively, indicate the start and stop operation of the hydropower unit n of the Class i hydropower station in the t period. When
  ,
,  equal to 1, it indicates the start and stop operation of the Class i hydropower station n in the same period.
2.3.2.12 Hydropower unit head constraints
 (24)where: Hi,n,t,
  , respectively, represents the power generation head and head loss of hydropower unit n of Class i hydropower station at the t period.
2.3.2.13 Head loss function
 (25)where: The head loss function is often fitted with a quadratic function in hydraulics, where ai and bi represent the coefficient and constant term of the head loss function respectively, which are generally obtained by hydraulic experiments.
2.3.2.14 Unit active output characteristics
The generator output is determined by the generated head and flow rate. In this paper, a cubic spline fitting is used, as shown in equation (26): (26)where:
  represents the nonlinear relationship fitting function between the output of hydropower unit n of Class i hydropower station and the generation flow and generation head.
2.4 Linearization method
2.4.1 Model transformation (linearization)
Mixed integer programming is a linear programming problem involving both integer and continuous variables. The common solutions include branch and bound method, cut plane method, branch pricing method and heuristic algorithm. At present, there are mature commercial solvers with built-in MILP solution methods, such as GUROBI, CPLEX, etc. When solving this kind of planning problem, how to transform MINLP problem into MILP problem becomes the key. In the model used in this paper, equations (15), (16), (25) and (26) are nonlinear constraints. The linearization process in this paper is illustrated by the equations.
2.4.1.1 Triangular weights method
There is a complex functional relationship between the active output of the unit and the generating head and generating flow of the unit, and the multivariate multiple function is often linearized by the triangular weight method in the modeling process.
The expression a can be simplified to (27)where: τi,n is a constant, which corresponds to the hydropower unit n of the Class i hydropower station one by one.
The value range of generation flow  is divided into n1 − 1 intervals, whose endpoint values are Q1, Q2,…,
  , and the value range of generation head, Hi,n,t is divided into n2 − 1 intervals, whose endpoint values are H1, H2,…,
  , For any
 ![Mathematical equation: $ Q\in \left[{Q}_1,{Q}_{{n}_1-1}\right]$](/articles/stet/full_html/2025/01/stet20240368/stet20240368-eq69.gif) ,
, ![Mathematical equation: $ H\in \left[{H}_1,{H}_{{n}_2-1}\right]$](/articles/stet/full_html/2025/01/stet20240368/stet20240368-eq70.gif) ,
,  can be expressed as a linear combination of interval endpoint product values. Let Pij = Hi × Qj and the expression P = τQH be expressed as:
 (28)
(28)
λij satisfy: (29)where: λij is the introduced continuous decision variable with the value range from 0 to 1.
The multiple function is then converted to a linear function of λij.
2.4.1.2 Water level storage constraint linearization
The topography of different reservoirs is very different, so it is difficult to accurately describe the water-level storage function of different reservoirs. In practical application, when the water level is adjusted in a small range, it can be considered that the storage capacity changes linearly with the water level. Therefore, the maximum and minimum range of water level is divided into multiple cells, namely:![Mathematical equation: $$ \left[{Z}_{i,t}^{\mathrm{up}},{Z}_{i,t,1}^{\mathrm{up}}\right],\cdots \left[{Z}_{i,t,k-2}^{\mathrm{up}},{Z}_{i,t,k-1}^{\mathrm{up}}\right],\left[{Z}_{i,t,k-1}^{\mathrm{up}},{Z}_{i,t,k}^{\mathrm{up}}\right]. $$](/articles/stet/full_html/2025/01/stet20240368/stet20240368-eq74.gif) (30)
(30)
The 0 – 1 variable, θi,t,k, is introduced to represent the water level interval at the t period of the grade-i hydropower station, and 1 is taken to indicate that the water level at the t period of the grade-i hydropower station is within the k interval, so the water level storage constraint is linearized as follows: (31)
(31)
 (32)
(32)
The formula  can be replaced by the above formula. Other nonlinear constraints adopt the same piecewise linearization idea.
3 Case study
3.1 Engineering background
Based on the data of 15 units of 5 cascades hydropower stations in southwest China and their surrounding PV clusters, the proposed model is constructed to verify the effectiveness of the proposed model and method. Based on the actual output data and photovoltaic output data of hydropower stations in previous years, the probability density function of photovoltaic output related to hydropower output is estimated by using non-parametric nuclear density to characterize the spatial and temporal correlation of water and light in this area. Generate large amounts of data and cluster scenarios. Then the data after clustering is used as a typical scene input model to solve. In this example, the scheduling period is 1 day, 1 week, and 1 month. The scheduling period is 15 min within a day and 1 h in other periods. The parameters of some cascade power stations are shown in Table 2. Other model parameters are as follows: unit climbing capacity ΔPi,n equals to 240 MW/1 h; Minimum duration of unit startup and shutdown 1 h.
Main parameters of cascade hydropower station.
The optimization model was solved using MATLAB engineering software (configured with Yalmip environment) and commercial solver Gurobi. The computer was configured with INTEL (R) Core (TM) i5-13490F2.5GHz and RAM (16 GB).
3.2 Solution process
The solution process and steps of the multi-time scale complementary system scheduling model constructed in this paper based on correlation analysis are as follows:
-
Step 1: collect and input historical data of water-light output, and preliminarily process the data. Data cleaning and copula correlation analysis were carried out on the historical data to obtain the spatio-temporal correlation of water-optical output. A large number of photovoltaic output scenes on multi-time scales were generated based on the correlation coefficient, and scene clustering was carried out.
-
Step 2: Model simplification process. The nonlinear constraints proposed in the model are segmented linearized by triangular weight method to reduce the complexity of solution.
-
Step 3: Solve the optimization model at different time scales. In the short, medium and long time scales, the optimization model is solved respectively.
-
Step 4: Optimization model solution. In the MATLAB engineering software, the YALMIP environment is configured and the MILP model is solved using the commercial solver Gurobi.
-
Step 5: Output the result. Output optimal dispatching results, including reservoir water level changes, generator output, photovoltaic output, unit start and stop, output fluctuations, etc.
3.3 Result analysis
In this model, the unit is the smallest dispatching unit, and the photovoltaic group is concentrated in power station 1 feeding into the grid, which can directly obtain the dispatching results of hydropower units in different time scales. Taking Unit 2 as an example, Unit 2 has large storage capacity, strong adjustment capacity, can meet different scheduling needs, and participates in the deep coordination degree of photovoltaic complementarity. In the multi-time scale energy scheduling demand across the short, medium and long term, for a system with 5 cascade hydropower stations and 15 units, the effective absorption of photovoltaic power generation is successfully achieved through flexible scheduling of the units of these cascade hydropower stations. The scheduling strategy makes the photovoltaic power generation system have a high efficiency of energy utilization, and significantly reduces the volatility of the photovoltaic system.
3.3.1 Scenario prediction results
The result is shown in Figure 2. The photovoltaic output obtained by K-means clustering has a greater dependence on the selection of the initial clustering center, is easy to converge locally, and is sensitive to abnormal data caused by some abnormal weather and other reasons. In this paper, copula analysis method based on Kendall rank correlation coefficient is used to realize the correlation analysis of water-optic output, supported by historical water-optic data. On the basis of K-means clustering results, the output prediction that is lost due to ignoring the correlation between water and light is superimposed, which makes the photovoltaic prediction results closer to the reality.
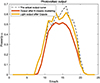 |
Fig. 2 Photovoltaic output after Copula. |
3.3.2 Multi-time scale optimization scheduling
3.3.2.1 Short-term scheduling
The short-term dispatching results are shown in Figure 3. The Level 5 hydropower station of the system is equipped with a total installed capacity of 513 MW and successfully absorbed 360 MW of photovoltaic power generation capacity. This shows that photovoltaic power generation plays an important role in the system, and its absorption ratio is significant, which puts forward higher requirements for the regulation capacity of cascade hydropower units. In addition, it needs to be further emphasized that the high proportion of photovoltaic power generation reflected in the regulation pressure of cascade hydropower units, highlighting the need for more refined and flexible scheduling strategies in practice. This strategy should take full account of the uncertainty and seasonality of photovoltaic power generation to ensure that the system can maintain stable operation under various working conditions and maximize the use of renewable energy.
 |
Fig. 3 Short-term dispatching results. |
Taking cascade power station 3 in the middle as an example, the process of start-stop, output and water abandonment in the fine dispatching process is explained. Explore the possibility of expansion of hydropower station.
Figure 4 shows the start-stop records of cascade power station 3 in the middle during the scheduling process. Combined with the scheduling results, the start-stop reasons of the unit during the refined scheduling process are illustrated. In this case, due to the relatively high proportion of renewable energy and significant load fluctuation, the unit of Cascade power Station 3 needs to perform frequent start-stop operations to maintain the power balance of the system and ensure the stable operation of the power system. The frequent start-stop shows that the adjustment pressure caused by the excessive proportion of new energy is too heavy, and the solution measures should be taken, including increasing the capacity of the unit and optimizing the layout of the cascade hydropower station.
 |
Fig. 4 The working units in hydropower stations 3. |
The output adjustment of the regulating unit is a crucial means to realize the absorption of new energy. In Figure 4, Cascade power Station 3 was observed to be operating at full capacity around 20:00 to 22:00 local time. The occurrence of this phenomenon is mainly due to the fact that the photovoltaic power generation output in southwest China in the summer rapidly fell to zero during this period, and other power station units have not yet increased their output in time to make up for the system load gap, resulting in cascade power station 3 requiring full load operation (Fig. 5).
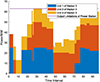 |
Fig. 5 Output of hydropower station 3. |
3.3.2.2 Medium and long term scheduling
Medium and long-term scheduling is scheduled within one week and within one month, respectively. The medium scheduling result is shown in Figure 6a, and the granularity is one hour.
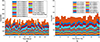 |
Fig. 6 (a) Medium-term dispatching results. (b) Long-term dispatching results of cascade hydropower systems. |
Medium- and long-term scheduling reflects the reliability and stability of long-term operation of complementary systems. As shown in Figure 6b, the granularity is 1 day.
Also take intermediate cascade power station 3 as an example to illustrate the start-stop process of the unit in the medium and long term scheduling process. The start-stop process of cascade power station 3 is shown in Figure 7. As shown in the figure, in the interim dispatching process, three units of Cascade hydropower Station 3 operate at the same time during the daily peak load, and some units are shut down for backup at other times. Combined with the operation results, it is shown that cascade hydropower station 3 plays the main regulating role and better buffers the volatility of renewable energy.
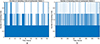 |
Fig. 7 (a) Medium-term dispatching and operation process of hydroelectric units. (b) Long-term dispatching and operation process of hydroelectric units. |
In the medium and long term operation process, cascade hydropower station 3 plays an obvious regulating role, which is full in the peak load period and spare in the low load period, so as to ensure the safe and stable operation of the complementary system.
The process of water abandonment reflects the expanded capacity of cascade hydropower. Due to the flow relationship between cascade hydropower stations, the downstream power station often has more interval flow and runoff than the upstream power station, so the downstream power station has greater output. However, due to the influence of storage capacity, the hydropower station with greater output does not have stronger regulatory performance (Fig. 8).
 |
Fig. 8 (a) Medium-term dispatch output process of hydropower station 3. (b) Long-term dispatch output process of hydropower station-3. |
As can be seen from Figure 9, the waste water flow of a cascade hydropower station increases in the order from upstream to downstream. Compared with the second-level hydropower station, the third-level hydropower station has the largest increment of abandoned water flow, indicating that the third-level hydropower station has not used up the incoming water from the upper-level hydropower station, and some interval flow has been ignored.
 |
Fig. 9 Water abandonment process of each power station. |
3.3.2.3 Volatility analysis
As shown in Figure 10, we have plotted a volatility graph covering a monitoring period of 720 time intervals. The results indicate that, within this timeframe, the system’s volatility does not exceed 3%. This low volatility metric suggests that the cascade hydropower station exhibits a remarkable capacity for absorbing photovoltaic energy. Such a level of volatility not only reflects the strong synergy between photovoltaic generation and the hydropower system but also provides a solid foundation for further optimization and enhancement of photovoltaic energy absorption efficiency in the future. This phenomenon underscores the significance of cascade hydropower stations in supporting the development of renewable energy and lays a theoretical groundwork for achieving a more stable and efficient energy utilization model.
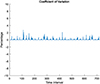 |
Fig. 10 Output volatility of the water-solar complementary system. |
The future of water-solar complementary systems holds significant promise for enhancing renewable energy integration. As technology advances, these systems can achieve greater efficiency and reliability, providing stable power generation even in variable conditions. Innovations in energy storage and smart grid technology will enable better management of energy output, maximizing the utilization of both solar and hydropower resources. Moreover, the growing emphasis on sustainable practices and reduced carbon footprints will drive further investment in such systems, positioning them as a key solution in the transition towards a more resilient and environmentally-friendly energy landscape.
4 Conclusion
The cascade water-PV complementary system utilizes the coordinated operation of run-of-river hydropower and PV generation to enhance renewable energy absorption and balance power output. Through the proposed multi-timescale optimization scheduling model, this study presents a robust framework for maximizing PV energy utilization at existing hydropower stations by addressing spatiotemporal correlations within the watershed. The main contributions and conclusions of this research are as follows:
-
Enhanced spatiotemporal scenario modeling: This study employs a Kendall rank-based Copula function to analyze historical data, identifying significant spatiotemporal correlations between water flow and solar energy. The resulting high-dimensional uncertainty scenarios offer a precise representation of water-PV interactions, enabling more accurate scheduling optimization within the watershed.
-
Unit-Level scheduling optimization: The developed fine-grained scheduling model, applied at the individual hydropower unit level, strengthens the renewable energy absorption capability of the water-PV system by allowing flexible, coordinated control across multiple stations and units, thus enhancing overall operational complementarity.
-
Improved computational efficiency through constraint simplification: The integration of the triangular weighting method and piecewise linearization reduces the complexity of nonlinear constraints, while binary indicator variables further accelerate the solution process, ensuring that the model remains computationally feasible.
-
Impact on PV absorption and power supply quality: By optimizing the dispatch of run-of-river hydropower and integrating local PV generation, the proposed model provides actionable insights into increasing PV energy absorption at existing hydropower facilities, thereby advancing renewable energy integration and supporting stable, high-quality power supply.
This research demonstrates the feasibility and practical significance of a multi-timescale scheduling approach for cascade water-PV complementary systems, providing a valuable reference for renewable energy integration and enhancing local PV utilization through efficient hydropower management.
Funding
This work is supported by the science and technology project of State Grid Southwest Branch Corporation (SGSW0000FGJS2310063).
References
- Zhang L., Xie J., Zhang Q., Fu D. (2021) Synergistic benefit allocation method for wind-solar-hydro complementary generation with sampling-based Shapley value estimation method, Electric Power Autom. Equip. 41, 126–132. [Google Scholar]
- Huang W., Li Y., Li J., Wu F., Wang Z. (2023) Multi-time scale joint optimal scheduling for wind photovoltaic electrochemical energy storage-pumped storage considering renewable energy uncertainty, Electric Power Autom. Equip. 43, 4, 91–98. [Google Scholar]
- Zhao H., Xing Y., Wang Y., Li Q., Duan H., Song X. (2024) Multi-objective cooperative optimization of communication base station and active distribution grid under dual carbon targets, Sci. Technol. Energy Trans. 79, 71. [Google Scholar]
- Ming B., Liu P., Cheng L., Zhou Y., Wang X. (2018) Optimal daily generation scheduling of large hydro-photovoltaic hybrid power plants, Energy Convers. Manage. 171, 528–540. [CrossRef] [Google Scholar]
- Zhang Z., Tang H., Qin H., Luo B., Zhou C., Huang L. (2022) Benefit stability multi-objective optimal operation of wind-solar-hydropower hybrid system, J. Hydraulic Eng. 53, 9, 1073–1082. [Google Scholar]
- Wang Z., Wu F., Li Y., Li J., Liu Y., Liu W. (2023) Day-ahead dispatch approach for cascaded hydropower photovoltaic complementary system based on two-stage robust optimization, Energy 265, 126145. [CrossRef] [Google Scholar]
- Yuan J., Gao Y., Xie B., Li H., Jiang W. (2023) Prediction method of photovoltaic power based on combination of CEEMDAN-SSA-DBN and LSTM, Sci. Technol. Energy Trans. 78, 15. [Google Scholar]
- Lu L., Yuan W., Su C., Wang P., Cheng C., Yan D., Wu Z. (2021) Optimization model for the short-term joint operation of a grid-connected wind-photovoltaic-hydro hybrid energy system with cascade hydropower plants, Energy Convers. Manage. 236, 114055. [CrossRef] [Google Scholar]
- Liu B., Lund J., Liao S., Jin X., Liu L., Cheng C. (2020) Optimal power peak shaving using hydropower to complement wind and solar power uncertainty, Energy Convers. Manage. 209, 112628. [CrossRef] [Google Scholar]
- Guo Y., Ming B., Huang Q., Li Y. (2023) Day-ahead robust optimal scheduling of hydro-wind-PV-storage complementary system considering the steadiness of power delivery, Trans. China Electrotechn. Soc. 38, 9, 2350–2363. [Google Scholar]
- Zhang J., Cheng C., Shen J., Li X., Zhao Z. (2020) Short term joint optimal operation method for high proportion renewable energy grid considering wind-solar uncertainty, Proc. CSEE 40, 18, 5921–5932. [Google Scholar]
- Zhang B., Shen J., Cheng C. (2022) Peak-shaving method of hydro-wind power complementary system based on C-vine copula theory, Proc. CSEE 42, 15, 5523–5535. [Google Scholar]
- Xin K., Ma Q., Xu Q., Wang Z., Liu Y. (2023) Wind power output sequence scenario generation method based on monthly division and specified day type, Autom. Electric Power Syst. 47, 15, 151–161. [Google Scholar]
- Woodruff D., Deride J., Staid A., Watson JP., Slevogt G., Silva-Monroy C. (2018) Constructing probabilistic scenarios for wide-area solar power generation, Solar Energy 160, 153–167. [CrossRef] [Google Scholar]
- Densing M., Wan Y. (2022) Low-dimensional scenario generation method of solar and wind availability for representative days in energy modeling, Applied Energy 306, 118075. [CrossRef] [Google Scholar]
- Yang Z., Liu P., Cheng L., Liu D., Ming B., Li H., Xia Q. (2021) Sizing utility-scale photovoltaic power generation for integration into a hydropower plant considering the effects of climate change : a case study in the Long-yangxia of China, Energy 236, 121519. [CrossRef] [Google Scholar]
- Zhang Y., Ma C., Lian J., Pang X., Qiao Y., Chaima E. (2019) Optimal photovoltaic capacity of large-scale hydro-photovoltaic complementary systems considering electricity delivery demand and reservoir characteristics, Energy Convers. Manage. 195, 597–608. [CrossRef] [Google Scholar]
- Shen J., Wang Y., Cheng C., Li X., Miao S. (2022) Research status and prospect of generation scheduling for complementary system hydropower-wind-solar energy, Proc. CSEE 42, 11, 3871–3885. [Google Scholar]
- Song K. (2021) Optimal scheduling of hydro-photovoltaic complementary generation system based on scene feature clustering, Water Resour. Power 39, 6, 202–205. [Google Scholar]
- Ming B., Li Y., Liu P., Yimin W. (2021) Long-term optimal operation of hydro-solar hybrid energy systems nested with short-term energy curtailment risk, J. Hydraulic Eng. 52, 6, 712–722. [Google Scholar]
- Ming B., Liu P., Guo S., Cheng L., Zhang J. (2019) Hydropower reservoir reoperation to adapt to large-scale photovoltaic power generation, Energy 179, 268–279. [CrossRef] [Google Scholar]
- Jia Y., Lin M., Dong Z. (2020) Research on optimal operation of hydro photovoltaic complementarity in Longyangxia hydropower station, Water Resour. Power 38, 10, 207–210. [Google Scholar]
- Heydar C., Ghasem D., Seyed M., Salah B (2020) Tri-objective scheduling of residential smart electrical distribution grids with optimal joint of responsive loads with renewable energy sources, J. Energy Storage 27, 101112. [CrossRef] [Google Scholar]
- Heydar C., Ghasem D., Seyed M., Salah B. (2019) Tri-objective optimal scheduling of smart energy hub system with schedulable loads, J. Clean. Prod. 236, 117584. [CrossRef] [Google Scholar]
- Heydar C., Ghasem D., Salah B. (2020) Multi-objective performance of smart hybrid energy system with Multi-optimal participation of customers in day-ahead energy market, Energy Build. 216, 109964. [CrossRef] [Google Scholar]
- Heydar C., Salah B., Ghasem D (2020) Day-ahead scheduling problem of smart micro-grid with high penetration of wind energy and demand side management strategies, Sustain. Energy Technol. Assess. 40, 100747. [Google Scholar]
- Heydar C., Ghasem D., Seyed M., Salah B. (2020) Multi-objectives optimal scheduling in smart energy hub system with electrical and thermal responsive loads, Environ. Clim. Technol. 24, 1, 209–232. [CrossRef] [Google Scholar]
- Antoine P., Astrig B., Guillaume B., Celine H., Gregory V. (2023) Metamodeling the optimal total revenues of the short-term optimization of a hydropower cascade under uncertainty, Sci. Technol. Energy Trans. 78, 31. [Google Scholar]
All Tables
All Figures
|
Fig. 1 Cascade hydropower and photovoltaic complementary joint generation system operation mode. |
| In the text | |
|
Fig. 2 Photovoltaic output after Copula. |
| In the text | |
|
Fig. 3 Short-term dispatching results. |
| In the text | |
|
Fig. 4 The working units in hydropower stations 3. |
| In the text | |
|
Fig. 5 Output of hydropower station 3. |
| In the text | |
|
Fig. 6 (a) Medium-term dispatching results. (b) Long-term dispatching results of cascade hydropower systems. |
| In the text | |
|
Fig. 7 (a) Medium-term dispatching and operation process of hydroelectric units. (b) Long-term dispatching and operation process of hydroelectric units. |
| In the text | |
|
Fig. 8 (a) Medium-term dispatch output process of hydropower station 3. (b) Long-term dispatch output process of hydropower station-3. |
| In the text | |
|
Fig. 9 Water abandonment process of each power station. |
| In the text | |
|
Fig. 10 Output volatility of the water-solar complementary system. |
| In the text | |
Current usage metrics show cumulative count of Article Views (full-text article views including HTML views, PDF and ePub downloads, according to the available data) and Abstracts Views on Vision4Press platform.
Data correspond to usage on the plateform after 2015. The current usage metrics is available 48-96 hours after online publication and is updated daily on week days.
Initial download of the metrics may take a while.