")
")
Fig. 13
Download original image
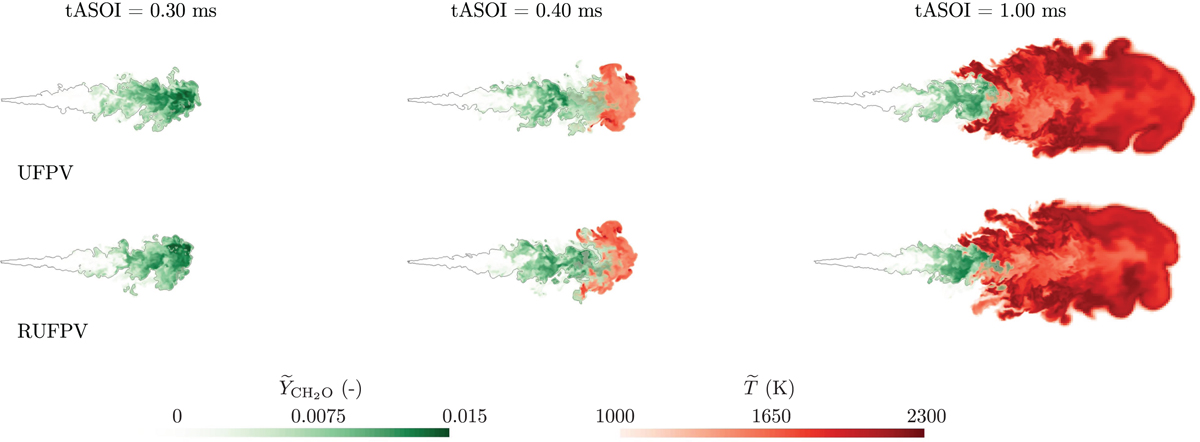
Distribution of the CH2O mass fraction ![]() and the temperature
and the temperature ![]() obtained using the original UFPV approach (top row) and the RUFPV approach (bottom row) for 0.30 ms (left column), 0.40 ms (middle column) and 1.00 ms ASOI (right column). The iso-line of
obtained using the original UFPV approach (top row) and the RUFPV approach (bottom row) for 0.30 ms (left column), 0.40 ms (middle column) and 1.00 ms ASOI (right column). The iso-line of ![]() is shown as gray contour.
is shown as gray contour.
Current usage metrics show cumulative count of Article Views (full-text article views including HTML views, PDF and ePub downloads, according to the available data) and Abstracts Views on Vision4Press platform.
Data correspond to usage on the plateform after 2015. The current usage metrics is available 48-96 hours after online publication and is updated daily on week days.
Initial download of the metrics may take a while.