")
")
Fig. 10
Download original image
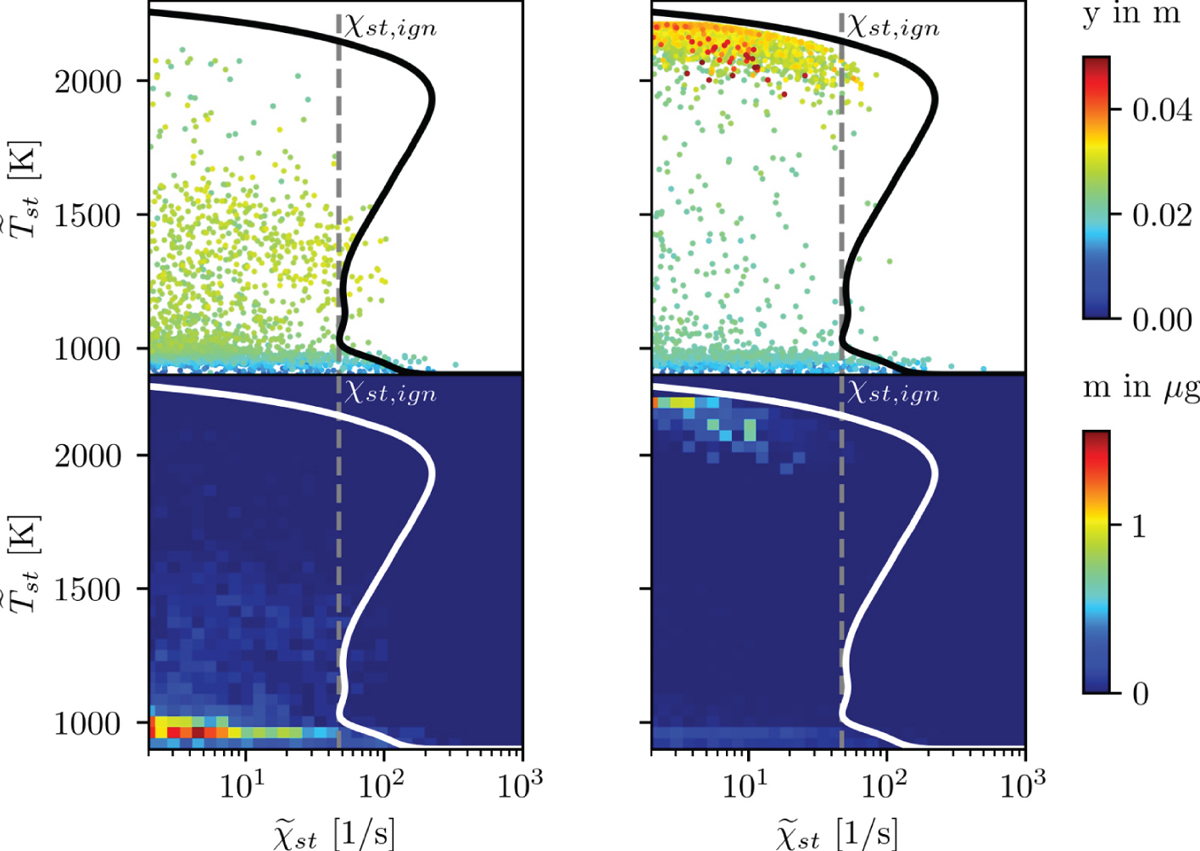
Scatter plot of the temperature under stoichiometric conditions ![]() over the corresponding scalar dissipation rate
over the corresponding scalar dissipation rate ![]() colored by the axial distance to the nozzle (top row) and corresponding mass distribution (bottom row) for 0.40 ms (left column) and 1.00 ms (right column) ASOI.
colored by the axial distance to the nozzle (top row) and corresponding mass distribution (bottom row) for 0.40 ms (left column) and 1.00 ms (right column) ASOI.
Current usage metrics show cumulative count of Article Views (full-text article views including HTML views, PDF and ePub downloads, according to the available data) and Abstracts Views on Vision4Press platform.
Data correspond to usage on the plateform after 2015. The current usage metrics is available 48-96 hours after online publication and is updated daily on week days.
Initial download of the metrics may take a while.