")
")
| Issue |
Sci. Tech. Energ. Transition
Volume 80, 2025
Emerging Advances in Hybrid Renewable Energy Systems and Integration
|
|
|---|---|---|
| Article Number | 11 | |
| Number of page(s) | 24 | |
| DOI | https://doi.org/10.2516/stet/2024101 | |
| Published online | 20 janvier 2025 | |
Regular Article
Navigating the energy crisis: automakers’ coopetition strategies under dual credit policy
1
School of Business Administration, Guizhou University of Finance and Economics, Guiyang 550025, Guizhou, China
2
Guizhou Vocational College of Economics and Business, Duyun 558022, Guizhou, China
3
Qiannan Normal University for Nationalities, Duyun 558000, Guizhou, China
* Corresponding author: Cette adresse e-mail est protégée contre les robots spammeurs. Vous devez activer le JavaScript pour la visualiser.
Received:
21
August
2024
Accepted:
13
November
2024
Abstract
To tackle the energy and climate crises and achieve sustainable development, China has designated the development of new energy vehicles (NEVs) as a national strategy. This paper delves into the coopetition strategy of dual-model automakers under the dual credit policy (DCP) using a subsidy-R&D-production three-stage game model, considering government subsidies and consumer preferences. The model explores various strategies, including full competition and different R&D cooperation scenarios for fuel vehicles (FVs) and NEVs. Key findings include: (1) R&D subsidies boost NEVs R&D investments but may not always optimize social welfare. (2) When NEVs technology spillovers are low, firms should fully cooperate; otherwise, the FVs R&D cooperation is optimal, especially with high FVs spillovers. (3) Investments and outputs in both vehicle types positively correlate with technology spillovers, and consumer preferences. Conversely, FVs equilibrium decreases with NEVs credit proportion and fuel consumption disparities. (4) The credit price positively influences R&D investments and outputs of NEVs, but its effects on FVs’ R&D investments, outputs, corporate profits, and social welfare vary based on market dynamics. Recommendations include optimizing subsidy policies, supporting low-carbon FVs, enhancing infrastructure, and strengthening DCP regulations to stabilize credit price expectations.
Key words: Dual credit policy / Government subsidies / Coopetition strategies / R&D investments / Consumer preference / Technology spillovers
© The Author(s), published by EDP Sciences, 2025
 This is an Open Access article distributed under the terms of the Creative Commons Attribution License (https://creativecommons.org/licenses/by/4.0), which permits unrestricted use, distribution, and reproduction in any medium, provided the original work is properly cited.
1 Introduction
Currently, the global energy shortage is becoming increasingly severe, and extreme weather events are occurring more frequently, posing a serious threat to sustainable development [1]. In response to these challenges, governments worldwide are taking action. Notably, China, as a prominent and responsible major power, has established the 3060 Strategy. Benefiting from government financial support, the new energy vehicle (NEV) industry has achieved rapid development as a crucial component of this ambitious strategy. However, with the emergence of fraud and rent-seeking behaviors, the government has shifted its policy focus towards market-based mechanisms. The “Parallel Management Regulation for Corporate Average Fuel Consumption (CAFC) and NEV Credits for Passenger Cars” (Dual Credit Policy, DCP) has emerged and become the predominant policy driving industrial development [2]. The DCP exerts a significant influence on both fuel vehicles (FVs) and NEVs through its structured implementation of CAFC credits and NEV credits. By mandating that traditional automobile manufacturers improve their fuel efficiency metrics and adopt advanced technologies for electrification, the DCP creates a compelling regulatory framework that necessitates innovation within the automotive sector. As manufacturers strive to meet the increasingly stringent fuel efficiency standards, they are prompted to invest heavily in research and development aimed at optimizing internal combustion engine performance, integrating lightweight materials, and enhancing overall vehicle design. Concurrently, the introduction of NEV credits serves as a catalyst for the transition towards electric mobility, compelling manufacturers to expand their electric vehicle portfolios and adopt cutting-edge battery technologies. However, the DCP’s stringent requirements and incentives have also resulted in heightened competition among automotive producers, as both established firms and emerging startups vie for market share in the burgeoning NEV segment [3].
To maintain their competitive advantage, automakers must continuously strengthen their technological innovation capabilities [4]. However, technological innovation activities are characterized by large investments, long cycles, high risks, and technological spillovers [5, 6]. Consequently, it is challenging to effectively navigate the increasingly fierce market competition independently. As a result, collaboration among competitors has increasingly emerged as a prevalent phenomenon in corporate operations [7–13]. For instance, in 2017, CCAG (China Changan Automobile Group) signed a strategic cooperation framework agreement with FAW (First Automobile Works) and DFMC (Dongfeng Motor Corporation) to collaborate on mutual technological innovation. Similarly, in 2019, SAIC (Shanghai Automotive Industry Corporation) and GAC (Guangzhou Automobile Corporation) established a strategic cooperation agreement to jointly leverage industry chain resources and engage in R&D cooperation focused on NEVs, artificial intelligence, internet connectivity, and lightweight materials. Additionally, in 2023, Geely and CCAG announced a strategic partnership aimed at platform sharing and technological R&D for both FVs and NEVs, with the objective of optimizing their respective strengths through integrated resource management.
Undoubtedly, while these firms engage in collaborative efforts to share and complement each other’s strengths in automotive technologies, they still maintain a competitive relationship in their core businesses [14, 15]. The DCP plays a pivotal role in shaping the automotive industry’s development trajectory by driving improvements in fuel efficiency for FV and promoting the research and development of NEV technologies, thereby enhancing battery performance and extending range capability. Therefore, companies must address several practical issues, including whether to collaborate on FVs and NEVs under the DCP, how to clearly define the scope of their cooperation, and what competitive strategies to implement.
R&D subsidies serve as crucial governmental instruments to rectify market failures in innovation [16]. Technology spillovers, a key facet of R&D externalities, enable competitors to benefit from technological advancements without bearing any costs, whereas innovative companies may find it difficult to obtain corresponding returns, thus affecting their enthusiasm for R&D investment [6, 17]. In response, scholars advocate adopting competitive and cooperative strategies alongside R&D subsidies to address these market inefficiencies. However, despite the efforts made by enterprises in R&D competition and cooperation, R&D inventments are still unsatisfactory [18, 19], which highlights the need for continued government subsidies for R&D [20]. Consequently, under government subsidy policies, particularly within the framework of the DCP, determining the optimal competitive strategy becomes a critical strategic consideration for automakers.
Consumer preferences for low-carbon options and range capabilities play pivotal roles in shaping firms’ technological innovation trajectories and significantly influence their R&D and production strategies [21]. The growing environmental awareness among consumers is increasingly recognized as a catalyst for technological progress. Presently, consumers are highly concerned about environmental issues and are willing to pay a premium for high energy-efficiency FVs and NEVs [22–24]. This conscientious consumer behavior spontaneously contributes to social green development goals [25]. However, challenges such as limited range and insufficient charging infrastructure remain critical barriers to the widespread adoption of NEVs [26–28]. Due to the long construction period of charging infrastructure and the involvement of multiple stakeholders, solving these problems – especially improving the range capability in the short term – is crucial to increasing consumers’ willingness to adopt NEVs [29, 30]. Since consumers’ low-carbon and range preferences significantly impact demand, effectively assessing these preferences is crucial for automakers to formulate cooperation strategies under the DCP. This assessment not only improves the accuracy of automobile manufacturers’ market forecasts and informs their R&D and production decisions, but also optimizes the applicability of DCP.
In view of this, this study aims to explore the coopetition strategies of automakers taking into account subsidies and preferences under the DCP and primarily solves the following problems: Firstly, What impact does the DCP have on FVs and NEVs, and how to modify and improve it? Secondly, how should the government determine the subsidy rate within the framework of the DCP to maximize social welfare? Thirdly, what cooperation strategies should companies adopt under the DCP when considering subsidies and consumer preferences? Lastly, how do critical factors such as the DCP, technology spillovers, and consumer preferences for low-carbon and range capabilities influence firms’ optimal strategies?
The remainder of the paper is structured as follows: Section 2 comprises the literature review. Section 3 introduces the related assumptions and develops the models. Section 4 is the model solution. In Section 5, our focus is on the selection of optimal strategies. Section 6 conducts an analysis of impact factors. Section 7 presents the discussion. Finally, Section 8 summarizes the findings, provides policy recommendations, and proposes directions for future research.
2 Literature review
The studies related to this paper focus on four main aspects: the DCP, firms’ coopetition strategies, the impact of subsidies on the R&D investments, and the impact of consumers’ low-carbon and range preferences.
2.1 The DCP
As a sustainable development policy in emerging markets, the DCP achieves energy savings and emissions reduction goals in the automotive industry [31], while also significantly promotes the development of the NEV industry [32]. Since its implementation, relevant studies have primarily focused on evaluating and comparing the DCP [33, 34], as well as on the production decision-making of automobile firms [35, 36]. For instance, Cheng and Fan [3] investigated the production and operational strategies of both FVs and NEVs manufacturers competing under the DCP framework, finding potential negative impacts on the automotive supply chain performance. Although the DCP has demonstrated potential in promoting sustainability objectives, certain research indicates that it may have unintended consequences on supply chain performance. The automotive sector’s sustainable transformation is still the subject of ongoing research as researchers endeavor to comprehend the policy’s intricate effects on market dynamics, technological innovation, and industry structure.
The current literature on R&D subsidies under the DCP is relatively sparse, with only a handful of studies addressing this intersection. Lu and Yan [37] examined the implications of credit trading and compared equilibrium outcomes in R&D competition and cooperation among duopolistic NEVs firms, yet did not delve into government subsidies or consumer preferences. Zheng et al. [38] developed a three-stage vertical supply chain game model involving NEVs suppliers and manufacturers to explore the effects of R&D subsidies, but overlooked considerations of consumer preferences and horizontal competition. Wang et al. [39] conducted research on the production decisions of a single automaker, primarily focusing on consumers’ low-carbon preferences. However, their study did not include an analysis of consumers’ range preferences or the dynamics of horizontal competition within the automotive supply chain.
2.2 Firms’ coopetition strategies
Research on corporate coopetition strategies has attracted widespread attention from global academic circles. D’Aspremont and Jacquemin [40] were pioneers in developing the foundational analytical framework for the R&D cooperation game. They conducted a comparative analysis of R&D investments and output among duo-oligopoly firms that produce homogeneous products, and explored the impact of of R&D competition and R&D cooperation in the context of technological spillovers. Their work introduced the influential AJ model, which has since shaped the study of corporate cooperation. Recognizing the limitations inherent in the duo-oligopoly assumption, Suzumura [41] extended this framework to encompass scenarios involving multiple oligopolies. His research validated the AJ model’s findings across a broader spectrum of conditions, thus reinforcing its theoretical robustness. Subsequently, Kamien et al. [18] extended the AJ model by examining the impact of product differentiation and firm organizational structure. They concluded that fostering R&D cooperation, particularly in environments characterized by technological spillovers and shared R&D outcomes, can optimize firm profitability. Thereafter, Atallah [42] examined the influence of horizontal and vertical spillovers on firms’ R&D investments under different organizational models. His study highlighted that the vertical R&D cartel model tends to attract the highest level of R&D investments. However, technological investment is a necessary condition for technological spillover, while absorptive capacity constitutes a sufficient condition for technological spillover. The literature above does not consider absorptive capacity, nor does it focus on the automotive sector influenced by industrial policy and consumer preferences.
The implementation of DCP has had a significant impact on the automobile industry, and automobile manufacturers need to adjust their R&D and production strategies according to policy changes. Based on cross-chain cooperation, Li et al. [43] investigated how the dual credit policy and subsidy policy affect production decisions among manufacturers of FVs and NEVs. Huo et al. [44] examined credit trading strategies and cooperation tactics within the supply chain involving FVs and NEVs manufacturers and dealers, taking into account consumer sensitivity to fuel consumption and range capabilities. However, the strategies discussed in the literature above primarily focus on credit trading mechanisms and overlook the competitive dynamics related to technological innovation.
Significantly, Yuan et al. [45] analyzed the strategic selection in R&D as well as production stages between competition and coopetition among duopoly heterogeneous manufacturers of NEVs under the DCP. Their study takes into account factors such as R&D subsidies and consumers’ range preferences. However, their research focuses exclusively on coopetition strategies among NEV manufacturers, overlooking dual-model companies engaged in both FVs and NEVs production. The automotive sector, especially for dual-model automakers, is influenced by factors from both the supply and demand sides. The R&D efforts not only affect the efficacy of DCP and subsidy, but also enhance consumer preferences for low-carbon and range capabilities. Simultaneously, they collectively impact automakers’ R&D investments, production decisions, and competitive strategies compared to traditional industries. Existing literature lacks studies on the coopetition strategies from this perspective, our forthcoming research aims to significantly extend these findings.
2.3 The impact of subsidies on the R&D investments
Firms’ R&D investments are often accompanied by the issue of government subsidies. Bronzini and Piselli [46] highlighted that these subsidies typically yield a positive impact on firms’ innovation efforts. Similarly, You and Zhu [47] developed a three-stage dynamic game model to study the impact of R&D subsidies under different competition frameworks – R&D competition, R&D cartel, and Research Joint Venture (RJV) cartel. Their analysis highlights the significance of government subsidy policies in optimizing firms’ technology innovation investments. Furthermore, Chen et al. [48] provided empirical insights into how R&D subsidies and non-R&D subsidies affect the Initial Public Offering (IPO) performance of entrepreneurial firms. They observed an inverted U-shaped relationship between R&D subsidies and IPO performance, indicating that while moderate levels of R&D support enhance performance, excessive subsidies might not yield commensurate benefits. On the other hand, non-R&D subsidies were found to consistently boost IPO performance, illustrating their positive impact on firms. It is important to note that the literature reviewed predominantly focuses on traditional industries and lacks exploration of the NEVs industry.
In relation to the impact of government subsidies on R&D investments in NEVs, several studies contributed significant insights. Gao and Hu [49] argued that governmental financial support notably enhances the performance and size of firms, as well as their patent output. Cao et al. [50] discovered that heightened levels of government funding facilitate automobile manufacturers in surmounting technical barriers, achieving innovative breakthroughs, scaling the NEV industry, and fostering consumer adoption. Liu and Xiao [51] examined the development of electric vehicles under policy incentives using a system dynamics model of DEA. Their results show that the market penetration rate of electric vehicles in China is mainly affected by national policies, and the combination of various subsidy policies has become the best strategy to stimulate the NEV market. Wu et al. [52] conducted an empirical analysis on the impact of government R&D subsidies on innovation among Chinese firms. The study revealed that firms with advanced technological capabilities tended to favor collaborative R&D, whereas those with lower technological capabilities opted for internal R&D. It is notable that the aforementioned scholars examined the effects of subsidy policies from various perspectives, yet they did not take account for the influence of the DCP, a predominant industrial policy.
2.4 The impact of consumers’ low-carbon and range preferences
With the escalation of environmental issues, more and more consumers are spontaneously paying attention to the fuel efficiency of FVs. Currently, numerous scholars integrate consumer preferences for low-carbon options into research on supply chain decision-making. For instance, Du et al. [53] discussed the impact of consumers’ low-carbon preferences on supply chains that focus on carbon emissions. Similarly, Ji et al. [54] investigated pricing strategies and emission reduction decisions in dual-channel supply chains considering consumer low-carbon preferences. Based on a carbon cap-and-trade system, Peng et al. [55] studied decision-making under uncertain returns, especially considering preferences for low-carbon influences. As consumers’ awareness of low-carbon and environmental protection increases, people’s willingness to pay a premium for low-fuel consumption products continues to increase [56]. Hence, the incorporation of consumer low-carbon preferences into models becomes increasingly imperative and realistic.
Regarding the influence of consumer range preferences, numerous scholars have underscored the pivotal role of range in consumer decision-making [26, 57, 58]. Avci et al. [26] identified that concerns over mileage anxiety due to limited range and insufficient charging infrastructure severely restrict the adoption. Lim et al. [58] explored how consumer concerns regarding mileage and resale value impact the widespread adoption of NEVs. Consumer preferences for NEVs are shaped not only by demand-side factors like range but also by supply-side government policies in the automotive industry [59]. However, existing literature predominantly confirms empirically the constraining effect of range without delving deeper into how consumer range preferences influence automakers’ R&D investments, profits, and social welfare. Moreover, these studies do not account for the impact of the DCP. In reality, with the DCP dominating industry development, automobile firms can only achieve sustainable and strong growth by improving the fuel efficiency of pure electric vehicles and the range capabilities of NEVs through continuous R&D innovation and technological upgrading.
Overall, some scholars have confirmed that the fuel consumption level of FVs and the range of NEVs are crucial factors influencing consumer adoption. Yet, little research explores how consumer preferences for low-carbon and range influence the selection of coopetition strategies. Moreover, studies examining the combined effects of both factors are scarce. In contrast to prior research, this paper systematically investigates the selection of coopetition strategies between two dual-vehicles manufacturers, taking into account subsidies and consumer preferences under the DCP. It offers policy recommendations and managerial insights from governmental and corporate perspectives to promote the high-quality development of Automobile industry.
3 Model assumptions and construction
Current research on the automotive industry’s development under the DCP typically focuses on scenarios with a single manufacturer producing either FVs or NEVs, or two manufacturers specializing separately in FVs and NEVs. However, these studies often overlook the combined impacts of the DCP, subsidy policies, and consumer preferences. Therefore, this paper concentrates on two dual-vehicles manufacturers that produce both FVs and NEVs, such as SAIC, Geely, and Great Wall, which are enhancing their fuel technology while accelerating their transition to electrification. In this context, the paper develops a three-stage game model involving subsidies, R&D, and production decisions between the government and two dual-vehicles manufacturers under the DCP. It examines how these manufacturers make decisions of R&D and production, as well as their competitive strategy, considering R&D subsidies and consumer low-carbon and range preferences. The supply chain system structure is shown in Figure 1.
 |
Fig. 1 The supply chain system structure. |
The DCP stipulates the necessity of emission reduction for FVs and range enhancement for NEVs. Accordingly, this paper assumes that R&D for FVs is aimed at improving fuel efficiency, while R&D for NEVs focuses on range enhancement. When consumers have Low-Carbon and range preferences, referencing Peng et al. [55] and Zhou et al. [60], the inverse demand function for NEVs and FVs can be expressed as: (1)
(1)
 (2)
(2)
Among them, a represents the automobile market size; θ denotes the proportion of potential demand for NEVs; pei (pfi) and qei (qfi) symbolizes the market clearing price and demand of NEVs (FVs), respectively; xei (xfi) signifies the innovative achievements of NEVs (FVs), which reflect in the degree of improvement in range (fuel efficiency). ηi (βi) indicates the level of technology spillovers of NEVs (FVs). Obviously, these values should satisfy 0 < ηi(βi) ≤ 1. Due to the existence of spillover effects, the R&D achievements of one firm can also promote those of its competitors, but the extent of this promotion depends on the absorption capacity of the other party. h(g) represents the coefficient of consumers’ range preference (low-carbon preference). A higher value indicates stronger consumer preferences, meaning consumers are willing to pay higher prices for NEVs (FVs) with strong range (higher fuel efficiency). Here and below, i, j = 1, 2 and i ≠ j.
Set the unit production cost of NEVs (FVs) as cei (cfi). Currently, the production cost of FVs is generally lower than that of NEVs, i.e., cei > cfi. Without loss of generality, we standardize cfi to 0, using c to indicate cei, and obviously θa > c. To obtain NEV (FV) innovative achievements xei (xfi), both automakers must incur the R&D cost  (
( ). Therefore, xei (xfi) can measure the level of R&D investments in NEVs (FVs). γ (γ > 0) represents the coefficient of R&D efficiency, and a larger γ indicates lower R&D efficiency. The amount of government subsidy provided to NEVs automakers is
  , where s ∈ [0, 1] denotes the subsidy rate.
The second revised version of the DCP clarifies the calculation rules for NEV credits and CAFC credits. According to the updated guidelines, NEV credits are determined by subtracting the standard credits from the actual credits. Essentially, the value of NEV credits correlates positively with the driving range. If the market price of NEV credits is p0, the accounting coefficient of NEV credits is n, and the required proportion of NEV credits is λ, then the income from NEV credits for the firm Mi can be expressed as: p0(n(xei + ηixej)qei − λqfi). Similarly, the calculation rule for CAFC credits is based on the difference between the firm’s average fuel consumption target and the actual consumption, multiplied by the production quantity or import quantity of passenger cars. Setting the government-mandated compliance value as δ, the initial fuel consumption value per 100 km is φ, and after technological innovation, the fuel consumption value per 100 km becomes φ − xfi − βjxfj. To ensure that the DCP effectively regulates FVs, it is assumed that even after R&D, the fuel consumption level of FVs still does not meet the standard. Relaxing this assumption does not affect the study’s conclusions. Then, the negative CAFC credits of the firm Mi can be described as (δ − φ+ xfi + βjxfj)qfi. The cost of purchasing the NEV credits to offset the negative CAFC credits is p0(φ − δ − xfi − βjxfj)qfi, denoted as p0(μ − xfi − βjxfj)qfi. For the sake of computational simplicity, this paper solely concentrates on the symmetric solution, i.e., η(β) = ηi(βi) = ηj(βj).
In summary, the profit function of the firm Mi can be described as: (3)
(3)
The first term in equation (3) represents revenue generated from the production of NEVs. The second term denotes revenue from the production of FVs. The third term accounts for revenue from the sale of NEV credits. The fourth term reflects the cost incurred in purchasing NEV credits to offset negative average fuel consumption credits. The fifth term encompasses R&D costs for NEVs, net of government subsidies. Finally, the sixth term represents R&D costs for FVs.
Consumer surplus can be expressed as  , then the social welfare function can be defined as: consumer surplus + producer surplus − government subsidy, that is:
 (4)
(4)
The above model parameters and the meaning of the symbols are shown in Table 1.
Model parameters and symbol definitions.
4 Model solution
In market economies, where cooperation among firms in the production phase is prohibited, our focus is exclusively on cooperation in the R&D stage. Firms are categorized into four strategic types based on the collaboration of dual-vehicle automakers in R&D for both FVs and NEVs. The first strategy, full competition (Strategy D), involves firms competing in R&D for both FVs and NEVs, exemplified by Great Wall Motors and FAW Group. The second strategy, partial cooperation focused on FVs R&D (Strategy J), entails collaboration in R&D for FVs while competing in NEVs R&D, as seen in the partnership between Geely and Renault. The third strategy, partial cooperation for NEVs R&D (Strategy R), involves competing in FVs R&D while collaborating in NEVs R&D, as demonstrated by Changan Automobile and GAC Group. Lastly, the full cooperation (Strategy C) strategy features firms collaborating on R&D efforts for both FVs and NEVs, illustrated by the collaboration between Geely and Changan. Given that both government and firms are aware of the game’s stage interactions, this dynamic process constitutes a three-stage game with complete information, amenable to resolution through backward induction.
Regardless of the strategy adopted by the enterprises, their problem-solving processes during the production phase are the same. That is to say, in the third stage, based on the government subsidy rate and the firms’ R&D investments, both parties determine output levels to maximize their individual profits. Specifically, each firm Mi determines the outputs of both NEV ei and FV fi. By substituting equations (1) and (2) into equation (3), the firms calculate the optimal outputs as follows: (5)
(5)
The Hessian matrix of equation (5) with respect to qei and qfi is denoted as ![Mathematical equation: $ {H}_1=\left[\begin{array}{cc}\frac{{\partial }^2{\pi }_{{Mi}}}{\partial {q}_{{ei}}^2}& \frac{{\partial }^2{\pi }_{{Mi}}}{\partial {q}_{{ei}}\partial {q}_{{fi}}}\\ \frac{{\partial }^2{\pi }_{{Mi}}}{\partial {q}_{{fi}}\partial {q}_{{ei}}}& \frac{{\partial }^2{\pi }_{{Mi}}}{\partial {q}_{{fi}}^2}\end{array}\right]=\left[\begin{array}{cc}-2& 0\\ 0& -2\end{array}\right]$](/articles/stet/full_html/2025/01/stet20240285/stet20240285-eq10.gif) . Obviously, H1 is a negative definite matrix and there exists a unique optimal output. By setting the first-order partial derivatives of equation (5) with respect to qei and qfi equal to 0, we obtain the output of firm Mi as follows:
. Obviously, H1 is a negative definite matrix and there exists a unique optimal output. By setting the first-order partial derivatives of equation (5) with respect to qei and qfi equal to 0, we obtain the output of firm Mi as follows: (6)
(6)
 (7)
(7)
Proposition 1:  ). If
). If  ); otherwise,
  .
.
Proposition 1 posits that increased R&D investments in NEVs (FVs) enhances their respective output. However, due to the existence of competition, whether it is NEVs or FVs, low levels of technology spillovers lead firm’s output to decline as competitor’s R&D investments increase; conversely, output increases with higher levels of competitor’s R&D investments.
This is because, the R&D investments of firm Mj influences Mi’s equilibrium output through the technology spillover effect in a dual manner. On one hand, firm Mj’s R&D investments makes it profitable to expand the production scale of NEVs (FVs) by improving its range (fuel efficiency), which has a negative impact on the output of firm Mi; on the other hand, the R&D investments of firm Mj can improve the range (fuel efficiency) of firm Mi through technological spillovers, which has a positive impact on the output of firm Mi. When technology spillovers are limited, the negative impact predominates, resulting in a dampening effect. Conversely, greater technology spillovers amplify the positive impact, leading to a promotional effect.
4.1 Full competition (strategy D)
Under strategy D, the government determines the subsidy rate to maximize social welfare initially. In the subsequent stages, both firms engage in competition: first, deciding on their respective levels of R&D investments to maximize individual profits, and then competing in the product market for Cournot equilibrium output.
In the second stage, both firms following strategy D determine the optimal level of R&D investments to maximize their individual profits. By substituting equations (6) and (7) into equation (5), the profit function can be reformulated as follows: (8)
(8)
The Hessian matrix of equation (8) with respect to xei and xfi is as follows: ![Mathematical equation: $ {H}_2=\left[\begin{array}{cc}\frac{{\partial }^2{\pi }_{{Mi}}^D}{\partial {x}_{{ei}}^2}& \frac{{\partial }^2{\pi }_{{Mi}}^D}{\partial {x}_{{ei}}\partial {x}_{{fi}}}\\ \frac{{\partial }^2{\pi }_{{Mi}}^D}{\partial {x}_{{fi}}\partial {x}_{{ei}}}& \frac{{\partial }^2{\pi }_{{Mi}}^D}{\partial {x}_{{fi}}^2}\end{array}\right]=\left[\begin{array}{cc}2(2-\eta {)}^2(h+n{p}_0{)}^2/9-\gamma (1-s)& 0\\ 0& 2(2-\beta {)}^2(g+{p}_0{)}^2/9-\gamma \end{array}\right].$](/articles/stet/full_html/2025/01/stet20240285/stet20240285-eq17.gif)
When conditions 9γ − 2(2 − β)2(g + p0)2 > 0, 9γ(1 − s) − 2(2 − η)2(h+ np0)2 > 0 are met, H2 forms a negative definite matrix, indicating the existence of an optimal solution. Setting the first-order partial derivatives of equation (8) with respect to xei and xfi to 0, then the optimal R&D investments can be obtained as: (9)
(9)
 (10)
(10)
In the first stage, the government sets the optimal subsidy rate to maximize social welfare. This problem can be described as: (11)
(11)
Let ∂WSD/∂s = 0, the optimal government subsidy rate can be found to be: (12)
(12)
It is evident that the government subsidy rate increases in tandem with the level of technology spillovers of NEVs.
4.2 FVs R&D cooperation (strategy J)
Under strategy J, during the second stage, both firms collectively decide on R&D investments for FVs to maximize combined profits, while independently optimizing R&D investments for NEVs to maximize their respective profits.
In the second stage, the firm Mi determine xei to maximize respective profits, while both parties determine xfi to maximize their joint profits. Let  , the optimal R&D investments for both firms are determined as follows:
 (13)
(13)
 (14)
(14)
The Hessian matrix of equation (13) with respect to xfi is ![Mathematical equation: $ {H}_3=\left[\begin{array}{cc}\frac{{\partial }^2{\pi }_M^J}{\partial {x}_{f1}^2}& \frac{{\partial }^2{\pi }_M^J}{\partial {x}_{f1}\partial {x}_{f2}}\\ \frac{{\partial }^2{\pi }_M^J}{\partial {x}_{f2}\partial {x}_{f1}}& \frac{{\partial }^2{\pi }_M^J}{\partial {x}_{f2}^2}\end{array}\right]=\left[\begin{array}{cc}\frac{2(5-8\beta +5{\beta }^2)(g+{p}_0{)}^2}{9}-\gamma & \frac{4(2-\beta )(2\beta -1)(g+{p}_0{)}^2}{9}\\ \frac{4(2-\beta )(2\beta -1)(g+{p}_0{)}^2}{9}& \frac{2(5-8\beta +5{\beta }^2)(g+{p}_0{)}^2}{9}-\gamma \end{array}\right]$](/articles/stet/full_html/2025/01/stet20240285/stet20240285-eq25.gif) . Simultaneously, the first and second order partial derivatives of equation (14) with respect to xei are:
. Simultaneously, the first and second order partial derivatives of equation (14) with respect to xei are:  .
.
Given the conditions 9γ − 2(5 − 8β + 5β2)(g + p0)2 > 0, 9γ(1 − s) − 2(2 − η)2(h + np0)2 > 0, (9γ − 2(1 + β)2(g + p0)2) (γ − 2(1 − β)2(g + p0)2) > 0, H3 is a negative definite matrix, along with  , there exists an optimal solution. Setting the first-order partial derivatives of equation (13) with respect to xfi and equation (14) with respect to xei equal to 0, then the optimal R&D investments can be obtained as:
 (15)
(15)
 (16)
(16)
In the initial stage, let ∂WSJ/∂s = 0, the optimal subsidy rate under strategy J can be determined as: (17)
(17)
4.3 NEVs R&D cooperation (strategy R)
Under strategy R, during the second stage, both firms collectively decide on R&D investments for NEVs to maximize combined profits, while independently optimizing R&D investments for FVs to maximize their respective profits.
In the second stage, we know that both firms determine the optimal R&D investments as follows: (18)
(18)
 (19)
(19)
The Hessian matrix of equation (18) with respect to xei is![Mathematical equation: $ {H}_4=\left[\begin{array}{cc}\frac{{\partial }^2{\pi }_M^R}{\partial {x}_{e1}^2}& \frac{{\partial }^2{\pi }_M^R}{\partial {x}_{e1}\partial {x}_{e2}}\\ \frac{{\partial }^2{\pi }_M^R}{\partial {x}_{e2}\partial {x}_{e1}}& \frac{{\partial }^2{\pi }_M^R}{\partial {x}_{e2}^2}\end{array}\right]=\left[\begin{array}{cc}\frac{2(5-8\eta +5{\eta }^2)(h+n{p}_0{)}^2}{9}-(1-s)\gamma & \frac{4(2-\eta )(2\eta -1)(h+n{p}_0{)}^2}{9}\\ \frac{4(2-\eta )(2\eta -1)(h+n{p}_0{)}^2}{9}& \frac{2(5-8\eta +5{\eta }^2)(h+n{p}_0{)}^2}{9}-(1-s)\gamma \end{array}\right]$](/articles/stet/full_html/2025/01/stet20240285/stet20240285-eq33.gif) and the first and second order partial derivatives of equation (19) with respect to xfi are:
and the first and second order partial derivatives of equation (19) with respect to xfi are:  .
.
Given the conditions (9γ(1 − s) − 2(η + 1)2(h + np0)2)(γ(1 − s) − 2(1 − η)2(h + np0)2) > 0, 9γ(1 − s) − 2(5 − 8η + 5η2)(h + np0)2 > 0, 9γ − 2(2 − β)2(g + p0)2 > 0, H4 is a negative definite matrix, along with  , there exists an optimal solution. Setting the first-order partial derivatives of equation (18) with respect to xei and equation (19) with respect to xfi equal to 0, then the optimal R&D investments can be obtained as:
 (20)
(20)
 (21)
(21)
In the first stage, let ∂WSR/∂s = 0, the optimal subsidy rate under strategy R can be defined as: (22)
(22)
4.4 Full coopetition (strategy C)
Under strategy C, in the second stage, both firms simultaneously decide on R&D investments for FVs and NEVs to maximize their joint profits.
In the second stage, firms Mi determine xei and xfi to maximize their joint profits, then the two firms determine the optimal R&D investments as: (23)
(23)
Similarly, given the conditions (9γ(1 − s) − 2(1 + η)2(h + np0)2)(γ(1 − s) − 2(1 − η)2(h + np0)2) > 0, 9γ(1 − s) − 2(5 − 8η + 5η2)(h + np0)2 > 0, (9γ − 2(1 + β)2(g + p0)2)(γ − 2(1 − β)2(g + p0)2) > 0, 9γ − 2(5 − 8β+5β2)(g + p0)2 > 0, The Hessian matrix of equation (23) is a negative definite matrix. There exists an optimal solution. Setting the first-order partial derivatives of equation (23) with respect to xei and xfi equal to 0, then the optimal R&D investments can be solved as: (24)
(24)
 (25)
(25)
In the first stage, according to ∂WSC/∂s = 0, the optimal subsidy rate under strategy C can be found to be: (26)
(26)
Under the four strategies, in the second stage of the game, setting s = 0 yields the equilibrium results of different strategies without government subsidies, as shown in Table 2. The equilibrium results for four strategies under the optimal subsidy are shown in Table 3.
The equilibrium results for four strategies without government subsidies.
The equilibrium results for four strategies under the optimal subsidy.
5 Result comparison
5.1 Horizontal comparison
Horizontal comparison refers to the comparative analysis of different strategies within a scenario, including two cases: the scenario without government subsidies and the scenario with government subsidies.
5.1.1 The scenario without government subsidies
(1) Strategy ND(NR) and Strategy NJ(NC)
Proposition 2: The comparison between strategy ND(NR) and strategy NJ(NC) can reveal differences in cooperative R&D for FVs within the context of R&D competition (cooperation) for NEVs without government subsidies:
① For β ∈ [0, 1],  .
.
② If 0 ≤ β < 1/2,  , WSNJ < WSND (WSNC < WSNR); otherwise,
  ,
,  , WSNJ ≥ WSND (WSNC ≥ WSNR).
Proposition 2 posits that within the framework of R&D competition (cooperation) in the NEVs sector, government subsidies, R&D investments and outputs in NEVs remain unaffected regardless of whether firms engage in R&D cooperation for FVs. From the perspective of increasing R&D investments and expanding production scale in FVs, when the spillovers level of FVs is low, firms should opt for strategy ND(NR); conversely, when the spillovers level is high, firms should choose strategy NJ(NC). Similarly, this conclusion applies to social welfare considerations. However, from the perspective of maximizing firm profits, strategy NJ(NC) consistently outperforms strategy ND(NR). This suggests that R&D cooperation for FVs yields superior outcomes compared to R&D competition, corroborating findings from numerous studies.
(2) Strategy ND(NR) and Strategy NJ(NC)
Proposition 3: The comparison between strategy ND(NJ) and strategy NR(NC) can indicate differences in cooperative R&D for NEVs within the context of R&D competition (cooperation) for FVs without government subsidies:
① For η ∈ [0, 1], there are  ,
, 
 .
.
② If 0 ≤ η < 1/2,  ,
,  , WSNR < WSND (WSNC < WSNJ); otherwise,
  ,
,  , WSNR ≥ WSND (WSNC ≥ WSNJ).
Proposition 3 indicate that the collaborative efforts in the R&D of NEVs do not significantly impact the R&D investments and outputs of FVs. However, they have a considerable effect on the R&D investments and outputs of NEV, subsequently influencing both corporate profits and societal welfare. Specifically, regarding the R&D investments and outputs of NEV and societal welfare, when the spillovers level of NEVs is low, strategy ND(NJ) is superior to strategy NR(NC). Conversely, when the spillovers level is high, strategy NR(NC) becomes more advantageous than strategy ND(NJ). This insight suggests the complex interplay between collaboration, competition, and innovation in the automotive industry [61]. In terms of corporate profits, for any spillovers level of NEVs, strategy NR(NC) consistently outperforms strategy ND(NJ). This indicates that regardless of whether there is collaborative R&D for fuel vehicles, collaborative R&D in comparison to the competition in NEVs will always enhance corporate profit.
(3) Strategy ND(NJ) and Strategy NC(NR)
Proposition 4: The comparison between Strategy ND and Strategy NC highlights the differences between R&D competition and cooperation for both FVs and NEVs, while the contrast between Strategy NJ and Strategy NR emphasizes the distinctions in R&D collaboration between FVs and NEVs without government subsidies:
① If 0 ≤ η < 1/2,  ,
,  ; otherwise,
  ),
),  ).
).
② If 0 ≤ β < 1/2,  ),
),  ; otherwise,
  ,
,  .
.
③ For η ∈ [0, 1] and β ∈ [0, 1],  . If
. If  ; if
; if
④ If 0 ≤ β < 1/2 and 0 ≤ η < 1/2, WSNC < WSND; if 1/2 ≤ β ≤ 1 and 1/2 ≤ η ≤ 1, WSNC ≥ WSND; if 0 ≤ β < 1/2 and 1/2 < η ≤ 1, WSNJ < WSNR; if 1/2 ≤ β ≤ 1 and 0 ≤ η ≤ 1/2, WSNJ ≥ WSN.
Where  ,
,  .
.
Proposition 4 indicates that, in the context of R&D investments and production scale expansion for both FVs and NEVs, the level of technological spillovers significantly influences strategic choices. Specifically, when the spillovers level is low, Strategy ND is more advantageous than Strategy NC; conversely, when the spillovers level is high, Strategy NC outperforms Strategy ND.
In terms of corporate profit, strategy NC consistently outperforms strategy ND, regardless of variations in the level of technology spillover. This finding suggests that cooperation can lead to profit growth for enterprises in the absence of government subsidies. However, the superiority of strategy NR over strategy NJ, or vice versa, depends on the market power of the two types of vehicles. When the market power of FVs is strong, strategy NJ is favored; conversely, when the market power is weaker, strategy NR prevails. This phenomenon reflects the profound impact of market structure and competition intensity on corporate strategies.
From a social welfare perspective, when the spillovers level for both FVs and NEVs are low, Strategy ND is superior to Strategy NC. Conversely, when both spillovers level are high, Strategy NC becomes more favorable. Furthermore, in scenarios where the technology spillover from FVs is low while that from NEVs is high, Strategy NR is preferable to Strategy NJ. Conversely, if FVs have high spillover while NEVs have low spillover, Strategy NJ outperforms Strategy NR. These findings underscore the nuanced interplay between technology spillover levels and strategic choices, highlighting their critical implications for optimizing social welfare in the automotive sector.
(4) Comprehensive comparison
The previous section compared the differences between the two strategies, this section undertakes a comprehensive comparative analysis of all four strategies to present the optimal competitive strategy for the firms. This synthesis leads to Proposition 5.
Proposition 5: The comprehensive comparison of the four strategies without government subsidies yields the following results:
① If 0 ≤ η < 1/2,  ; otherwise,
  .
.
② If 0 ≤ β < 1/2,  ; otherwise
 .
.
③ For 0 ≤ β ≤ 1 and 0 ≤ η ≤ 1,  .
.
④ If 0 ≤ β < 1/2 and 0 ≤ η < 1/2, WSND > max{WSNJ, WSNR} > min{WSNJ, WSNR} > WSNC; if 0 ≤ β < 1 and 1/2 < η ≤ 1, WSNR > max{WSND, WSNC} > min{WSND, WSNC} > WSNJ; if 1/2 ≤ β ≤ 1 and 0 ≤ η ≤ 1/2, WSNJ ≥ max{WSND, WSNC} ≥ min{WSND, WSNC} ≥ WSNR; if 1/2 ≤ β ≤ 1 and 1/2 ≤ η ≤ 1, WSNC ≥ max{WSNJ, WSNR} ≥ min{WSNJ, WSNR} ≥ WSND.
Proposition 5 indicates that in the absence of government subsidies, there is no significant difference between strategies ND and NJ regarding the increase in R&D investments and outputs of NEVs, nor is there a significant difference between strategies NC and NR. When the spillovers level of NEVs is low, strategies ND(NJ) are superior to strategies NC(NR). Conversely, when the spillovers level is high, strategies NC(NR) outperform strategies ND(NJ). Regarding the increase in R&D investments and outputs of FVs, there is no significant difference between strategies ND and NR, and between strategies NC and NJ. When the spillovers level of FVs is low, the former outperforms the latter. However, when the spillovers level is high, the latter outperforms the former.
In terms of corporate profit, regardless of the spillovers level, strategy NC is superior to both strategies NR and NJ, while strategies NR and NJ are superior to strategy ND, as shown in Figure 2. This indicates that strategy NC has a sustained competitive advantage in achieving corporate profits. From the perspective of social welfare, as shown in Figure 3, when both the spillovers levels of FVs and NEVs are low, strategy ND is the optimal strategy. When the spillovers level of FVs is low and that of NEVs is high, strategy NR is the optimal strategy. When the spillovers level of FVs is high and that of NEVs is low, strategy NJ is the optimal choice. Finally, when the spillovers levels for both are high, strategy NC is deemed the optimal strategy. These findings underscore the critical influence of spillover levels on strategic decision-making within the automotive sector, highlighting the importance of tailoring strategies to specific technological contexts to enhance overall social welfare.
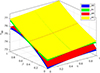 |
Fig. 2 The comparison of corporate profit under four strategies without subsidies. |
 |
Fig. 3 The comparison of social welfare under four strategies without subsidies. |
5.1.2 The scenario with government subsidies
(1) Strategy YD(YR) and Strategy YJ(YC)
Proposition 6: The comparison between strategy YD(YR) and strategy YJ(YC) can reveal differences in cooperative R&D for FVs in the context of R&D competition (cooperation) for NEVs under optimal subsidies:
① For β ∈ [0, 1], sYJ = sYD (sYC = sYR),  ).
).
② If 0 ≤ β < 1/2,  ,
,  , WSYJ < WSYD (WSYC < WSYR); otherwise,
  ,
,  , WSYJ ≥ WSYD (WSYC ≥ WSYR).
Proposition 6 posits that within the framework of R&D competition (cooperation) in the NEVs sector, government subsidies, R&D investments and outputs in NEVs remain unaffected regardless of whether firms engage in R&D cooperation for FVs. From the perspective of increasing R&D investments and expanding production scale in FVs, when the spillovers level of FVs is low, firms should opt for strategy YD(YR); conversely, when the spillovers level is high, firms should choose strategy YJ(YC). Similarly, this conclusion applies to social welfare considerations. However, from the perspective of maximizing firm profits, strategy YJ(YC) consistently outperforms strategy YD(YR). This finding is consistent with the scenario of no government subsidies, indicating that government subsidies do not have an impact on the decision-making behavior concerning fuel vehicles.
(2) Strategy YD(YJ) and Strategy YR(YC)
Proposition 7: The comparison between strategy YD(YJ) and strategy YR(YC) can indicate differences in cooperative R&D for NEVs in the context of R&D competition (cooperation) for FVs under optimal subsidies:
① For η ∈ [0, 1], there are  ,
,  ),
),  (
( ),
),  (
( ), WSYR = WSYD (WSYC = WSYJ).
② If 0 ≤ η < 1/2, sYR > sYD (sYC > sYJ),  (
( ); otherwise, sYR ≤ sYD (sYC ≤ sYJ),
  .
.
From Proposition 7, it is evident that whether firms are incentivized to participate in R&D cooperation for NEVs within a R&D competitive (or cooperative) environment for FVs depends on the level of technology spillovers of NEVs. However, irrespective of whether the two firms engage in R&D cooperation for NEVs, their optimal R&D investments and outputs for both FVs and NEVs, as well as societal welfare, remain unchanged. The rationale lies in the distinct markets for both vehicle types. The decision to engage in R&D cooperation for NEVs does not influence firms’ decisions regarding R&D investments and production of FVs. At the same time, governmental subsidy policies can incentivize firms to maintain optimal R&D investments in NEVs at a consistent level without impacting societal welfare. This discovery challenges the prevailing belief that cooperation consistently results in superior results. The importance of firms carefully evaluating factors such as R&D spillovers and government subsidies when choosing their coopetition strategies is highlighted, rather than automatically opting for cooperative approaches [45]. In intricate innovation ecosystems, competitive strategies can sometimes lead to better overall outcomes, particularly when the spillovers level is high and subsidy policy is present, as emphasized by the proposition.
(3) Strategy YD(YJ) and Strategy YC(YR)
Proposition 8: The comparison of Strategy YD and Strategy YC illustrates distinctions between R&D competition and R&D cooperation for both FVs and NEVs, whereas the contrast between Strategy YJ and Strategy YR highlights the differences in R&D collaboration between FVs and NEVs under optimal subsidies:
① If η ∈ [0, 1] and β ∈ [0, 1], 
② If 0 ≤ η < 1/2, sYC > sYD (sYR > sYJ); otherwise, sYC ≤ sYD (sYR ≤ sYJ).
③ If 0 ≤ β < 1/2,  ,
,  WSYC < WSYD (WSYJ < WSYR); otherwise,
  ),
),  , WSYC ≥ WSYD (WSYJ ≥ WSYR).
④ For β < 1/2, if 0 ≤ η < 1/2,  ), otherwise,
  ). For β ≠ 1/2, if y2 > |y3|,
  ), otherwise when 0 ≤ η < 1/2,
  ), when 1/2 ≤ η ≤ 1,
  ). Where
  .
.
From Proposition 8, the R&D investments and outputs for NEVs remain constant regardless of whether there is R&D cooperation between FVs and NEVs, attributable to the incentive effect of government subsidy behavior. However, the intensity of government subsidies between strategies depends on the spillovers level of NEVs. Specifically, when the spillovers level is low, the government provides a higher subsidy rate to strategy YC(YR); conversely, when the spillovers level is high, strategy YD(YJ) receives greater government support.
From the perspective of increasing R&D investments and outputs for FVs, firms should opt for strategy YD(YR) when the spillovers level of FVs is low. Conversely, when the spillovers level of FVs is high, firms are advised to adopt strategy YC(YJ). Technology spillovers of FVs play an equally significant role in social welfare. However, changes in corporate profits are influenced by several variables, including DCP, dual technology spillovers, consumer preferences, and R&D efficiency. Overall, when the spillovers level of FVs meets a specified threshold, the optimal profits are achieved under strategy YC(YR) under conditions of low spillovers level of NEVs. Conversely, strategy YD(YJ) yields superior profits. It is noteworthy that when the spillovers level of FVs takes a more general case, if the spillovers level of NEVs is low (high), the enterprise chooses strategy YC(YJ) profit is always better than strategy YD(YR).
(4) Comprehensive comparison
The previous section compared the differences between the two strategies, this section undertakes a comprehensive comparative analysis of all four strategies to present the optimal competitive strategy for the firms.
Proposition 9: The comprehensive comparison of the four strategies with government subsidies yields the following results:
① If 0 ≤ η < 1/2, sYR = sYC > sYD = sYJ; otherwise, sYR = sYC ≤ sYD = sYJ.
② If 0 ≤ β ≤ 1, and 0 ≤ η ≤ 1  ,
,  .
.
③ For 0 ≤ β < 1/2,  ,
,  WSYD = WSYR > WSYJ = WSYC; otherwise,
  ,
,  , WSYD = WSYR ≤ WSYJ = WSYC.
④ For β = 1/2, if 0 ≤ η < 1/2,  ; if, 1/2 ≤ η ≤ 1,
  ). For β ≠ 1/2, if 0 ≤ η < 1/2,
  ; if 1/2 ≤ η ≤ 1,
  .
.
Proposition 9 demonstrates that the R&D investments and outputs of NEVs remain unchanged under the optimal subsidy, irrespective of the competitive strategy chosen by firms. Optimal government subsidies depend on the spillovers level of NEVs. When the spillovers level is low, firms opt for R&D cooperation strategies (Strategies YR and YC), thereby qualifying for higher subsidy rates. Conversely, when the spillovers level is high, firms should pursue R&D competition strategies for NEVs (Strategies YD and YJ). Regarding the enhancement of R&D investments and the expansion of production scales for FVs, firms should opt for Strategies YD and YR when the spillovers level is low. Conversely, when the spillovers level is high, they should adopt Strategies YJ and YC. Moreover, the optimal strategy chosen by firms significantly contributes to improving social welfare. From the perspective of maximizing corporate profit, as depicted in Figure 4, in general, firms can achieve this goal by selecting Strategy YC when the spillovers level of NEVs is low. Conversely, Strategy YJ tends to maximize their profits.
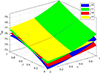 |
Fig. 4 The comparison of corporate profit under four strategies with optimal subsidies |
Numerous studies have demonstrated that cooperative strategies usually sustain high system performance, whereas competitive strategies sometimes result in performance decline due to conflicts between individual and collective rationality. However, in the presence of R&D spillovers and government subsidies, this general conclusion may no longer hold. This indicates that competitive firms should not blindly pursue cooperation, as it may lead to profit losses.
In general, the optimal competitive strategy chosen by firms for profit maximization also leads to optimal government subsidies. However, it is noteworthy that the R&D investments and outputs of NEVs remain unchanged across various competitive strategies, impacting only the R&D investments and outputs of FVs, as well as social welfare. Therefore, to achieve dual enhancement in both the economic and social performance of firms, it is crucial to maintain a higher spillovers level of FVs.
5.2 Vertical comparison
The vertical comparison refers to the differential analysis between the same strategies in scenarios with and without government subsidies.
Proposition 10: The comparison of the four strategies under scenarios without government subsidies and with government subsidies can be obtained as:
① (a)  ,
,  ,
,  ,
,  , WSYD > WSND.
(b) If 0 ≤ η < η1,  ; otherwise,
  .
.
② (a)  ,
, ,
,  ,
,  , WSYJ > WSNJ.
(b) If 0 ≤ η < η1,  ; otherwise,
  .
.
③  ,
,  ,
,  ,
,  ,
,  , WSYR > WSNR.
④  ,
,  ,
, 
 ,
,  , WSYC > WSNC.
Where η1 satisfies  .
.
Proposition 10 posits that, irrespective of the competitive strategies adopted by firms, government subsidies exert no significant influence on the R&D investments and outputs of FVs. In contrast, these subsidies play a substantial role in stimulating R&D investments in NEVs. By incentivizing companies to scale up their production of NEVs, government subsidies contribute to enhanced social welfare outcomes. This is because the subsidies lower the R&D costs of NEVs, encouraging firms to increase their investments in this area. Higher R&D investments enhance the range capacity of NEVs, thereby strengthening consumers’ willingness to purchase. This virtuous mechanism prompts companies to further expand their production scale, achieving a significant Pareto improvement in social performance. Simultaneously, government subsidies markedly bolster corporate profits under strategies YR and YC. In contrast, the influence of government subsidies on corporate profits under strategies YD and YJ is contingent upon the level of technological spillovers of NEVs. Specifically, when the spillovers level is low, government subsidies may lead to a decrease in profits for these two strategies; conversely, it is only when the spillovers level is high that government subsidies can effectively promote profit growth (Fig. 5). This phenomenon can be attributed to the influence of technological spillovers on corporate innovation capabilities and market competitiveness. When the spillovers level is low, firms may struggle to fully leverage government subsidies to drive technological advancement or enhance efficiency, resulting in reduced profits. In such cases, subsidies might be allocated to short-term operational or maintenance costs, failing to translate into a sustainable competitive advantage. However, when the spillovers level is high, firms can absorb and apply external technological advancements, thereby strengthening their R&D capabilities. This leads to improvements in production efficiency and product innovation, enabling government subsidies to be more effectively converted into profit growth, thus fostering the long-term development of firms in the market.
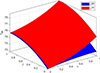 |
Fig. 5 The comparison of corporate profit under strategy YD with and without subsidies. |
6 Analysis of impact factors
Based on the comparative analysis presented earlier, it is evident that firms’ optimal choices tend to concentrate on strategy J and strategy C. Therefore, this section centers on examining the effects of parameters related to FVs, NEVs, and shared parameters on R&D investments, outputs, profits, and social welfare under these optimal strategies.
6.1 Impact of FVs related parameters
Corollary 1: Under the optimal strategy, firms’ FVs R&D investments, outputs, profits and social welfare vary with the spillovers level of FVs (β), consumers’ low-carbon preference (g), the requirement for the proportion of NEVs credits (λ), and the difference between actual and standard values of the average 100-km fuel consumption (μ) as:
① (a) ,
,  ,
,  ,
,  ,
,  ,
,  ,
,  ,
,  ,
,  ,
,  .
.
(b) If 0 ≤ β < 1/2,  ,
,  ; otherwise,
  ,
,  .
.
(c) If 0 ≤ β ≤ 1/2,  ,
,  ; otherwise, when γ0 < γ < γ1,
  ,
,  , when γ ≥ γ1,
  ,
,  .
.
(d) If 0 ≤ β ≤ 1/2,  ,
,  ; if 1/2 < β < 4/5, when γ0 < γ < γ2,
  ,
,  , otherwise,
  ,
,  ; if 4/5 ≤ β ≤ 1,
  ,
,  .
.
② (a) ,
,  ,
,  ,
,  ,
,  ,
,  ,
,  ,
,  ,
,  ,
,  ,
,  ,
,  ,
,  ,
,  .
.
(b) If 0 ≤ β ≤ 1/2, when γ0 < γ < γ3,  ,
,  , otherwise,
  ,
,  ; if 1/2 ≤ β ≤ 1,
  ,
,  .
.
③  ,
,  ,
,  ,
,  ,
,  ,
,  ,
,  ,
,  ,
,  ,
,  ,
,  ,
,  ,
, ,
,  ,
,  ,
,  .
.
④  ,
,  ,
,  ,
,  ,
,  ,
,  ,
,  ,
,  ,
,  ,
,  ,
,  ,
,  ,
,  ,
,  ,
,  ,
,  .
.
Where  ,
,  ,
,  ,
,  .
.
Corollary 1 indicates that the level of technology spillover of FVs has a significantly divergent impact on equilibrium outcomes depending on the strategic approach adopted. Under collaborative R&D strategies for FVs (Strategies YJ and YC), firms experience an increase in R&D investments, outputs, profits, and social welfare as the spillovers level of FVs rises. Conversely, the impact of technology spillovers on variables associated with competitive R&D strategies for FVs (Strategies YD and YR) presents a more nuanced and varied trend. First, under Strategies YD and YR, R&D investments in FVs decline as the level of technology spillover increases. This counterintuitive observation may stem from the fact that higher spillovers level reduce the incentive for competing firms to invest in R&D. Second, when the spillovers level is low, outputs of FVs under strategies YD and YR increases with rising spillover levels. However, when the spillovers level is high, the outputs under these strategies decrease as the spillover increases. This dual effect of technology spillover on production output is detailed in Proposition 1. Third, when the spillovers level is low, profits for firms under Strategies YD and YR increase with higher spillover levels. In contrast, when the spillovers level is high, lower R&D efficiency results in profits under Strategies YD and YR continuing to rise with increasing spillover levels, while higher R&D efficiency may lead to a decline in profits as spillover levels rise. This phenomenon reflects the complex interplay between R&D efficiency, market competition, enterprise costs, and market demand. Finally, concerning social welfare, when the spillovers level is low, social welfare under Strategies YD and YR improves as spillover levels increase. At moderate levels of spillover, lower R&D efficiency enhances social welfare as spillover increases, whereas higher R&D efficiency may lead to a reduction in social welfare despite increasing spillover levels. When the spillovers level is high, social welfare under these strategies also decreases with rising spillover levels. This phenomenon may be attributed to excessively high technology spillover levels inhibiting competing firms’ R&D investments and production enthusiasm, ultimately leading to a detriment in social welfare. In summary, the aforementioned conclusion underscores the complexity and strategic dependence of the effects of technology spillover on various performance metrics of firms. It highlights the diverse implications of spillover effects on economic outcomes across different strategic choices.
Similarly, consumer preference for low-carbon products significantly promotes the growth of enterprises in terms of research and development (R&D) investment, production volume, profits, and social welfare under strategies YJ and YC. In the context of strategies YD and YR, although there is an increase in R&D investment, production volume, and social welfare related to fuel vehicles as consumer low-carbon preferences rise, the changes in enterprise profits present a more complex scenario. Specifically, when the level of technology spillover for fuel vehicles is low, the R&D efficiency of enterprises is also low, which results in an increase in profits under strategies YD and YR in response to heightened consumer low-carbon preferences. Conversely, when R&D efficiency is high, profits under strategies YD and YR may decline as consumer low-carbon preferences increase. This phenomenon may arise from the tendency of firms with high R&D efficiency to overly focus on technological innovation and product optimization in their pursuit of profits, which can slow down their market response and cause them to miss opportunities to capitalize on the market potential associated with consumer low-carbon preferences. In other words, achieving a balance between technological innovation and market demand is crucial for enterprises; excessive technological investment may hinder their ability to meet consumer needs in a timely manner. When the level of technology spillover for fuel vehicles is high, profits under strategies YD and YR similarly increase alongside rising consumer low-carbon preferences. This outcome indicates that a high level of technology spillover enhances firms’ responsiveness to market demands, enabling them to adapt to consumer preferences for low-carbon products while simultaneously achieving higher profit levels. This may be due to the rapid dissemination of technology, allowing firms to adjust product characteristics quickly to better satisfy consumer low-carbon requirements, thereby enhancing their market competitiveness and profitability.
Conversely, regardless of the competitive and cooperative strategies adopted by enterprises, R&D investment, production volume, profits, and social welfare associated with fuel vehicles decrease as the requirements for the proportion of NEV credits and the disparity between the actual and benchmark fuel consumption per 100 kilometers increase. This phenomenon occurs because higher requirements for NEV credit proportions, along with a greater discrepancy between actual and benchmark fuel consumption, impose greater pressure on enterprises to meet credit demands. To alleviate this pressure, firms may reduce the production of fuel vehicles, which in turn leads to a decline in profits and a reduction in social welfare. This indicates that under the dual credit policy, increasing the requirements for NEV credit proportions and reducing the fuel consumption of fuel vehicles per 100 kilometers will not effectively incentivize enterprises to enhance their R&D investments in fuel vehicles; rather, it may solely result in a decrease in the production quantity of fuel vehicles. Therefore, policymakers must carefully consider the impact of incentive measures on corporate production decisions and the relationship between market supply and demand when designing such policies.
6.2 Impact of NEVs related parameters
Corollary 2: According to the optimal strategy, firms’ NEVs R&D investments, outputs, profits, and social welfare vary with the levels of NEVs technology spillovers (η), consumer range preference (h), and NEVs credits accounting coefficients (n) as follows:
① (a) ,
,  ,
,  ,
,  ,
, 
 ,
,  ,
,  ,
,  ,
,  ,
,  ,
,  ,
,  ,
,  .
.
(b) If 0 ≤ η < 1/2, when γ0 < γ < γ5,  ,
,  , otherwise,
  ,
,  ; if 1/2 ≤ η ≤ 1,
  ,
,  .
.
② (a) ,
,  ,
,  ,
,  ,
,  ,
,  ,
,  ,
,  ,
,  ,
,  ,
,  ,
,  ,
,  ,
,  .
.
(b) If 0 ≤ η < 1/2, when γ0 < γ < γ6, ,
,  , otherwise,
 ,
,  ; if 1/2 ≤ η ≤ 1,
  ,
,  .
.
③ (a) ,
,  ,
,  ,
,  ,
,  ,
,  ,
,  ,
,  ,
,  ,
,  ,
,  ,
,  ,
,  ,
,  .
.
(b) If 0 ≤ η < 1/2, when γ0 < γ < γ6,  ,
,  , otherwise,
  ,
,  ; if 1/2 ≤ η ≤ 1,
  ,
,  .
.
Where  ,
,  .
.
Corollary 2 illustrates that under the optimal strategy, regardless of the competitive or cooperative strategies adopted by firms, NEVs’ R&D investments, outputs, and social welfare significantly increase with higher levels of technology spillovers, consumer range preferences, and the credits accounting coefficient. In the context of cooperative R&D strategies of NEVs (i.e., strategies YR and YC), corporate profits also rise in tandem with increases in the aforementioned three factors. This phenomenon can be attributed to the fact that R&D collaboration facilitates the internalization of the externalities associated with technology spillovers, thereby enhancing firms’ enthusiasm for R&D activities. Elevated levels of technology spillover, consumer preferences for extended range, and higher accounting coefficients incentivize firms to increase their R&D investments, expand production scales, and subsequently achieve profit growth.
However, under strategies YD and YJ, the relationship between corporate profits and the levels of technology spillover, consumer range preferences, and accounting coefficients demonstrates a degree of complexity. Specifically, when the level of technology spillover in the EV sector is low, higher R&D efficiency may lead to a decrease in corporate profits as the levels of technology spillover, consumer range preferences, and accounting coefficients increase. This counterintuitive outcome can be explained by the fact that, although higher R&D efficiency tends to reduce research costs, firms in low spillover environments often adopt more conservative R&D strategies, focusing resources on enhancing their proprietary technologies. While this approach may improve a firm’s technological capabilities in the short term, it can also intensify market competition, thereby compressing profit margins.
Conversely, firms with lower R&D efficiency may adopt more flexible strategies in a competitive market, allowing them to achieve a certain market share and profit growth with lower R&D investments. This flexibility enables firms to better adapt to changes in market demand, particularly in highly competitive environments. When the level of technology spillover is high, profits for firms using strategies YD and YJ tend to increase significantly with rising levels of technology spillover, consumer range preferences, and accounting coefficients. This observation indicates that, in environments characterized by high technology spillovers, firms are better positioned to leverage external knowledge and resources, thereby enhancing their competitive advantages and profitability.
6.3 Impact of common parameters of FVs and NEVs
Corollary 3: The equilibrium outcomes for both FVs and NEVs are influenced by the proportion of potential demand for NEVs (θ), and the price of credits (p0) as follows:
① (a) ,
, ,
, ,
, ,
, ,
, ,
, ,
, ,
, ,
, ,
, ,
, ,
, ,
, ,
, ,
, .
.
(b) If ξ1 < ξ3 (ξ1 < ξ4),  ; otherwise,
  . If ξ2 < ξ3 (ξ2 < ξ4),
  ; otherwise,
  . If ξ2 < ξ3 (ξ3 < ξ5),
  ,
,  ; otherwise,
  ,
,  .
.
② (a) ,
, ,
, ,
, ,
, ,
, ,
, ,
, .
.
(b) If 0 < θ < θ1 (0 < θ < θ2),  ,
, ; otherwise,
  ,
, (
( ,
, ). If 0 < θ < θ3 (0 < θ < θ4),
  ,
, (
( ,
, ); otherwise,
  ,
, (
( ,
, ).
).
(c) For 0 ≤ η < 1/2, if 0 < θ < θ5,  ; otherwise, if
  ,
,  , if
, if  ,
,  . For 1/2 ≤η ≤ 1, if 0 < θ < θ5,
  ; otherwise, if
  ,
,  , if
, if  ,
,  .
.
(d) For 0 < θ < θ6,  ,
,  ; otherwise, if
  ,
,  ,
,  , if
, if  ,
,  ,
,  .
.
Where  ,
,  ,
, ,
,  ,
, ,
, ,
, ,
, ,
, ,
, ,
, ,
, ,
, ,
,  ,
, , ϕ9 = a(1 − θ) + g(λ + μ).
Corollary 3 displays that whether the enterprise opts for competitive or cooperative strategies, as the proportion of potential demand for NEVs grows, the demand scale for NEVs expands while that for FVs contracts. During this shift, R&D investments and outputs of NEVs increase while those for FVs decrease. This underscores the pivotal role of market size in shaping firms’ decisions on R&D investments and outputs. It is noteworthy that the proportion of potential demand for NEVs exerts opposing effects on the profits of FVs (negative) and NEVs (positive). Therefore, overall profit increases only when the positive effect outweighs the negative effect; conversely, profits decrease. Similarly, the social welfare has a similar nature.
Under the optimal subsidy policy, as the price of credits increases, R&D investments and outputs of NEVs are expected to rise. However, there is uncertainty regarding the changes in R&D investments and outputs of FVs. Specifically, when the proportion of potential demand for NEVs is small – indicating a large market demand for FVs – the increase in credit price motivates firms to boost R&D investments in FVs and expand production. Conversely, when market demand for FVs is insufficient, firms may lack the incentive to invest in R&D. In such cases, a higher credit price could compel firms to scale back production capacity instead.
The impact of credit prices on firms’ profits is notably intricate due to the dual components that constitute total profits: profits from FVs and NEVs. While NEVs profits tend to increase with credit prices under the optimal strategy (strategy YJ or strategy YC), the relationship between FVs profits and credit prices is more nuanced, exhibiting both positive and negative aspects. Overall, when the potential demand for NEVs is limited, firms’ profits under the optimal strategy generally rise with higher credit prices. Conversely, the effect of credit prices on corporate profits hinges on balancing the positive impact on NEVs profits against the negative impact on FVs profits. Firms’ profits increase with higher credit prices only when the former outweighs the latter; otherwise, profits decrease. Similar observations extend to social welfare, reflecting analogous dynamics. Consequently, government attention must focus on the scale of demand for both FVs and NEVs. Firms’ profits and social welfare will only increase alongside rising credit prices if FVs maintain a significant market size or if the influence of credit prices on NEVs surpasses their effect on FVs. Otherwise, higher credit prices do not necessarily enhance economic or social performance.
7 Discussion
This study investigates manufacturers’ coopetition strategies within the framework of the DCP, taking into account consumer preferences and government subsidies. The results align with previous research, including Li and Xiong [31] and Li et al. [32], regarding the DCP’s impact on FVs and NEVs, thereby affirming the policy’s effectiveness in promoting the growth of NEVs. However, this investigation offers a deeper understanding by revealing that the DCP’s effects on FVs are more intricate than previously recognized. Contrary to expectations, stricter credit requirements and greater discrepancies between actual and standard fuel consumption values do not necessarily incentivize investments in fuel-saving R&D. Instead, these factors may lead to a decline in the production and sales of FVs. This highlights the need for policy refinement to better harmonize the transition toward NEVs with the continuous improvement of FV efficiency [62, 63].
The optimal government subsidy rate under the DCP, as explored in the second research question, reveals a more complex relationship with firm strategies than previously anticipated. The findings build upon the work of Bronzini and Piselli [46] and Chen et al. [48] by demonstrating that subsidies effectively enhance R&D in NEV range technology without inducing a crowding-out effect. This result is particularly significant, as it challenges earlier concerns expressed in the literature regarding the potentially detrimental impacts of government subsidies on private R&D investments. An examination of firms’ optimal cooperation strategies and incentives under the DCP uncovers unexpected patterns. While prior studies, such as those by Kamien et al. [18] and D’Aspremont and Jacquemin [40], generally advocated for cooperative R&D strategies, our findings indicate that the optimal approach is dependent on the degree of technology spillovers. This insight contributes to the existing literature on R&D cooperation and competition, underscoring the importance of considering industry-specific factors when determining an appropriate strategy.
The effects of technology spillovers, consumer preferences, and the parameters of the DCP on firms’ equilibrium outcomes and strategic decisions are more intricate than previously expected. This research builds upon the works of Du et al. [53] and Ji et al. [54] by elucidating the interactions among these variables and their influence on market dynamics. Notably, the finding that an increase in consumer preference for the range of NEVs and higher NEV credit coefficients stimulates R&D and production, thereby enhancing social welfare, is particularly significant. This result strongly supports the formulation of policies that align consumer preferences with environmental goals. Furthermore, the discovery of the dual impact of credit prices on the production of FVs was unexpected, as it was found to depend on the anticipated proportion of NEV demand. This outcome highlights the necessity for policymakers to carefully assess market conditions when adjusting credit prices, given that the same policy instrument can yield divergent results in different market contexts. Overall, this research deepens the understanding of the complex interplay between policy, technology, and market dynamics within the automotive industry’s shift toward sustainable mobility. By emphasizing the nuanced effects of various factors on firm strategies and market outcomes, it lays a foundation for more effective strategic decision-making and policymaking in this rapidly evolving sector [64].
Innovation serves as a crucial catalyst for strategic decision-making within the automotive industry, a phenomenon clearly demonstrated by this investigation into the cooperative strategies adopted by manufacturers in response to China’s DCP [65]. This study delves into the complex interplay between market dynamics, technological advancements, and regulatory frameworks by integrating insights from political science, management, and economics. By analyzing these multifaceted relationships, the research underscores the transformative potential of innovation to foster both economic growth and environmental sustainability, particularly when informed by consumer preferences and aligned with supportive policies. The findings suggest that when policymakers and industry stakeholders prioritize innovation in tandem with consumer insights, it can lead to significant advancements in the automotive sector, ultimately contributing to a more sustainable future. This nuanced understanding of the interconnectedness of innovation, policy, and consumer behavior highlights the importance of strategic collaboration among manufacturers, thereby paving the way for more effective responses to the challenges of the evolving automotive landscape.
While this research provides significant insights into the dynamics of the automotive industry under the DCP framework, it is essential to acknowledge its limitations. First, our model operates under the assumption that all actors engage in rational decision-making and that information is available under optimal conditions. However, this premise may not accurately reflect the complexities of real-world scenarios, which often involve uncertainties and information asymmetries. Second, the analysis primarily focuses on R&D and production decisions, which may overlook other critical factors such as supply chain dynamics, international competition, and technological disruptions that can significantly influence firm strategies and market outcomes. Third, although we account for technology spillovers, our model may not fully encapsulate the complexities associated with knowledge diffusion and the varying absorption capacities of different types of firms. To address these limitations, future research should consider empirical studies aimed at validating and refining the theoretical insights presented in this study. Such investigations could also explore a broader array of influencing factors and incorporate dynamic modeling approaches to better capture the intricate realities of the automotive industry.
8 Conclusions and outlook
This paper investigates the coopetition strategies of dual-vehicles firms under the DCP framework, incorporating subsidies and consumer preferences. We examine scenarios where firms engage in R&D cooperation for both FVs and NEVs, developing a three-stage game model – “subsidy-R&D-production” – involving interactions between the government and these firms. Strategies considered include full competition, FVs R&D cooperation, NEVs R&D cooperation, and full cooperation. Through comparative and factor analysis, the study draws several key conclusions: (1) The government subsidy stimulates firms to increase R&D investments in NEVs, but does not affect R&D investments in FVs. (2) Under the optimal subsidy, when NEVs technology spillover is low, firms should opt for full cooperation strategy. Conversely, with significant NEVs technology spillover, firms should choose FVs R&D cooperation. However, to enhance social welfare concurrently, it is crucial to sustain a high level of technology spillovers for FVs. (3) Under the optimal strategy, both FVs and NEVs exhibit increases in R&D investments, outputs, profits, and social welfare with higher technology spillover levels, and more robust consumer preferences. Conversely, these outcomes for FVs decrease with higher proportions of NEV credits required and with discrepancies between actual and compliance fuel consumption values. (4) Under the optimal strategy, R&D investments and outputs of NEV increase with higher credits prices, whereas those of FVs, along with corporate profits and social welfare, exhibit uncertainty with increasing credit prices.
According to the above main findings, the government should prioritize the following management measures: (1) Refine the subsidy policy for mutual benefit to the government and firms. The optimal subsidies have promoted the R&D investments and outputs of NEVs, but they have not influenced the R&D investments and outputs of FVs, nor do they necessarily lead to optimal social welfare. Therefore, the government should encourage FVs firms to strengthen R&D cooperation and technical exchanges. Additionally, indirect subsidy policies such as tax exemptions for FVs’ R&D activities could be implemented. (2) Enhance firms’ technology absorption capacity and foster the flow of innovation factors. The equilibrium outcomes improve significantly with higher levels of technology spillover and absorption capacity under optimal strategies. Therefore, the government should promote partnerships between automobile firms, universities, and research institutes to foster collaborative innovation consortia, strengthen joint R&D in common technologies, facilitate technology transfer, and establish shared technology platforms for both FVs and NEVs. (3) Implement low-carbon certification for FVs and improve charging/swapping infrastructure for NEVs. The equilibrium outcomes increase as consumer preferences for low-carbon vehicles and range increase. Therefore, certification can stimulate R&D investments and demand for low-emission vehicles, while infrastructure improvements alleviate range anxiety and increase consumer willingness to adopt NEVs. (5) Strengthen the regulation of DCP and stabilize the credits price. Under the optimal strategy, as NEVs credits proportion and fuel consumption deviation increase, FVs’ R&D investments, outputs, profits, and social welfare decrease. Conversely, NEVs see increases in these metrics with higher accounting coefficients for NEVs credits. The impact of credit prices hinges on the current market dynamics between FVs and NEVs. Therefore, the government should closely monitor market dynamics, revise the DCP in a timely manner, and moderately raise the credit coefficient for NEVs. Concurrently, it is crucial to promptly implement the credit pool management system. Clarifying initiation conditions and establishing effective implementation and supervision mechanisms will stabilize credits market expectations.
In the future, there are several promising avenues for future research. One potential direction involves exploring the competitive strategies of two-vehicle manufacturers across multiple cycles while operating under the DCP. This examination could reveal deeper insights into how these firms adapt their strategies over time in response to evolving market conditions and regulatory environments. Furthermore, extending the model to consider asymmetric scenarios could provide a more nuanced understanding of how firms with varying capabilities and market positions interact within the framework of the DCP. Additionally, another important area for future investigation is the endogenization of the DCP itself. This approach could facilitate a more comprehensive analysis of how the dynamics of technology spillovers and the absorptive capacity of firms influence strategic decision-making. By integrating these elements into the model, researchers could gain a clearer picture of the interplay between policy frameworks, technological advancements, and firm behavior. Such studies would not only contribute to theoretical advancements in the field but also offer valuable insights for policymakers and industry stakeholders aiming to navigate the complexities of the automotive market in an era of rapid technological change and environmental concerns.
Funding
This research was funded by National Natural Science Foundation of China, grant number 72161003.
Conflicts of interest
The authors have no relevant financial or non-financial interests to disclose.
Author contribution statement
Conceptualization: Kaifu Yuan, Chuanji Wang.
Methodology: Chuanji Wang.
Software: Chuanji Wang.
Validation: Kaifu Yuan, Chuanji Wang, Xiao Fang.
Formal analysis: Chuanji Wang.
Funding acquisition: Kaifu Yuan.
Visualization: Chuanji Wang.
Writing – original draft: Chuanji Wang.
Writing – review & editing: Kaifu Yuan, Chuanji Wang, Xiao Fang.
References
- Gan K.E., Taikan O., Gan T.Y., Weis T., Yamazaki D., Schüttrumpf H. (2023) Enhancing renewable energy systems, contributing to Sustainable Development Goals of United Nation and building resilience against climate change impacts, Energy Technol. 11, 11, 2300275. [CrossRef] [Google Scholar]
- Lu C., Wang Q., Zhao M., Yan J. (2022) A study on competitive pricing and emission reduction strategies of automobile manufacturers under the “double credits” policy, Chinese J. Manag. Sci. 30, 1, 64–76. [Google Scholar]
- Cheng Y., Fan T. (2021) Production coopetition strategies for an FV automaker and a competitive NEV automaker under the dual-credit policy, Omega Int. J. Manage. Sci. 103, 102391. [CrossRef] [Google Scholar]
- Jiang C., Liu D. (2024) Effects of venture capital on green technology innovation in new energy vehicle industry in China, Energy Environ. 35, 1, 418–437. [CrossRef] [Google Scholar]
- Zhang X., Liang Y., Yu E., Rao R., Xie J. (2017) Review of electric vehicle policies in China: content summary and effect analysis, Renew. Sustain. Energy Rev. 70, 698–714. [CrossRef] [Google Scholar]
- Pang S., Hua G., Liu H. (2023) How do R&D capital market distortions affect innovation efficiency in China? Some evidence about spatial interaction and spillover effects, Socio-Econ. Plan. Sci. 90, 101739. [CrossRef] [Google Scholar]
- Maican F.G., Orth M. (2018) Entry regulations, welfare and determinants of market structure, Int. Econ. Rev. 59, 2, 727–756. [CrossRef] [MathSciNet] [Google Scholar]
- Guellec D., Van Pottelsberghe De La Potterie B. (2003) The impact of public R&D expenditure on business R&D, Econ. Innov. New. Tech. 12, 3, 225–243. [CrossRef] [Google Scholar]
- Bengtsson M., Raza-Ullah T., Vanyushyn V. (2016) The coopetition paradox and tension: the moderating role of coopetition capability, Ind. Mark. Manag. 53, 3, 19–30. [CrossRef] [Google Scholar]
- Czakon W., Klimas P., Mariani M. (2020) Behavioral antecedents of coopetition: a synthesis and measurement scale, Long Range Plan. 53, 1, 101875. [CrossRef] [Google Scholar]
- Gnyawali D.R., Park B.J. (2011) Co-opetition between giants: collaboration with competitors for technological innovation, Res. Policy 5, 40. [Google Scholar]
- Zhang X., Sun Z., Zhang W., Li X., Hu J. (2023) What drives horizontal logistics collaboration? A grounded theory analysis of Chinese logistics service providers, Sci. Prog. 106, 1, 1–23. [Google Scholar]
- Klimas P., Ahmadian A.A., Soltani M., Shahbazi M., Hamidizadeh A. (2023) Coopetition, where do you come from? Identification, categorization, and configuration of theoretical roots of coopetition, Sage Open 13, 1, 1–19. [CrossRef] [Google Scholar]
- Zhou X., Zhang J., Xu J. (2021) Research on the motivation for R&D cooperation between firms based on sequential game, J. Manag. Sci. China 24, 2, 111–126. [Google Scholar]
- Feng K., Karreman B., Zeng D., Pennings E. (2024) R&D collaboration, social coordination, and standardization: evidence from the Chinese automotive industry, J. Technol. Transf. 49, 1, 158–190. [CrossRef] [Google Scholar]
- Choi J., Lee J. (2017) Repairing the R&D market failure: public R&D subsidy and the composition of private R&D, Res. Policy 46, 8, 1465–1478. [CrossRef] [Google Scholar]
- Tassey G. (2004) Underinvestment in public good technologies, J. Technol. Transf. 30, 89–113. [CrossRef] [Google Scholar]
- Kamien M.I., Muller E., Zang I. (1992) Research joint ventures and R&D cartels, Am. Econ. Rev. 82, 5, 1293–1306. [Google Scholar]
- Park B., Lee C.-Y. (2023) Does R&D cooperation with competitors cause firms to invest in R&D more intensively? Evidence from Korean manufacturing firms, J. Technol. Transf. 48, 3, 1045–1076. [CrossRef] [Google Scholar]
- Xue J., Zheng B., Li S. (2024) Optimal production strategy for auto manufacturers with government subsidies in competitive environments, Front. Eng. Manag. 11, 2, 345–355. [CrossRef] [Google Scholar]
- Austmann L.M., Vigne S.A. (2021) Does environmental awareness fuel the electric vehicle market? A Twitter keyword analysis, Energ. Econ. 101, 105337. [CrossRef] [Google Scholar]
- Liu Z., Anderson T.D., Cruz J.M. (2012) Consumer environmental awareness and competition in two-stage supply chains, Eur. J. Oper. Res. 218, 3, 602–613. [CrossRef] [Google Scholar]
- Gulzari A., Wang Y., Prybutok V. (2022) A green experience with eco-friendly cars: a young consumer electric vehicle rental behavioral model, J. Retail. Consum. Serv. 65, 102877. [CrossRef] [Google Scholar]
- Wang X., Lin B. (2024) How has consumers’ willingness to pay for the environmental value of new energy vehicles changed? Based on comparative surveys in 2016 and 2023, Res. Int. Bus. Finance 72, 102508. [CrossRef] [Google Scholar]
- Arli D., Tan L.P., Tjiptono F., Yang L. (2018) Exploring consumers’ purchase intention towards green products in an emerging market: the role of consumers’ perceived readiness, Int. J. Consum. Stud. 42, 4, 389–401. [CrossRef] [Google Scholar]
- Avci B., Girotra K., Netessine S. (2015) Electric vehicles with a battery switching station: adoption and environmental impact, Manage. Sci. 61, 4, 772–794. [CrossRef] [Google Scholar]
- Deng J., Bae C., Denlinger A., Miller T. (2020) Electric vehicles batteries: requirements and challenges, Joule 4, 3, 511–515. [CrossRef] [Google Scholar]
- Chidambaram K., Ashok B., Vignesh R., Deepak C., Ramesh R., Narendhra T.M., Muhammad Usman K., Kavitha C. (2023) Critical analysis on the implementation barriers and consumer perception toward future electric mobility, Proc. Inst. Mech. Eng. Pt. D: J. Automobile Eng. 237, 4, 622–654. [CrossRef] [Google Scholar]
- Ma L., Ren H. (2018) A game research on the technology innovation of new energy automobile oriented to endurance, Soft Sci. 32, 11, 73–79. [Google Scholar]
- Alanazi F. (2023) Electric vehicles: benefits, challenges, and potential solutions for widespread adaptation, Appl. Sci. 13, 10, 6016. [CrossRef] [Google Scholar]
- Li X., Xiong Q.Y. (2021) Phased impacts of China’s dual-credit policy on R&D, Front. Energy Res. 9, 694338. [CrossRef] [Google Scholar]
- Li Y., Zhang Q., Liu B., McLellan B., Gao Y., Tang Y. (2018) Substitution effect of new-energy vehicle credit program and corporate average fuel consumption regulation for green-car subsidy, Energy 152, 223–236. [CrossRef] [Google Scholar]
- Ou S., Lin Z., Qi L., Li J., He X., Przesmitzki S. (2018) The dual-credit policy: quantifying the policy impact on plug-in electric vehicle sales and industry profits in China, Energy Policy 121, 597–610. [CrossRef] [Google Scholar]
- Zhao F., Chen K., Hao H., Wang S., Liu Z. (2019) Technology development for electric vehicles under new energy vehicle credit regulation in China: scenarios through 2030, Clean Technol. Environ. Policy 21, 275–289. [CrossRef] [Google Scholar]
- Cheng Y., Mu D. (2018) Optimal production decision of vehicle manufacturer based on double-score system, Syst. Eng. Theory Pract. 38, 11, 2817–2830. [Google Scholar]
- Tang J., Yang F., Jiang L. (2023) The research on the influence of industrial policies on production-decision of automakers to the COVID-19 shocking, Chinese J. Manag. Sci. 31, 8, 122–131. [Google Scholar]
- Lu C., Yan J. (2019) A R&D game of dual–oligopoly new energy vehicle enterprises: under the context of CAFC and NEV integrals transaction, J. Ind. Technol. Econ. 38, 1, 67–73. [Google Scholar]
- Zheng J., Zhao H., Li Z. (2019) A research on new energy vehicle industry R&D subsidy under the policy of “double credits”, Sci. Res. Manag. 40, 2, 126–133. [Google Scholar]
- Wang H.P., Yan X.C., Zhao D., Ge L.J. (2023) Research on production-decision of automakers considering consumer’s low-carbon preference under the government reward-penalty mechanism, Syst. Eng. Theory Pract 49, 9, 2669–2684. [Google Scholar]
- D’aspremont C., Jacquemin A. (1988) Cooperative and noncooperative R&D in duopoly with spillovers, Am. Econ. Rev. 78, 5, 1133–1137. [Google Scholar]
- Suzumura K. (1992) Cooperative and noncooperative R&D in an oligopoly with spillovers, Am. Econ. Rev. 85, 5, 1307–1320. [Google Scholar]
- Atallah G. (2002) Vertical R&D spillovers, cooperation, market structure, and innovation, Economics Innov. New Technol. 11, 3, 179–209. [CrossRef] [Google Scholar]
- Li Y., Zhang Q., Tang Y., Mclellan B., Ye H., Shimoda H., Ishihara K. (2020) Dynamic optimization management of the dual-credit policy for passenger vehicles, J. Clean. Prod. 249, 119384. [CrossRef] [Google Scholar]
- Huo H., Luo D., Yan Z. (2023) Automaker’s credits strategy considering fuel consumption and endurance capacity constraints under dual-credit policy in China, Front. Energy Res. 10, 963900. [CrossRef] [Google Scholar]
- Yuan K., Wang C., Wu G. (2024) Range coopetition: NEV automakers’ strategies under dual credit policy influences, J. Knowl. Econ. 1–37. https://doi.org/10.1007/s13132-024-02109-2. [Google Scholar]
- Bronzini R., Piselli P. (2016) The impact of R&D subsidies on firm innovation, Res. Policy 45, 2, 442–457. [CrossRef] [Google Scholar]
- You D., Zhu G. (2014) The enterprise’s optimal R&D investment and subsidy of eco-technology innovation under different co-competition modes, China Ind. Econ. 8, 122–134. https://doi.org/10.19581/j.cnki.ciejournal.2014.08.010. [Google Scholar]
- Chen J., Heng C.S., Tan B.C., Lin Z. (2018) The distinct signaling effects of R&D subsidy and non-R&D subsidy on IPO performance of IT entrepreneurial firms in China, Res. Policy 47, 1, 108–120. [CrossRef] [Google Scholar]
- Gao W., Hu X. (2020) New energy vehicle policy effect: does scale or innovation serve as an intermediary? Sci. Res. Manag. 41, 4, 32–44. [Google Scholar]
- Cao X., Xing Z., Zhang L. (2018) An evolutionary game analysis of new energy vehicle industry development under government regulations, Manag. Rev. 30, 9, 82–96. [Google Scholar]
- Liu D., Xiao B. (2018) Exploring the development of electric vehicles under policy incentives: a scenario-based system dynamics model, Energy Policy 120, 8–23. [CrossRef] [Google Scholar]
- Wu Y., Gu F., Ji Y., Guo J., Fan Y. (2020) Technological capability, eco-innovation performance, and cooperative R&D strategy in new energy vehicle industry: evidence from listed companies in China, J. Clean. Prod. 261, 121157. [CrossRef] [Google Scholar]
- Du S., Zhu J., Jiao H., Ye W. (2015) Game-theoretical analysis for supply chain with consumer preference to low carbon, Int. J. Prod. Res. 53, 12, 3753–3768. [CrossRef] [Google Scholar]
- Ji J., Zhang Z., Yang L. (2017) Carbon emission reduction decisions in the retail-/dual-channel supply chain with consumers’ preference, J. Clean. Prod. 141, 852–867. [CrossRef] [Google Scholar]
- Peng H., Pang T., Cong J. (2018) Coordination contracts for a supply chain with yield uncertainty and low-carbon preference, J. Clean. Prod. 205, 291–302. [CrossRef] [Google Scholar]
- Jacobs B.W., Singhal V.R., Subramanian R. (2010) An empirical investigation of environmental performance and the market value of the firm, J. Oper. Manag. 28, 5, 430–441. [CrossRef] [Google Scholar]
- Jiang A., Sheng X. (2017) Study on factors affecting new energy vehicle purchase and its direction policy in Beijing City, Fisc. Sci. 5, 12–26. [Google Scholar]
- Lim M.K., Mak H.-Y., Rong Y. (2015) Toward mass adoption of electric vehicles: impact of the range and resale anxieties, M&SOM Manuf. Serv. Op. 17, 1, 101–119. [CrossRef] [MathSciNet] [Google Scholar]
- Xiong Y., Chen M. (2017) Policy willingness and difference of new energy vehicle industry cultivation-based on the Internet public hotspot information, Forum Sci. Technol. China 10, 88–96. [Google Scholar]
- Zhou Y., Hu F., Zhou Z. (2018) Pricing decisions and social welfare in a supply chain with multiple competing retailers and carbon tax policy, J. Clean. Prod. 190, 752–777. [CrossRef] [Google Scholar]
- Zhang Y., Wu Z. (2021) Research on the spatial association network structure for innovation efficiency of China’s new energy vehicle industry and its influencing factors, PLoS One 16, 8, e0255516. [CrossRef] [PubMed] [Google Scholar]
- Chen Y., Zhan M., Liu Y. (2023) Promoting the development of China’s new-energy vehicle industry in the post-subsidy era: A study based on the evolutionary game theory method, Energies 16, 15, 5760. [CrossRef] [Google Scholar]
- He Q., Feng Y., Li Z. (2023) Dynamic complexity analysis of R&D levels in the automotive industry under the dual-credit policy, Sustainability 15, 23, 16520. [CrossRef] [Google Scholar]
- Peng L., Li Y., Yu H. (2021) Effects of dual credit policy and consumer preferences on production decisions in automobile supply chain, Sustainability 13, 11, 5821. [CrossRef] [Google Scholar]
- Yu H., Li Y., Wang W. (2024) Does the dual-credit policy promote the technological development of new energy vehicles? An industry chain reconstruction perspective, Heliyon 10, 10. [Google Scholar]
Appendix
Proof of Proposition 1
Clearly,  ,
,  .
.
It is easy to derive the conclusions from these expressions.
Proof of Proposition 2
Clearly, the government subsidy rate, R&D investments in NEVs, and output are all equal under strategy YD and strategy YJ. The comparison of R&D investments and output for FV:  ,
,  ; the comparison of profits and social welfare:
  ,
,  . Observing the above equations, it is not difficult to find that
  is constant, with the relative magnitudes of R&D inputs, production, and social welfare contingent upon the sign of (2β − 1). Analogously, the results of the comparison between strategy NR and strategy NC can be deduced.
Proof of Proposition 3
It is clear that the R&D investments, output in FVs are equal. The difference between the firms’ profits is:  . The difference between the R&D investments, outputs and social welfare are:
  ,
,  ,
,  , and the relative size of both is related to (2η − 1). Similarly, the results of the comparison between strategy NJ and strategy NC can be obtained.
Proof of Proposition 4
The comparison of R&D investments and outputs of NEVs under strategy NC and strategy ND are  ,
,  . The comparison of R&D investments and outputs of FVs under strategy NC and strategy ND are
  . The comparison results of strategy NR and strategy NJ are same. The comparison of corporate profits and social welfare under strategy NC(NJ) and strategy ND(NR) are
  ,
,  . The conclusions can be easily drawn from these expressions.
Proof of Proposition 5
This is obtained by synthesizing the proofs presented in Propositions 2 to 4.
Proof of Proposition 6
Clearly, the government subsidy rate, R&D investments in NEVs, and output are all equal under strategy YD and strategy YJ. The comparison of R&D investments and output for FV:  ,
,  ; the comparison of profits and social welfare:
  ,
,  . Observing the above equations, it is not difficult to find that
  is constant, with the relative magnitudes of R&D inputs, production, and social welfare contingent upon the sign of (2β − 1). Analogously, the results of the comparison between strategy YR and strategy YC can be deduced.
Proof of Proposition 7
It is clear that the R&D investments, output and social welfare in FVs and NEVs are equal. The difference between the optimal government subsidy rate is:  , and the difference between the firms’ profits is:
  , and the relative size of both is related to (1 − 2η). Similarly, the results of the comparison between Strategy YJ and Strategy YC can be obtained.
Proof of Proposition 8
It is clear that the R&D investments and outputs of both firms in NEVs are equal under the optimal subsidy. The comparison of the subsidy rate, R&D investments and outputs in FVs, social welfare are  ,
,  ,
,  , respectively. It is apparent that the relative magnitude of FVs’ R&D investments, outputs, and social welfare all hinge on the sign of (2β − 1). The comparison results between strategy YJ and strategy YR are analogous and will not be reiterated here. The comparison of corporate profits between Strategy YD(YJ) and Strategy YC(YR):
  , and the above conclusions can be easily drawn from this expression.
Proof of Proposition 9
This is obtained by synthesizing the proofs presented in Propositions 6 to 8.
Proof of Proposition 10
Clearly, regardless of whether the government provides subsidies, the R&D investments and outputs of FVs are equal under all four strategies. The comparison of other parameters are as follows:  ,
,  ,
,  . From this expression, the conclusion stated earlier can be easily derived. The comparison between Strategy YJ and Strategy NJ is similar to the comparison between Strategy YD and Strategy ND. Similarly, the comparison between Strategy YC and Strategy NC is akin to the comparison between Strategy YR and Strategy NR, which will not be elaborated upon further.
Proof of Corollary 1
The differentiation of the equilibrium results with respect to the level of technological spillovers under the four strategies yields:  . The conclusions can be readily inferred from these expressions. The differentiation of the equilibrium results across the four strategies in relation to consumers low-carbon preferences yields:
  , and it is easy to draw conclusions from these expressions.
The partial derivatives of the equilibrium results under the four strategies with respect to NEV credit requirement ratio and the difference between actual and standard values yield:  ,
, 
Proof of Corollary 2
The partial derivatives of R&D investments, outputs, and social welfare under strategy YD with respect to relevant parameters yield:  . The proof process for the above variables under the other three strategies is the same as that for strategy YD. The derivatives of the profits with respect to relevant parameters under strategies YR and YC yield:
  . The derivatives of the profits with respect to relevant parameters under strategies YD and YJ yield:
  , and these expressions clearly support the conclusions.
Proof of Corollary 3
The partial derivatives of R&D investments and outputs of NEVs with respect to relevant parameters yield:  . The proof of the relevant variables in the other three strategies is the same as that of Strategy YD. The partial derivatives of R&D investments and outputs of FVs with respect to relevant parameters yield:
  ,
,  ,
,  . The results of the partial derivatives of corporate profits and social welfare with respect to relevant parameters are presented as follows:
  ,
,  ,
,  ,
,  , and the above conclusions can be obtained from these expressions.
All Tables
All Figures
|
Fig. 1 The supply chain system structure. |
| In the text | |
|
Fig. 2 The comparison of corporate profit under four strategies without subsidies. |
| In the text | |
|
Fig. 3 The comparison of social welfare under four strategies without subsidies. |
| In the text | |
|
Fig. 4 The comparison of corporate profit under four strategies with optimal subsidies |
| In the text | |
|
Fig. 5 The comparison of corporate profit under strategy YD with and without subsidies. |
| In the text | |
Current usage metrics show cumulative count of Article Views (full-text article views including HTML views, PDF and ePub downloads, according to the available data) and Abstracts Views on Vision4Press platform.
Data correspond to usage on the plateform after 2015. The current usage metrics is available 48-96 hours after online publication and is updated daily on week days.
Initial download of the metrics may take a while.