")
")
Open Access
Figure 27
Download original image
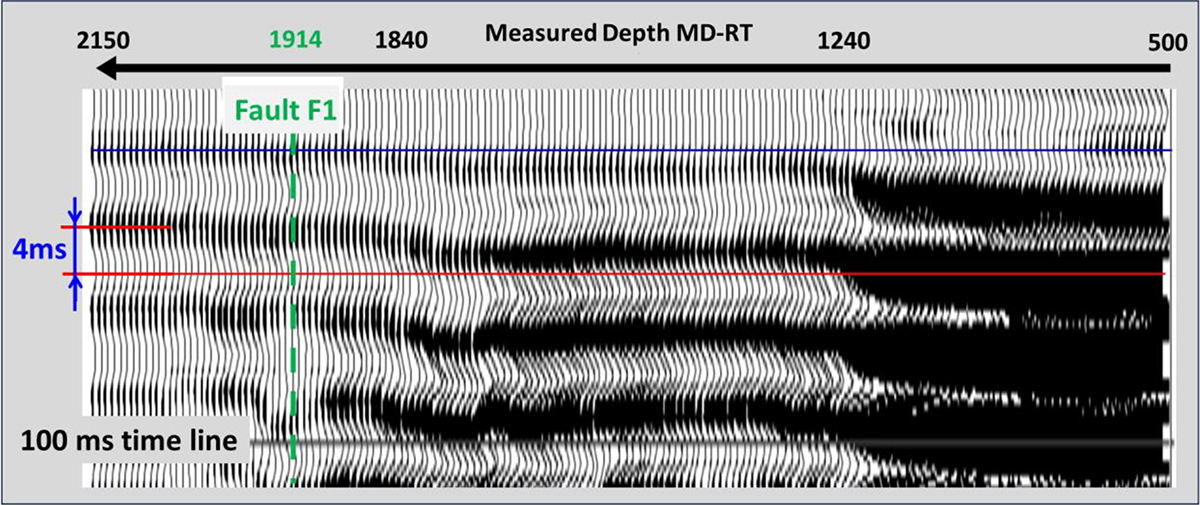
Downgoing raw P wavetrain flattened at 100 ms, full bandwidth amplitude peak normalized, then Low Cut filtered LC 120 Hz. Constant gain display. The dominant frequency corresponds to 150 Hz (7 ms period) on this display. The observed amplitude losses are relative to the amplitude of the first peak signal below 60 Hz.
Current usage metrics show cumulative count of Article Views (full-text article views including HTML views, PDF and ePub downloads, according to the available data) and Abstracts Views on Vision4Press platform.
Data correspond to usage on the plateform after 2015. The current usage metrics is available 48-96 hours after online publication and is updated daily on week days.
Initial download of the metrics may take a while.