")
")
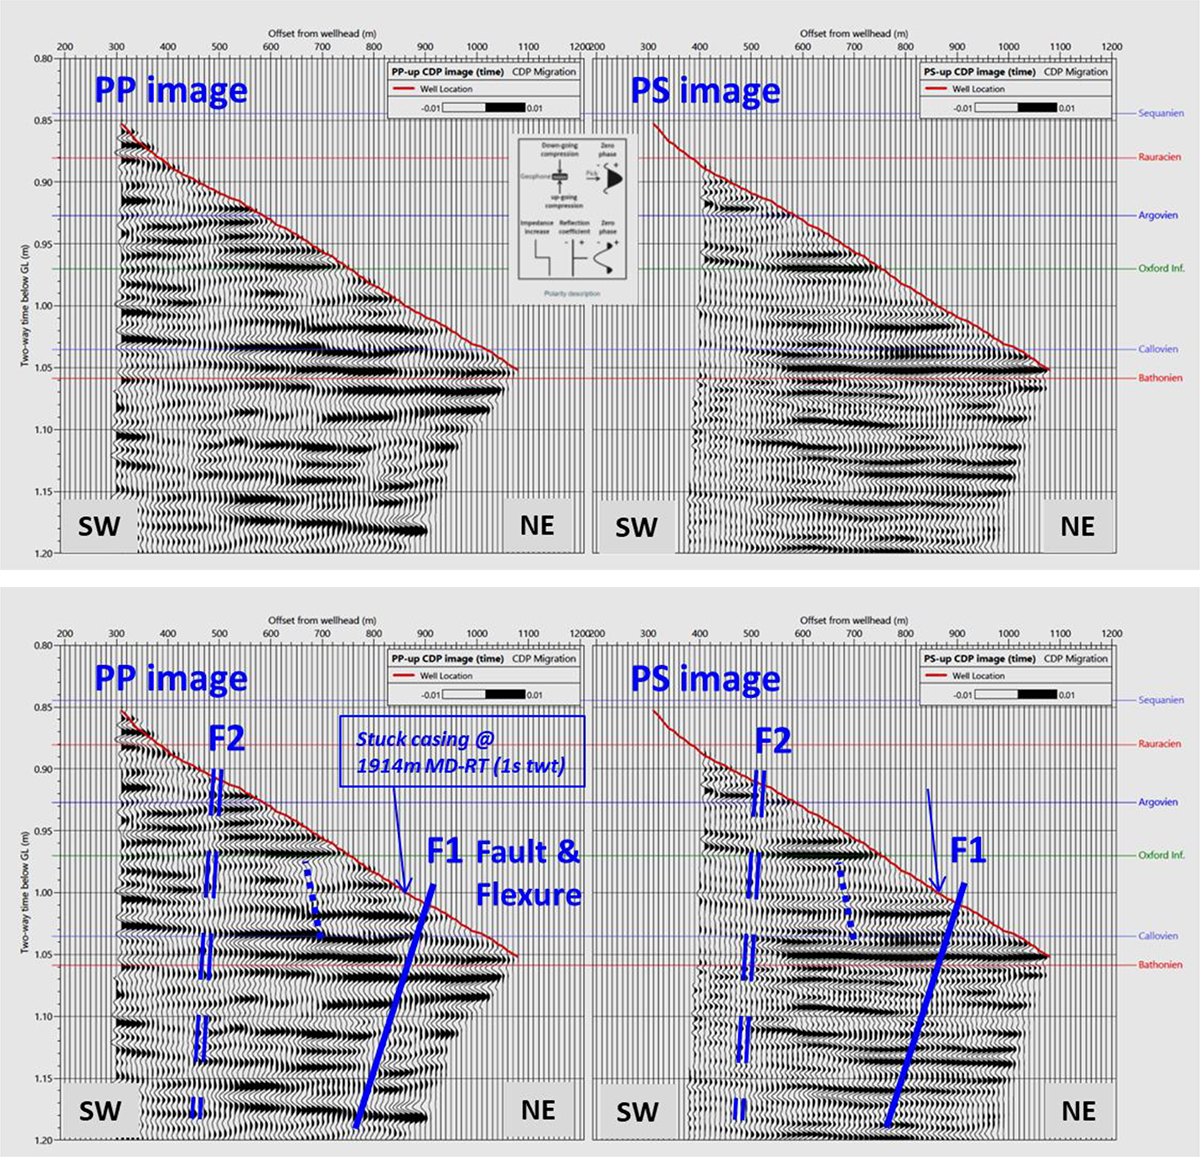
Figure 24
Download original image
PP-up and PS-up reflection images converted to time (twt). Main apparent faults are underlined on the bottom display, on BOTH images. The reflectors surrounding the top Bathonien are slightly dipping to NE, and affected by several step faults, attenuated by lateral enhancement and migration. On the right side, the PS image converted to P-wave twt scale is restituted with higher definition due to the shorter shear wavelength. Figure modified from Figure 4.3.3 of Bailey [8].
Current usage metrics show cumulative count of Article Views (full-text article views including HTML views, PDF and ePub downloads, according to the available data) and Abstracts Views on Vision4Press platform.
Data correspond to usage on the plateform after 2015. The current usage metrics is available 48-96 hours after online publication and is updated daily on week days.
Initial download of the metrics may take a while.