")
")
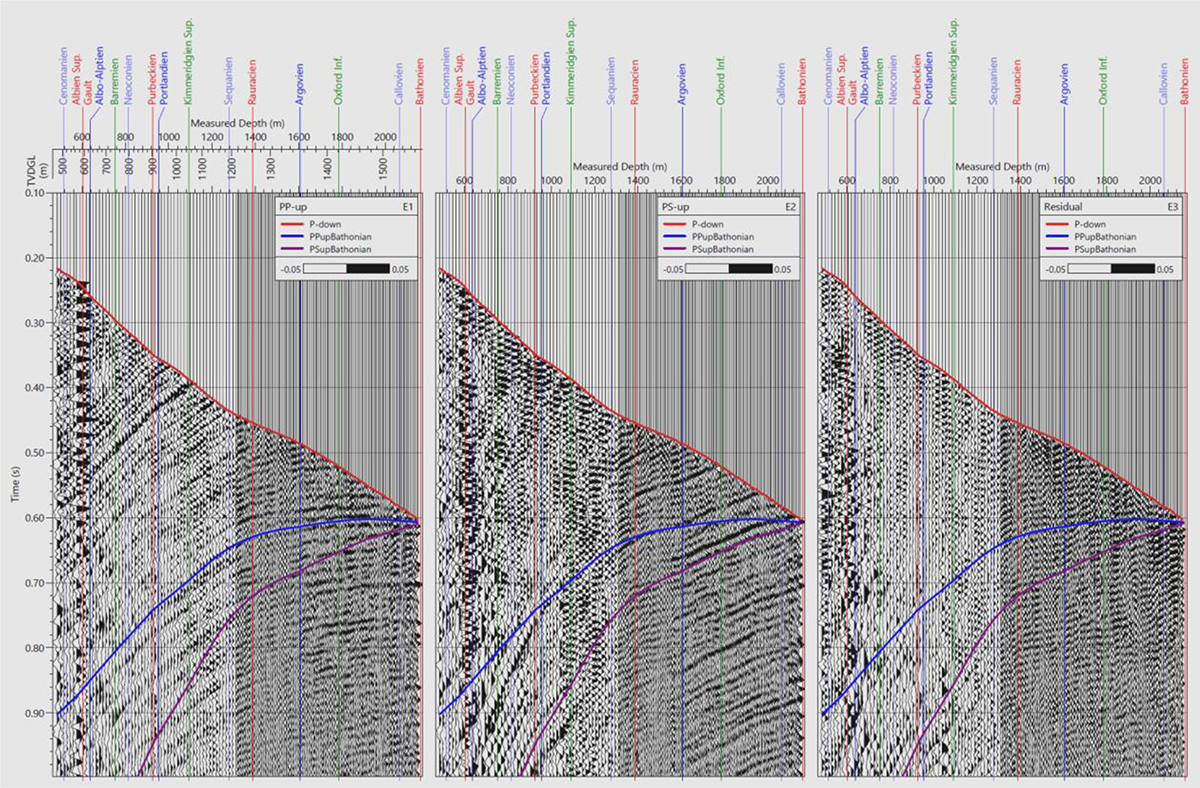
Figure 20
Download original image
True amplitude display of the deconvolved three components after model-based separation of the upgoing wavefield, left to right: P-P reflections, P-S reflection, residuals on horizontal orthogonal component. Amplitude variations versus receiver depth and versus reflection two-way time below deviated hole are respected and meaningful. Figure reproduced from Figure 4.1.1 of Bailey [8].
Current usage metrics show cumulative count of Article Views (full-text article views including HTML views, PDF and ePub downloads, according to the available data) and Abstracts Views on Vision4Press platform.
Data correspond to usage on the plateform after 2015. The current usage metrics is available 48-96 hours after online publication and is updated daily on week days.
Initial download of the metrics may take a while.