")
")
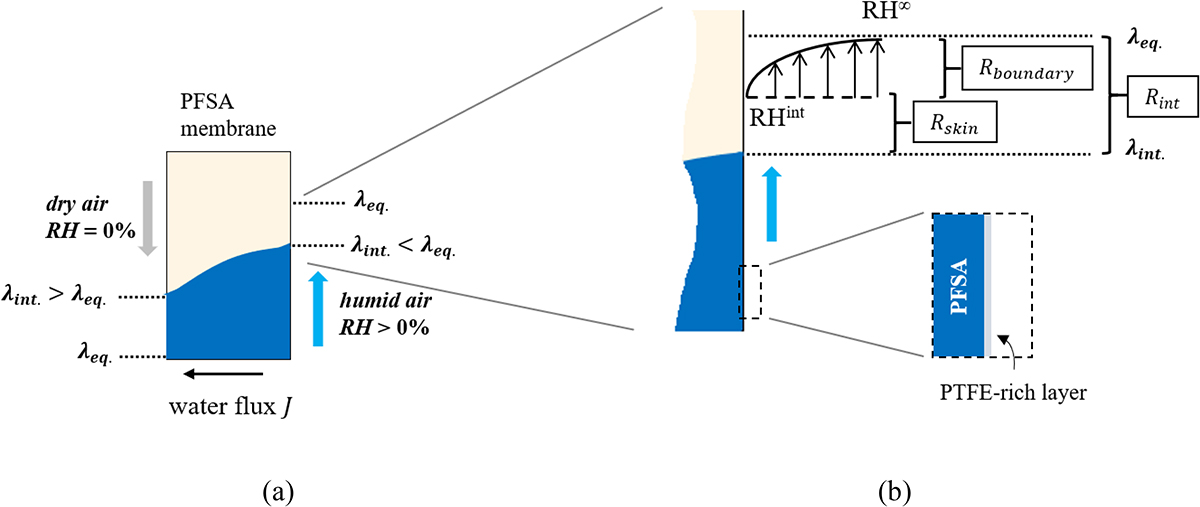
Fig. 10
Download original image
a) Illustration of the effect of an interfacial resistance on the steady-state water content at the interface. The non-linear water profile results from the concentration dependence of the diffusion coefficient. b) Zooming in on the interface reveals the presence of two resistances in series, one of which is due to the boundary layer effect and the other to the morphology of the thin PTFE-rich layer on the membrane surface.
Current usage metrics show cumulative count of Article Views (full-text article views including HTML views, PDF and ePub downloads, according to the available data) and Abstracts Views on Vision4Press platform.
Data correspond to usage on the plateform after 2015. The current usage metrics is available 48-96 hours after online publication and is updated daily on week days.
Initial download of the metrics may take a while.