")
")
| Issue |
Sci. Tech. Energ. Transition
Volume 81, 2026
Enabling Technologies for the Integration of Electrical Systems in Sustainable Energy Conversion
|
|
|---|---|---|
| Article Number | 6 | |
| Number of page(s) | 16 | |
| DOI | https://doi.org/10.2516/stet/2026008 | |
| Published online | 06 April 2026 | |
Regular Article
An enhanced EDBO-based planning for optimal placement and sizing of wind turbine-based distributed generators in unbalanced radial distribution system
1
Electrical Engineering Department, Jamia Millia Islamia, New Delhi, India
2
Electrical Engineering Department, JSS Academy of Technical Education, Noida, India
3
Electrical and Electronics Engineering Department, KIET Group of Institutions, Ghaziabad, India
* Corresponding author: This email address is being protected from spambots. You need JavaScript enabled to view it.
Received:
28
February
2025
Accepted:
28
January
2026
Abstract
Background: Researchers are actively addressing the environmental impact of fossil fuels by leveraging Renewable Energy Sources (RES), particularly wind power. However, the inherent variability of wind energy, driven by unpredictable wind speeds, presents challenges for ensuring the reliability of distribution systems. Objective: Efficiently determining optimal locations and capacities for integrating RES into distribution networks is crucial for realizing benefits such as improved voltage profiles, congestion mitigation, enhanced reliability, and reduced emissions. Placing RES in suboptimal locations may yield undesirable outcomes. Methodology: To address the issue, a nature-based optimization approach called Enhanced Dung Beetle Optimisation (EDBO) is introduced for selecting the most suitable positions and sizes for Wind Turbines (WT) within distribution systems. The optimization considers technical constraints such as wind power output, voltage, and power flow limits, and load balancing requirements. Test system: This optimization approach is applied to optimize WT placement and sizing within distribution systems, showcasing its effectiveness through simulation tests on IEEE-13 and IEEE-34 bus systems. Results and conclusion: The proposed method significantly reduces power loss compared to all other conventional techniques used in the IEEE-13 bus system and the IEEE-34 bus systems. Additionally, the technique enhances sustainable and reliable energy distribution in the context of WT integration.
Key words: Renewable energy sources (RES) / Wind turbines (WT) / Distribution system (DS) / Wind power output / Voltage and power flow limits
© The Author(s), published by EDP Sciences, 2026
 This is an Open Access article distributed under the terms of the Creative Commons Attribution License (https://creativecommons.org/licenses/by/4.0), which permits unrestricted use, distribution, and reproduction in any medium, provided the original work is properly cited.
1 Introduction
The growing need for electric power, in addition to the concerns of environmental conservation, has accelerated the adoption of Distributed Generation (DG) systems, especially those dependent on green energy resources [1]. Renewable Energy Sources (RES), such as Wind Turbines (WT), provide a clean and viable way forward to resolve the challenges of increased energy demand. WT systems are considered a mode of DG wherein they offer many advantages apart from providing economical and clean energy generated from wind [2]. One of the significant advantages of WT-based DG is the reduction of transmission and distribution losses. By generating electricity near the point of consumption, these systems minimize the energy losses that occur during long-distance transmission. This improves overall system efficiency and reduces the wastage of electricity [3]. The search for suitable sites for DG, including WT systems, is crucial to ensure effective network operation and avoid negative impacts while satisfying the objectives. Various algorithms are employed to allocate DG, particularly WT, in distribution networks, with diverse objective functions proposed in [4]. While analytical approaches and biological computing methods have been utilized, recent attention has shifted towards the application of smart optimization methods due to their ability to rapidly converge to the global optimum to fulfill objectives like losses and voltage deviation [5]. Tabu Search (TS) was employed to minimize losses in networks through the optimal placement of DG. This algorithmic approach helps identify the most effective locations for DG installations, considering factors that reduce energy losses and improve network efficiency. Another approach, presented in [6, 7], utilizes evolutionary programming [8] to find the placement of WT in radial networks.
In the unbalanced distribution network, PSO (Particle Swarm Optimisation) was used to determine the best bus installation and size. Using Artificial Bee Colony (ABC), the size of DG units for minimizing the goal function was established. The Firework Algorithm (FWA) is suggested in [9] for achieving the goals through DG installation. According to [10], PSO is used to minimize power losses when placing DG resources with the potential to inject reactive power. In [11], the ABC technique is used to allocate and schedule combined PV-diesel DG resources in networks. Referring to [12], the Backtracking Search Optimisation Algorithm (BSOA) is utilized to allocate DG with a view to lowering losses and enhancing the voltage profile. Using an updated Genetic Algorithm (GA), the site of the DG is chosen to reduce both the investment and operational costs as well as the cost of obtaining electricity from the main grid [13]. For WT allocation in distribution networks, the hybrid approach is used in [14]. The GA method is used in [15] to address the best WT unit sizing for the network. The Ant Lion Optimizer (ALO), which is used to optimize WT unit placement and size in networks, is presented in [16]. In order to reduce losses, [17] allocates WT units using the PSO algorithm. The distribution of WT units using the PSO algorithm is discussed in [18] with the goal of achieving objectives like lowering losses and enhancing stability in the voltage. The ideal positioning and sizing of WT units are investigated in [19] using a combined optimization method. The best distribution of WT units is established through the incorporation of various optimization strategies [20]. The existing state-of-the-art reveals the need for predetermining the optimal sizing and locations of DGs in the Distribution System (DS), generating an optimal active and reactive power to ensure the maximum benefits. Optimal placement of these elements will enable the DS operators to plan cost-effectively for expanding the distribution network to meet the growing demand. Consequently, it is imperative to track the optimal location and rating of the devices to minimize the feeder losses.
Numerous literature papers on optimal WT planning in DSs explore various techniques and aspects, as referenced in [21–35]. A classification approach to determine the optimal planning of DG units in DG was demonstrated by Oladeji et al. [27]. They considered the power loss and risk index of the branches as security indices to assess DG unit placements. To begin with, using power loss and risk index as a security measure could result in understanding DSs in a restricted manner, which is not ideal. The practicality of the model may also depend upon the correct input information, where, in this case, variation in loads or renewable energy generation resources may hinder the successful application of the typology. Hemeida and others [21] employed the Genetic Archimedes Optimization Algorithm (GAAOA) for the improvement of voltage profiles and reduction of costs during network reconfiguration. The GAAOA technique was applied for the allocation and sizing of sources considering load variation. The study might not cater to all variations in loads and dynamism in the system, thus affecting the suitability of the optimization work. The minimization of total energy loss using Non-Linear Programming (NLP) for allocating the DG was reported in Shawon et al. [22]. Considering the uncertainty and operational limitations, the optimal solution to the planning issue was achieved through the Optimal Power Flow (OPF). These approaches of the NLP operations might have difficulty solving due to the computational burdens when applied to large systems, thereby limiting the extent of the methodology. In addition, due to the focus on the OPF solution, the practical use of the proposed approach in the dynamic electric power system may not be instant. The use of GA, PSO, and Variable Constants (VCPSO) in the DS was reported by Alajmi et al. [23]. The sizing and siting detection of multiple DGs were largely investigated for the purpose of bus voltage variation improvement and active power loss minimization. Optimization problem complexities in the planning of multi-distributed generation systems may be aggravated by the addition of multiple distributed generation units, leading to increased computation times. Last but not least, the tentative application of the design in different DS conditions may present the need for possible modification after the experiments and elicit some stakeholder concerns. DG integration optimization considering power output variations and uncertainty is presented in Ramadan et al. [24]. A new hybrid algorithm was proposed in the research. The Artificial Hummingbird Algorithm (AHA) was used to solve the ratings and placement of distributed generation. The algorithm presented deals with the minimization of the overall cost, voltage deviation, and emissions. With this accomplishment, the damping of voltage has been enhanced, considering the variation in load and generation. The extension and appropriateness of the presented technique to various sizes and configurations of the networks are subject to further research.
Gao et al. [25] explored the multi-objective planning model for a distributed generation system that uses DFS and MWST, and was comprehensively evaluated. With the proposed approach, operational risk was reduced, and profit maximization was achieved. The implementation of the techniques over the networks can depend on the configuration of the network, limiting their efficiency in some conditions. The available RES and Demand Response program, with its aim of economic enhancement, voltage stability, and Power Loss Reduction (PLR) in the DS, was presented by Taha et al. [26]. The model proposed does not ignore the various RES and the storage battery. The model’s reliance on renewable sources introduces uncertainties in generation, requiring effective management strategies for intermittent power supply. Optimizing RES-based DG placement, size, and off-load tap-changing transformer settings was focused on by Das et al. [28]. The effectiveness of the optimization model may be contingent on the accuracy of input data, including renewable energy resource assessments and load predictions.
Khezri et al. [29] examined optimal renewable system capacities within the grid to minimize overall electricity costs (COE) from various angles. Inaccurate data leads to suboptimal sizing of renewable systems. A coordinated allocation strategy for renewables and electric vehicles was presented by Kianmehr et al. [30]. Practical challenges related to grid capacity, stability, and the need for infrastructure upgrades are not adequately addressed, impacting the feasibility of the proposed allocations. Gupta [31] employed a probabilistic approach to optimize reactive power planning, accounting for RES, loads, and vehicle charging uncertainties. Assumptions related to system behavior, correlations between uncertainties, and system constraints should be critically examined. A co-optimization algorithm to achieve the optimal distribution of power sources within the grid, addressing diverse aspects of grid planning and renewable energy integration, was explored by Parizy et al. [32]. The economic feasibility of the optimal distribution is sensitive to assumptions regarding technology costs and market conditions. A grid-integrated renewable system with stator voltages and currents in the generator was designed by Singh and Bhuvaneswari [33]. An Optimal Energy Storage System Allocation (OEA) approach for generator-fed WT, designed to minimize wake effects on power quality analysis, was presented by Xiong et al. [34]. The optimization model does not consider the dynamics of the Energy Storage System (ESS) and WT, which are crucial issues that may undermine the efficiency of the proposed allocation strategy. Moreover, Fu et al. [35] presented a developed model, which incorporates operations of Hydrogen Compressed Natural Gas (HCNG) to evaluate the performance of the given system in distribution networks of HCNG for different ratios of H2 volume and HCNG load portfolios (HLP). For energy networks with heat and electricity integration where HCNG is present, a lot of computational modeling is required in order to capture the various dynamics and physical characteristics of the system coupled with HCNG.
In a real-world transmission network, Kumar et al. [36] suggested optimal DG incorporation along with developed controllers. Expansion of networks through the addition of substations and transmission lines can be very costly and lengthy due to the amount of money that will have to be put in to attain this and the long time it will take to get the necessary approvals. Ali et al. [37] used the White Shark Optimization (WSO) methodology to increase the performance of the design of renewable systems by loss minimization and voltage profile improvement. This study examines the problem of optimal planning of power systems containing DG sources; however, it may be based on some oversimplified models and assumptions that may not be applicable in real-world situations and hence cause inferior solutions. In the context of power system parameters, Hassanzadeh et al. [38] examined a problem that is multi-objective and involves bi-level optimization. They designed the size and capacity of the Battery ESS (BESS) to curb frequency variations. Due to this, the optimization models may be oversimplified, making the solutions not very effective. Oraibi and others [39] designed an optimization model using mixed-integer linear programming to restore prioritized loads within topological and operational limits. Current research may be limited to certain resilience outcomes, such as the amount of power loss that can be avoided or the extent of load shedding that can be carried out, disregarding other aspects of system resilience, such as the resilience to various types of failures, the time taken to recover, and flexibility. Megaptche and his colleagues [40] proposed a Demand Response-Fuzzy Inference System Controller (DR-FIS). The load management comes into use and is planned in real time for the autonomous renewable systems. Perhaps this research would limit itself to dealing with what is known as static demand response only, without exploring the advantages of active real-time demand response strategies for enhancing grid efficiency at lower costs.
1.1 Contribution
The main contributions of this research are as follows:
-
New Optimization Methodology: Development of an Enhanced Dung Beetle Optimisation (EDBO) algorithm for the optimal allocation (sitings) and the optimal sizes of WT into DSs.
-
Realistic Technical Constraints: Incorporation of real-world technical limitations such as limited wind-generated power, voltage stability, limits on line power flow, and load balancing issues.
-
Multi-Test System Demonstration: The EDBO methodology is applied and demonstrated using the IEEE-13 and IEEE-34 bus DSs, with process robustness and scale evaluated.
-
Performance Improvements: The application of EDBO is shown to limit power losses and provide better voltage profiles than traditional optimization methods.
-
Sustainability Benefits: Applying the EDBO methodology will not only allot WT in DSs optimally, but it will also assist in achieving reliable energy distribution solutions to eventually transition toward renewable energy in DSs.
-
Future Enhancement Direction: Identification of future work involving realistic wind speed mapping with spatial effects for improved applicability in real-world scenarios.
2 Renewable DG modelling
Renewable DG plays a crucial role in modern DSs, with wind-based power generation being the most prevalent and extensively integrated source. Wind power’s eco-friendliness, lack of fuel requirements, and lower operational costs have spurred its integration. However, the wind’s intermittency poses challenges. Fluctuating wind speeds lead to variable power output, affecting power quality through voltage fluctuations, increased losses, and reduced stability. Stochastic wind speed variations are mathematically modeled using the Weibull probability density function in reference [41]. Equation (1) represents the speed probability of the wind speed:![Mathematical equation: $$ {f}^t\left(\alpha \right)={\left(\frac{{\alpha }^t}{{C}^t}\right)}^{{K}^{t-1}}\left(\frac{{K}^t}{{C}^t}\right)\mathrm{exp}\left[-{\left(\frac{{\alpha }^t}{{C}^t}\right)}^{{K}^t}\right], $$](/articles/stet/full_html/2026/01/stet20250106/stet20250106-eq1.gif) (1)where the speed of wind at a particular time is represented as f
t
(α), shape and scale parameters are indicated as K
t
and C
t
, distribution skewness as well as probability of different wind speeds occurrence at tth time is indicated as α
t
. The wind speed parameters are measured and evaluated using the following equations,
(1)where the speed of wind at a particular time is represented as f
t
(α), shape and scale parameters are indicated as K
t
and C
t
, distribution skewness as well as probability of different wind speeds occurrence at tth time is indicated as α
t
. The wind speed parameters are measured and evaluated using the following equations, (2)
(2)
 (3)where statistical measures for wind speed are represented as μ
t
and σ
t
, the gamma function is expressed as Γ. The wind speed probability for a particular hour in a specific state “p” is determined by aggregating the probabilities associated with that state at the given hour “nb”.
(3)where statistical measures for wind speed are represented as μ
t
and σ
t
, the gamma function is expressed as Γ. The wind speed probability for a particular hour in a specific state “p” is determined by aggregating the probabilities associated with that state at the given hour “nb”. (4)
(4)
WT output power depends on-site wind velocity and the manufacturer’s power curve, derived mathematically as follows: (5)where the WT output power at time is expressed as
  , WT output power at state “p” is expressed as PDGwind,p.
 (6)
(6)
 (7)
(7)
 (8)where rated output power from the WT is denoted as Prated, average WT speed is represented as αavg, cut-in speed is indicated as αci, rated speed is expressed as αr, cut-out speed is denoted as αco.
3 Problem formulation
Figure 1 illustrates the overall procedure for defining the planning of WT within the DS. The proposed model aims to integrate RES into the DS with three primary objectives: (a) reducing power losses, (b) improving voltage stability, and (c) minimizing voltage deviations.
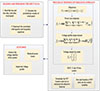 |
Figure 1 Proposed overall procedure for optimal planning of WT. |
The objective function formulation for the planning model is formulated in the accompanying [41].
 (9)where the objective function is represented as Ft, reduction in power loss is expressed as f1, voltage profile improvement is denoted as f2, Voltage Sensitivity Index (VSI) enhancement is expressed as f3.
3.1 Reduction in power loss
The primary goal is to minimize DS power losses [40, 41], and the one-line diagram is illustrated in Figure 2.
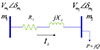 |
Figure 2 One-line diagram. |
The following equations describe the system power losses within the DS at a specific branch “i”: (10)
(10)
 (11)
(11)
 (12)where Pi and Qi denotes the active and reactive power, active and reactive loads at the bus m2 are represented as Pm2 and Qm2, buses voltage m1 and m2 are denoted as Vm1 and Vm2, Ri, Xi denotes the resistance and reactance, current flowing from m1 and m2 is expressed as Ii. The equations related to the first objective function are computed as follows [41]:
 (13)
(13)
 (14)
(14)
 (15)where active and reactive power losses are expressed as Pi,loss and Qi,loss, total network loss is denoted as Tloss, number of branches is expressed as nb. Mathematically, the active PLR (f1) is derived as follows:
 (16)where Nse and Nt denotes the control parameters of the optimization problem, and NB represents the total bus number.
3.2 Voltage profile improvement
The second objective of this study is to reduce voltage deviations induced by the radial structure of the DS, particularly in heavily loaded and distant areas. This is mathematically represented by equation (17), as follows: (17)where voltage deviation or variation from the desired or nominal voltage level is expressed as Vm.
3.3 Voltage sensitivity index
The third objective of this study is to evaluate the voltage stability and reliability of the DS [41]. The equation is derived as follows: (18)
(18)
 (19)where VSI for bus m2 is denoted as VSIm2, VSImi denotes the VSI for the whole system concerning time “t”,
  denotes the variable related to deriving the third objective function. Then the third objective function is formulated as follows:
 (20)
(20)
3.4 System constraints
Equations (21)–(26) outline the constraints of the proposed planning work. The power balance equations for this system are established as follows: (21)
(21)
 (22)where
  and
and  denote the entire active as well as reactive power of DG with “t”,
  and
and  represent the entire active as well as reactive power loss with “t”,
  and
and  represent the entire active as well as reactive power load with “t”. The position of WT is expressed in the accompanying:
 (23)where WTposition denotes the WT position, nbuses denotes the slack bus. To ensure the quality of power supplies, it is necessary for the voltage magnitudes at each bus within the network to adhere to the following constraints:
 (24)where the minimum and maximum range of voltage with respect to “t” are denoted as
  and
and  , voltage profile of the branch “i” with respect to “t” is denoted as
  . The boundary conditions for the WT are subject to restrictions, as specified in equation (25):
 (25)
(25)
Line capacity constraints for a given line adhere to its maximum thermal rating limit, defined as: (26)where line capacity constraints for the line are expressed as
  , rated line capacity is expressed as
  .
.
4 Optimal location and sizing of WT
Optimal planning of WT units within a DS plays a pivotal role in elevating voltage levels, alleviating congestion, bolstering reliability, and curbing emissions. These factors are essential in achieving optimal system performance. Several approaches are introduced for the optimal planning of WT units in the DS, such as GAAOA, PSO, and AHA. The GAAOA method requires fewer algorithm parameters to find a global solution. In some instances, however, the operational limitations governing the DG units may not necessarily be stated, which can hamper the efficiency of the solutions reached. It has been noted that the AHA model has a limited impact on the reduction of the losses of power. Hence, there is a gap that needs to be filled by finding an optimal solution that addresses these challenges and also aims at optimizing the power flow of the WT in the DS. Further research work has been prompted by these drawbacks and limitations to come up with an optimal solution that includes operational constraints and is geared towards minimizing power loss and enhancing the performance of the system.
4.1 Enhanced Dung Beetle Optimisation
The Dung Beetle Optimizer (DBO) algorithm is yet another innovative population optimization algorithm inspired by the various activities associated with dung beetles, such as ball rolling, dancing, foraging, stealing, and breeding.
DBO integrates local and global exploitation strategies, allowing it to have benefits like fast convergence and moderate accuracy in the solutions. However, since the main DBO method gives rise to several problems, a further developed approach called EDBO was proposed to resolve them. EDBO focuses on tackling problems such as intergenerational populations causing slow convergence, getting stuck at a certain point, and a lack of an adequate search scope. The algorithm further applies the Spiral Search Strategy that is based on the Whale Optimization Algorithm to facilitate better location updates during dung beetles’ reproduction and foraging processes. Furthermore, the Levy Flight Strategy is utilized to fine-tune location updates for dung beetle stealing behavior. This addition enhances the algorithm’s ability to escape local optima, facilitating more effective exploration of the solution landscape [42].
The primary approach involves utilizing the EDBO algorithm to achieve the best fitness function. The fitness function is established based on equation (9). The flowchart of the EDBO technique is demonstrated in Figure 3, and Table 1 illustrates the computational flow of EDBO optimization while achieving the optimal parameters. The EDBO algorithm agents are then all randomly initialized after that. The DBO algorithm comprises 6 steps: Initialize the EDBO algorithm’s settings; compute each agent’s fitness value concerning the performance index; update the dung beetles’ position; and determine whether DB crossed the optimal foraging area. Hold and carry the procedure until the problem fulfills the termination requirement; at that point, the global optima and its fit value are produced.
 |
Figure 3 Flowchart of the proposed EDBO technique. |
4 Analysis of performance using the proposed approach
The proposed system performance is evaluated using MATLAB and tested on two IEEE benchmark systems, namely, the IEEE 13 and 34 bus systems. The outcomes highlight improvements in voltage profiles, PLR, and voltage stability using the EDBO technique. Comparative analysis with existing approaches is also conducted. Table 2 provides system parameters and values, while graphical representations of the results follow.
System parameters and their values.
4.1 Analysis of IEEE-13 Bus System with Proposed Approach
Figure 4 illustrates the single-line representation of the IEEE 13 bus system, while Figure 5 presents voltage magnitudes estimated by the proposed algorithm for phases a, b, and c within the IEEE 13 bus system. For instance, at bus 633, the estimated magnitudes are 1.02 p.u. for phase “a”, 1.018 p.u. for phase “b”, and 1.04 p.u. for phase “c”. Likewise, the other two buses provide the best results. These findings underscore the algorithm’s precision in voltage magnitude estimation.
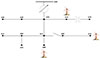 |
Figure 4 Single line representation of IEEE 13 bus system. |
 |
Figure 5 Voltage variation for three phases in IEEE 13 bus system. |
Figure 6 presents the voltage variation for phase “a” in the IEEE 13 bus system, comparing the actual system with the WT incorporation. The results indicate that integrating WT, specifically at buses 680, 675, and 633, results in voltage profile improvements of 1.98%, 1.01%, and 0.19%, respectively, compared to the actual system. These findings highlight the positive effect of WT on enhancing voltage stability in the system.
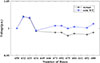 |
Figure 6 Voltage profile for actual and with WT for phase “a” in IEEE 13 bus system. |
The voltage profile for actual and WT for phase “b” in the IEEE 13 bus system is depicted in Figure 7. The analysis primarily evaluates how the performance of WT affects the system voltage stability. The findings indicate that the installation of WT improves the voltage profile (at bus 680, bus 675, and bus 633 is 1.145%, 0.95%, and 0.095%, respectively) compared to the actual, showcasing its positive impact on grid stability.
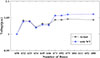 |
Figure 7 Voltage profile for actual and with WT for phase “b” in IEEE 13 bus system. |
Figure 8 illustrates the voltage profile for phase “c”, both in the actual and integration of WT in the IEEE 13 bus system. This analysis focuses on assessing how the WT performance influences the stability of the system voltage. The results highlight that the inclusion of WT enhances the voltage profile (at bus 680, bus 675, and bus 633 is 2.040%, 1.02%, and 0.019%, respectively), underscoring its beneficial impact on grid stability.
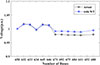 |
Figure 8 Voltage profile for actual and with WT for phase “c” in IEEE 13 bus system. |
The overall voltage profile for actual and WT in the considered test system is shown in Figure 9. This analysis primarily assesses the introduction of WT influences on the stability of the system voltage. The results demonstrate that the inclusion of WT enhances the voltage profile with less deviation (at bus 680, bus 675, and bus 633 is 1.98%, 2%, and no deviation, respectively) when compared to the actual, highlighting its favorable effect on grid stability.
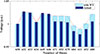 |
Figure 9 Overall voltage profile for actual and with WT in IEEE 13 bus system. |
The investigation of power loss with iterations count in the considered test system is shown in Figure 10. The analysis of power loss with the number of iterations shows that it optimizes power efficiency by refining the system parameters for every iteration, aiming to minimize power losses (29kW at the 8th iteration). Figure 11 presents the objective function performance using the proposed EDBO technique.
 |
Figure 10 Analysis of power loss with a number of iterations. |
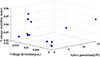 |
Figure 11 Performance analysis of objective function in IEEE 13 bus system. |
Table 3 portrays the performance analysis of various existing approaches in the IEEE 13 bus system. This analysis assesses the impact of the objective function on critical parameters. Lower VSI values (0.05) indicate enhanced voltage stability, while reduced voltage deviation (0.011) signifies improved voltage quality. Minimizing active power loss (0.05) enhances overall system efficiency, contributing to a more stable, reliable, and efficient system operation. The performance analysis includes a comparison with various existing approaches, as outlined in Table 3. The proposed approach yields a total power loss of 28.9986 kW. The optimal results from the proposed approach are evaluated against Repeated Load Flow (RLF), WOA (Whale Optimization Algorithm), SSA (Salp Swarm Algorithm), and WOA-SSA approaches, providing insights into its effectiveness and competitiveness.
Performance analysis of various existing approaches in the IEEE 13 bus system.
4.2 Analysis of IEEE-34 Bus System with the proposed approach
Figure 12 illustrates the single-line representation of the IEEE 34 bus system, while Figure 13 presents the voltage profiles for all three phases within this system. In particular, for bus 806, the method results in voltage magnitudes of 1.048 per unit (p.u.) for all phases. At bus 888, the estimations vary, with values of 0.98 p.u. for phase “a”, 0.975 p.u. for phase “b”, and 0.98 p.u. for phase “c”. Lastly, at bus 890, the algorithm yields estimations of 0.91 p.u. for phase “a”, 0.9 p.u. for phase “b”, and 0.91 p.u. for phase “c”.
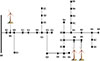 |
Figure 12 Single line representation for the IEEE 34 bus system. |
 |
Figure 13 Voltage profile for three phases in the considered test system. |
In Figure 14, a voltage analysis for phase “a” compares the actual IEEE 34 bus system with the system incorporating WT. This evaluation measures the WT’s influence on voltage stability within the DS. The results clearly show that integrating WT, particularly at buses 806, 890, and 888, results in voltage profile improvements of 0.1908%, 2.1978%, and 2.0408%, respectively, compared to the baseline system. This highlights the positive impact of WT on enhancing voltage stability within the system.
 |
Figure 14 Voltage profile for actual and with WT for phase “a” in IEEE 34 bus system. |
Figure 15 displays a voltage analysis for phase “b”, contrasting the base IEEE 34 bus system with the system integrating WT. This assessment examines the WT variations that impact voltage stability within the DS. The results obviously reveal that integrating WT, particularly at buses 806, 890, and 888, leads to improvements in the voltage profile of 0.0953%, 2.22%, and 1.0204%, respectively, compared to the original system. This underscores the positive effect of WT on enhancing voltage stability in the system.
 |
Figure 15 Voltage profile for actual and with WT for phase “b” in IEEE 34 bus system. |
Figure 16 illustrates a voltage analysis for phase “c”, contrasting the existing IEEE 34 bus system with the incorporation of WT. This evaluation scrutinizes how WT integration affects voltage stability within the DS. The results affirm an enhancement in the voltage profile, notably at buses 806, 890, and 888, showing improvements of 0.1908%, 2.197%, and 1.9367%, respectively, compared to the baseline system voltage. This highlights the beneficial impact of WT on bolstering voltage stability within the system.
 |
Figure 16 Voltage profile for actual and with WT for phase “c” in IEEE 34 bus system. |
Figure 17 illustrates the actual inclusion of WT with a voltage profile. Outcomes indicate that the incorporation of WT improves the voltage profile with less deviation (at bus 806, bus 890, and bus 888 is 0.19%, 2.19%, and 1.02%, respectively) in comparison to the actual, emphasizing its beneficial effect on grid stability.
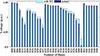 |
Figure 17 Overall voltage profile for actual and with WT in IEEE 34 bus system. |
Figure 18 presents an analysis of power loss with iteration count. The goal is to achieve the objective function, and notably, at the 9th iteration, a reduction of 18 kW is achieved, indicating significant progress in enhancing system efficiency.
 |
Figure 18 Analysis of power loss vs. number of iterations in the considered test system. |
Objective function analysis in the considered test system is shown in Figure 19. A lower VSI (0.13) signifies improved voltage stability, while reduced voltage deviation (0.017) indicates better voltage quality. Minimizing active power loss (0.02) enhances the system’s efficiency. Thus, it promotes a more stable, reliable, and efficient system operation.
 |
Figure 19 Objective function analysis in the considered test system. |
Figure 20 provides a performance analysis of the VSI for both test systems, considering the presence and absence of WT. In the IEEE 13 bus system, VSI values without and with WT are 0.042 and 0.038, respectively, while in the IEEE 34 bus system, these values are 0.03 without WT and 0.027 with WT. Table 4 offers a comparative performance analysis of various methods within the context of the considered test system. It specifically assesses the total power loss achieved using the proposed approach, reported as 14.2086 kW. These optimal results from the proposed approach are juxtaposed with those obtained using [44] and the Empirical Discrete Metaheuristic (EDM) in conjunction with the Steepest Descent method, providing insights into the proposed approach’s effectiveness and competitiveness.
 |
Figure 20 Performance analysis of VSI for IEEE 13 and 34 bus systems. |
Performance analysis of various existing approaches in IEEE 34 bus system.
5 Conclusion and future work
This research study provides an EDBO-based methodology for optimizing WT placement and sizing in the DS. Validation is carried out on the MATLAB environment and analyzed on two IEEE standard benchmark systems. Results show the EDBO method had the capability to optimize the objective function through appropriate planning of WT. Comparative analysis against other approaches underscores the proposed method’s superior performance in optimizing WT planning within DSs. Voltage profiles for both bus systems are within standard limits following WT integration. Incorporating a variable load model can significantly enhance the analysis by reflecting realistic operating conditions. Future work will use this model to completely examine its impact on distribution network losses, particularly under different wind power generating scenarios, thereby boosting the study’s accuracy and applicability. Future work will focus on improving wind speed modelling by accounting for spatial variability, resulting in a more accurate representation of real-world wind conditions and adding another layer of realism, applicability, and practicality to the optimization framework for real-world wind power plant siting and operations.
Funding
No funding has been received for this work.
Conflicts of interest
The authors declare that they have no known competing financial interests or personal relationships that could have appeared to influence the work reported in this paper.
Data availability material
Data sharing is not applicable to this article, as no datasets were generated or analyzed during the current study.
References
- Pushkarna M., Ashfaq H., Singh R., Kumar R. (2022) A new analytical method for optimal sizing and sitting of Type-IV DG in an unbalanced distribution system considering power loss minimization, J. Electr. Eng. Technol. 17, 2579–2590. [Google Scholar]
- Kumar R., Khetrapal P., Badoni M., Diwania S. (2021) Evaluating the relative operational performance of wind power plants in Indian electricity generation sector using two-stage model, Energy Environ. 33, 7, 1441–1464. [Google Scholar]
- Kumar R., Ashfaq H.H., Singh R., Kumar R. (2025) A heuristic approach for insertion of multiple-complex coefficient-filter based DSTATCOM to enhancement of power quality in distribution system, Multimed Tools Appl. 84, 17741–17767. [Google Scholar]
- Pushkarna M., Ashfaq H., Singh R., Kumar R. (2024) An optimal placement and sizing of type-IV DG with reactive power support using UPQC in an unbalanced distribution system using particle swarm optimization, Energy Syst. 15, 353–370. [Google Scholar]
- Kumar R., Singh R., Ashfaq H. (2020) Stability enhancement of induction generator-based series compensated wind power plants by alleviating subsynchronous torsional oscillations using BFOA-optimal controller tuned STATCOM, Wind Energy 23, 1846–1867. [Google Scholar]
- Badran O., Mekhilef S., Mokhlis H., Dahalan W. (2017) Optimal reconfiguration of distribution system connected with distributed generations: A review of different methodologies, Renew. Sustain. Energy Rev. 73, 854–867. [CrossRef] [Google Scholar]
- Ajmal A.M., Ramachandaramurthy V.K., Naderipour A., Ekanayake J.B. (2021) Comparative analysis of two-step GA-based PV array reconfiguration technique and other reconfiguration techniques, Energy Convers. Manage. 230, 113806. [Google Scholar]
- Kumar R., Diwania S., Khetrapal P., Singh S. (2022) Performance assessment of the two metaheuristic techniques and their hybrid for power system stability enhancement with PV-STATCOM, Neural Comput. Appl. 34, 3723–3744. [Google Scholar]
- Jamian J.J., Dahalan W.M., Mokhlis H., Mustafa M.W., Lim Z.J., Abdullah M.N. (2014) Power losses reduction via simultaneous optimal distributed generation output and reconfiguration using ABC optimization, J. Electr. Eng. Technol. 9, 4, 1229–1239. [Google Scholar]
- Imran A.M., Kowsalya M., Kothari D.P. (2014) A novel integration technique for optimal network reconfiguration and distributed generation placement in power distribution networks, Int. J. Electr. Power Energy Syst. 63, 461–472. [Google Scholar]
- El-Zonkoly A. (2014) Optimal placement and schedule of multiple grid connected hybrid energy systems, Int. J. Electr. Power Energy Syst. 61, 239–247. [Google Scholar]
- El-Fergany A. (2015) Optimal allocation of multi-type distributed generators using backtracking search optimization algorithm, Int. J. Electr. Power Energy Syst. 64, 1197–1205. [Google Scholar]
- Liu K.Y., Sheng W., Liu Y., Meng X., Liu Y. (2015) Optimal sitting and sizing of DGs in distribution system considering time sequence characteristics of loads and DGs, Int. J. Electr. Power Energy Syst. 69, 430–440. [Google Scholar]
- Kayal P., Chanda C.K. (2013) Placement of wind and solar based DGs in distribution system for power loss minimization and voltage stability improvement, Int. J. Electr. Power Energy Syst. 53, 795–809. [Google Scholar]
- Ugranlı F., Karatepe E. (2013) Optimal wind turbine sizing to minimize energy loss, Int. J. Electr. Power Energy Syst. 53, 656–663. [Google Scholar]
- Ali E.S., Abd Elazim S.M., Abdelaziz A.Y. (2017) Ant lion optimization algorithm for optimal location and sizing of renewable distributed generations, Renew. Energy 101, 1311–1324. [Google Scholar]
- Safaei A., Vahidi B., Askarian-Abyaneh H., Azad-Farsani E., Ahadi S.M. (2016) A two-step optimization algorithm for wind turbine generator placement considering maximum allowable capacity, Renew. Energy 92, 75–82. [Google Scholar]
- Kumar R., Diwania S., Singh R., Ashfaq H., Khetrapal P., Singh S. (2022) An intelligent hybrid Wind-PV farm as a static compensator for overall stability and control of multimachine power system, ISA Trans. 123, 286–302. https://doi.org/10.1016/j.isatra.2021.05.014. [Google Scholar]
- Mokryani G., Siano P. (2014) Optimal siting and sizing of wind turbines based on genetic algorithm and optimal power flow, in: Hossain J., Mahmud A. (eds.) Renewable energy integration: Challenges and solutions, Springer, Singapore, pp. 125–144. [Google Scholar]
- Kumar R., Singh R., Ashfaq H., Singh S.K., Badoni M. (2021) Power system stability enhancement by damping and control of Sub-synchronous torsional oscillations using whale optimization algorithm-based type-2 wind turbines, ISA Trans. 108, 240–256. https://doi.org/10.1016/j.isatra.2020.08.037. [Google Scholar]
- Hemeida A.M., Bakry O., Alkhalaf S., Mikhaylov A., Zobaa A.F., Senjyu T., Mikhailef S., Dardeer M. (2023) Impact of loading capability on optimal location of renewable energy systems distribution networks, Ain Shams Eng J 15, 1, 102340. [Google Scholar]
- Shawon S.M.R.H., Liang X., Janbakhsh M. (2023) Optimal placement of distributed generation units for microgrid planning in distribution networks, IEEE Trans. Ind. Appl. 59, 3, 2785–2895. [Google Scholar]
- Alajmi B.N., AlHajri M.F., Ahmed N.A., Abdelsalam I., Marei M.I. (2023) Multi‐objective optimization of optimal placement and sizing of distributed generators in distribution networks, IEEJ Trans. Electr. Electron. Eng. 18, 6, 817–833. [Google Scholar]
- Ramadan A., Ebeed M., Kamel S., Ahmed E.M., Tostado-Véliz M. (2023) Optimal allocation of renewable DGs using artificial hummingbird algorithm under uncertainty conditions, Ain Shams Eng. J. 14, 2, 101872. [Google Scholar]
- Gao F., Yuan C., Li Z., Zhuang S. (2023) Multi-objective optimal allocation of distributed generation considering the spatiotemporal correlation of wind-photovoltaic-load, Electr. Power Syst. Res. 214, 108914. [Google Scholar]
- Taha H.A., Alham M.H., Youssef H.K. (2022) Multi-objective optimization for optimal allocation and coordination of wind and solar DGs, BESSs and capacitors in presence of demand response, IEEE Access 10, 16225–16241. [CrossRef] [Google Scholar]
- Oladeji I., Zamora R., Lie T.T. (2022) Security constrained optimal placement of renewable energy sources distributed generation for modern grid operations, Sustain. Energy, Grids Netw. 32, 100897. [Google Scholar]
- Das S., Fosso O.B., Marafioti G. (2023) Probabilistic planning of distribution networks with optimal DG placement under uncertainties, IEEE Trans. Ind. Appl. 59, 3, 2731–2741. [Google Scholar]
- Khezri R., Mahmoudi A., Haque M.H. (2022) Impact of optimal sizing of wind turbine and battery energy storage for a grid-connected household with/without an electric vehicle, IEEE Trans. Ind. Inform. 18, 9, 5838–5848. [Google Scholar]
- Kianmehr E., Nikkhah S., Vahidinasab V., Giaouris D., Taylor P.C. (2019) A resilience-based architecture for joint distributed energy resources allocation and hourly network reconfiguration, IEEE Trans. Ind. Inform. 15, 10, 5444–5455. [Google Scholar]
- Gupta N. (2020) Probabilistic optimal reactive power planning with onshore and offshore wind generation, EV, and PV uncertainties, IEEE Trans. Ind. Appl. 56, 4, 4200–4213. [Google Scholar]
- Parizy E.S., Choi S., Bahrami H.R. (2019) Grid-specific co-optimization of incentive for generation planning in power systems with renewable energy sources, IEEE Trans. Sustain. Energy 11, 2, 947–957. [Google Scholar]
- Singh B., Bhuvaneswari G. (2019) Sensorless SynRG based variable speed wind generator and single-stage solar PV array integrated grid system with maximum power extraction capability, IEEE Trans. Ind. Electron. 67, 9, 7529–7539. [Google Scholar]
- Xiong L., Yang S., Huang S., He D., Li P., Khan M.W., Wang J. (2021) Optimal allocation of energy storage system in DFIG wind farms for frequency support considering wake effect, IEEE Trans. Power Syst 37, 3, 2097–2112. [Google Scholar]
- Fu C., Lin J., Song Y., Li J., Song J. (2019) Optimal operation of an integrated energy system incorporated with HCNG distribution networks, IEEE Trans. Sustain. Energy 11, 4, 2141–2151. [Google Scholar]
- Kumar P., Swarnkar N.K., Ali A., Mahela O.P., Khan B., Anand D., Brito Ballester J. (2023) Transmission network loss reduction and voltage profile improvement using network restructuring and optimal DG placement, Sustainability 15, 2, 976. [Google Scholar]
- Ali E.S., Abd Elazim S.M., Hakmi S.H., Mosaad M.I. (2023) Optimal allocation and size of renewable energy sources as distributed generations using shark optimization algorithm in radial distribution systems, Energies 16, 10, 3983. [Google Scholar]
- Hassanzadeh M.E., Nayeripour M., Hasanvand S., Sepehrzad R. (2023) Hierarchical optimal allocation of BESS using APT-FPSO based on stochastic programming model considering voltage sensitivity and eigenvalues analyses, Int. J. Electr. Power Energy Syst. 153, 109291. [Google Scholar]
- Oraibi W.A., Mohammadi-Ivatloo B., Hosseini S.H., Abapour M. (2023) A resilience-oriented optimal planning of energy storage systems in high renewable energy penetrated systems, J. Energy Storage 67, 107500. [CrossRef] [Google Scholar]
- Megaptche C.A.M., Musau P.M., Tjahè A.V., Kim H., Waita S., Aduda B.O. (2023) Demand response-fuzzy inference system controller in the multi-objective optimization design of a photovoltaic/wind turbine/battery/supercapacitor and diesel system: Case of healthcare facility, Energy Convers. Manage. 291, 117245. [Google Scholar]
- Alzaidi K.M.S., Bayat O., Uçan O.N. (2019) Multiple DGs for reducing total power losses in radial distribution systems using hybrid WOA-SSA algorithm, Int. J. Photoenergy 2019, 2426538. [Google Scholar]
- Zilong W., Peng S. (2023) A multi-strategy dung beetle optimization algorithm for optimizing constrained engineering problems, IEEE Access. 11, 98805–98817. [Google Scholar]
- Ashok B., Michael Prawin Angel (2024) A non-isolated high step-up converter with TID controller for solar photovoltaic integrated with EV, Analog Integr. Circuits Signal Process. 118, 505–521. [Google Scholar]
- Anwar A., Pota H.R. (2011) Loss reduction of power distribution network using optimum size and location of distributed generation, in: AUPEC 2011, IEEE, Brisbane, QLD, Australia, pp. 1–6. [Google Scholar]
- Coelho F.C.R., da Silva Junior I.C., Dias B.H., Peres W., Ferreira V.H., Marcato A.L.M. (2021) Optimal distributed generation allocation in unbalanced radial distribution networks via empirical discrete metaheuristic and steepest descent method, Electr. Eng. 103, 1633–646. [Google Scholar]
All Tables
All Figures
|
Figure 1 Proposed overall procedure for optimal planning of WT. |
| In the text | |
|
Figure 2 One-line diagram. |
| In the text | |
|
Figure 3 Flowchart of the proposed EDBO technique. |
| In the text | |
|
Figure 4 Single line representation of IEEE 13 bus system. |
| In the text | |
|
Figure 5 Voltage variation for three phases in IEEE 13 bus system. |
| In the text | |
|
Figure 6 Voltage profile for actual and with WT for phase “a” in IEEE 13 bus system. |
| In the text | |
|
Figure 7 Voltage profile for actual and with WT for phase “b” in IEEE 13 bus system. |
| In the text | |
|
Figure 8 Voltage profile for actual and with WT for phase “c” in IEEE 13 bus system. |
| In the text | |
|
Figure 9 Overall voltage profile for actual and with WT in IEEE 13 bus system. |
| In the text | |
|
Figure 10 Analysis of power loss with a number of iterations. |
| In the text | |
|
Figure 11 Performance analysis of objective function in IEEE 13 bus system. |
| In the text | |
|
Figure 12 Single line representation for the IEEE 34 bus system. |
| In the text | |
|
Figure 13 Voltage profile for three phases in the considered test system. |
| In the text | |
|
Figure 14 Voltage profile for actual and with WT for phase “a” in IEEE 34 bus system. |
| In the text | |
|
Figure 15 Voltage profile for actual and with WT for phase “b” in IEEE 34 bus system. |
| In the text | |
|
Figure 16 Voltage profile for actual and with WT for phase “c” in IEEE 34 bus system. |
| In the text | |
|
Figure 17 Overall voltage profile for actual and with WT in IEEE 34 bus system. |
| In the text | |
|
Figure 18 Analysis of power loss vs. number of iterations in the considered test system. |
| In the text | |
|
Figure 19 Objective function analysis in the considered test system. |
| In the text | |
|
Figure 20 Performance analysis of VSI for IEEE 13 and 34 bus systems. |
| In the text | |
Current usage metrics show cumulative count of Article Views (full-text article views including HTML views, PDF and ePub downloads, according to the available data) and Abstracts Views on Vision4Press platform.
Data correspond to usage on the plateform after 2015. The current usage metrics is available 48-96 hours after online publication and is updated daily on week days.
Initial download of the metrics may take a while.