Figure 9

Download original image
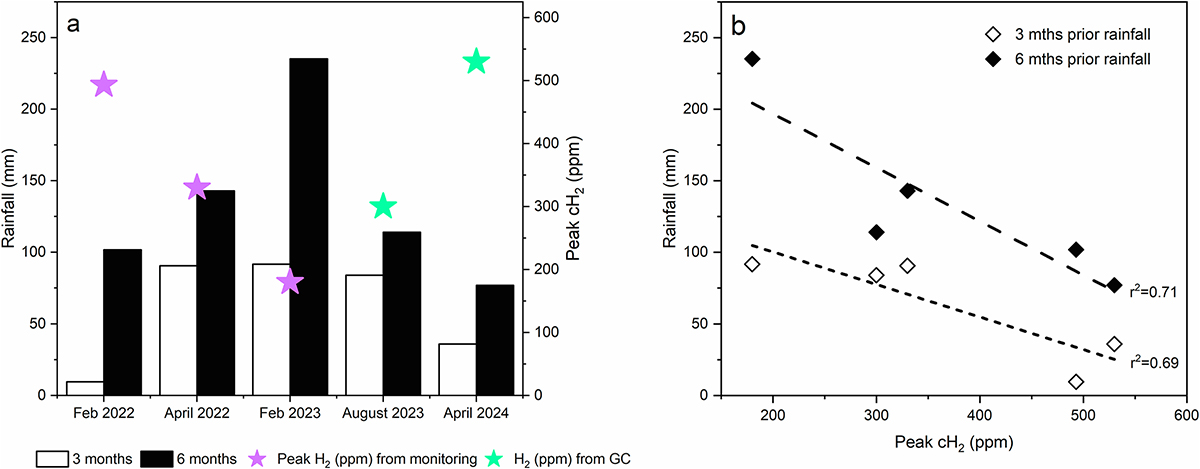
(a) Rainfall preceding the monitoring periods at FF4, compared to the highest cH2 from the WHALI autonomous monitoring unit during the monitoring periods Feb 2022, April 2022 and February 2023, and cH2 measured via gas chromatography from gas samples taken at the FF4 site. (b) Rainfall preceding the monitoring periods at FF4, compared to the highest cH2 from the WHALI autonomous monitoring unit and measured from gas samples. Pearsons coefficient is higher for the cH2 vs previous 6 months rainfall compared to cH2 vs previous 3 months rainfall.
Current usage metrics show cumulative count of Article Views (full-text article views including HTML views, PDF and ePub downloads, according to the available data) and Abstracts Views on Vision4Press platform.
Data correspond to usage on the plateform after 2015. The current usage metrics is available 48-96 hours after online publication and is updated daily on week days.
Initial download of the metrics may take a while.


