")
")
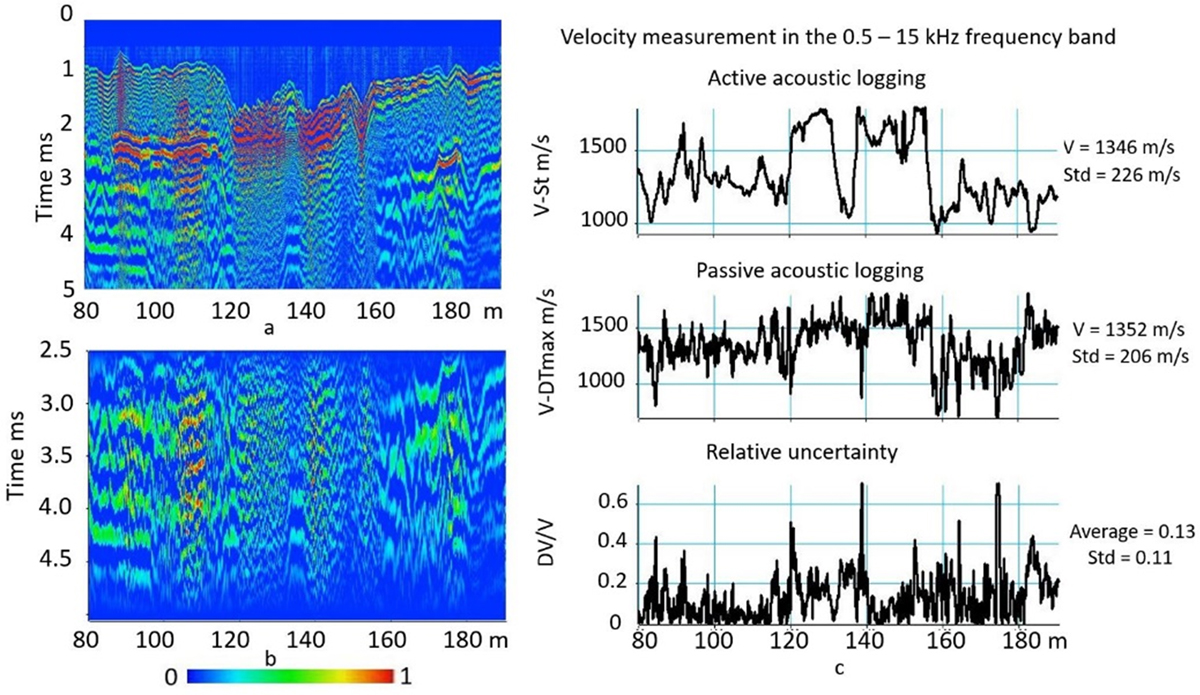
Fig. 7
Download original image
Active vs Passive acoustic logging. a:3 m constant offset acoustic section, b: constant offset section filtered in the 0.5–7.5 kHz interval, displayed in the 2.5–5 ms interval showing Stoneley waves, c: active acoustic logging: velocity log of the Stoneley wave (V-St), passive acoustic logging: velocity of the LFA wave (V-DTmax), Relative uncertainty DV/V between the 2 velocity logs. The acoustic sections are normalized and displayed with a color scale ranging from 0 (blue) to 1 (red).
Current usage metrics show cumulative count of Article Views (full-text article views including HTML views, PDF and ePub downloads, according to the available data) and Abstracts Views on Vision4Press platform.
Data correspond to usage on the plateform after 2015. The current usage metrics is available 48-96 hours after online publication and is updated daily on week days.
Initial download of the metrics may take a while.