")
")
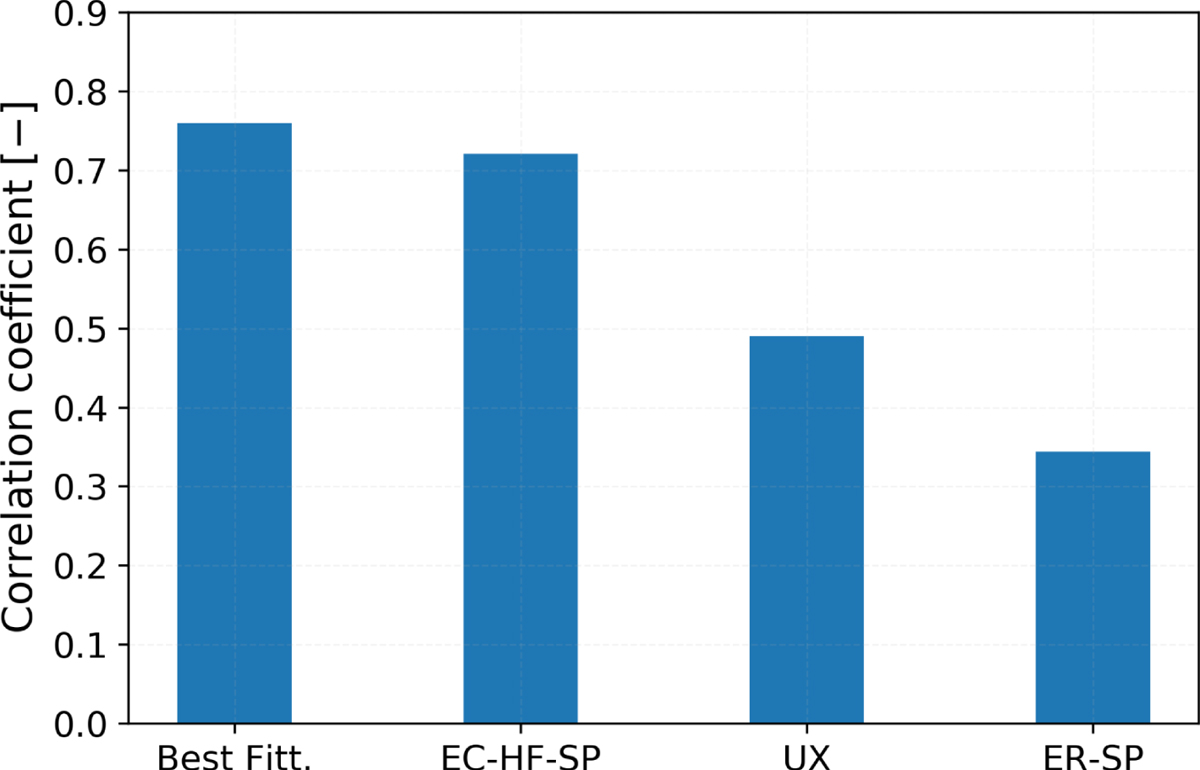
Fig. 9
Download original image
Correlation coefficients computed with the linear regression model proposed in [6]. The first bar represents the performance of the best fitting reduced model to reproduce the response variable (flame surface at −5 CAD). The correlation coefficient between flame surface and the best fitting model is equal to 0.76. The other bars show the correlation coefficients between flame surface and each variable independently from the other variables: 0.72 for EC-HF-SP, 0.49 for UX and 0.34 for ER-SP.
Current usage metrics show cumulative count of Article Views (full-text article views including HTML views, PDF and ePub downloads, according to the available data) and Abstracts Views on Vision4Press platform.
Data correspond to usage on the plateform after 2015. The current usage metrics is available 48-96 hours after online publication and is updated daily on week days.
Initial download of the metrics may take a while.