")
")
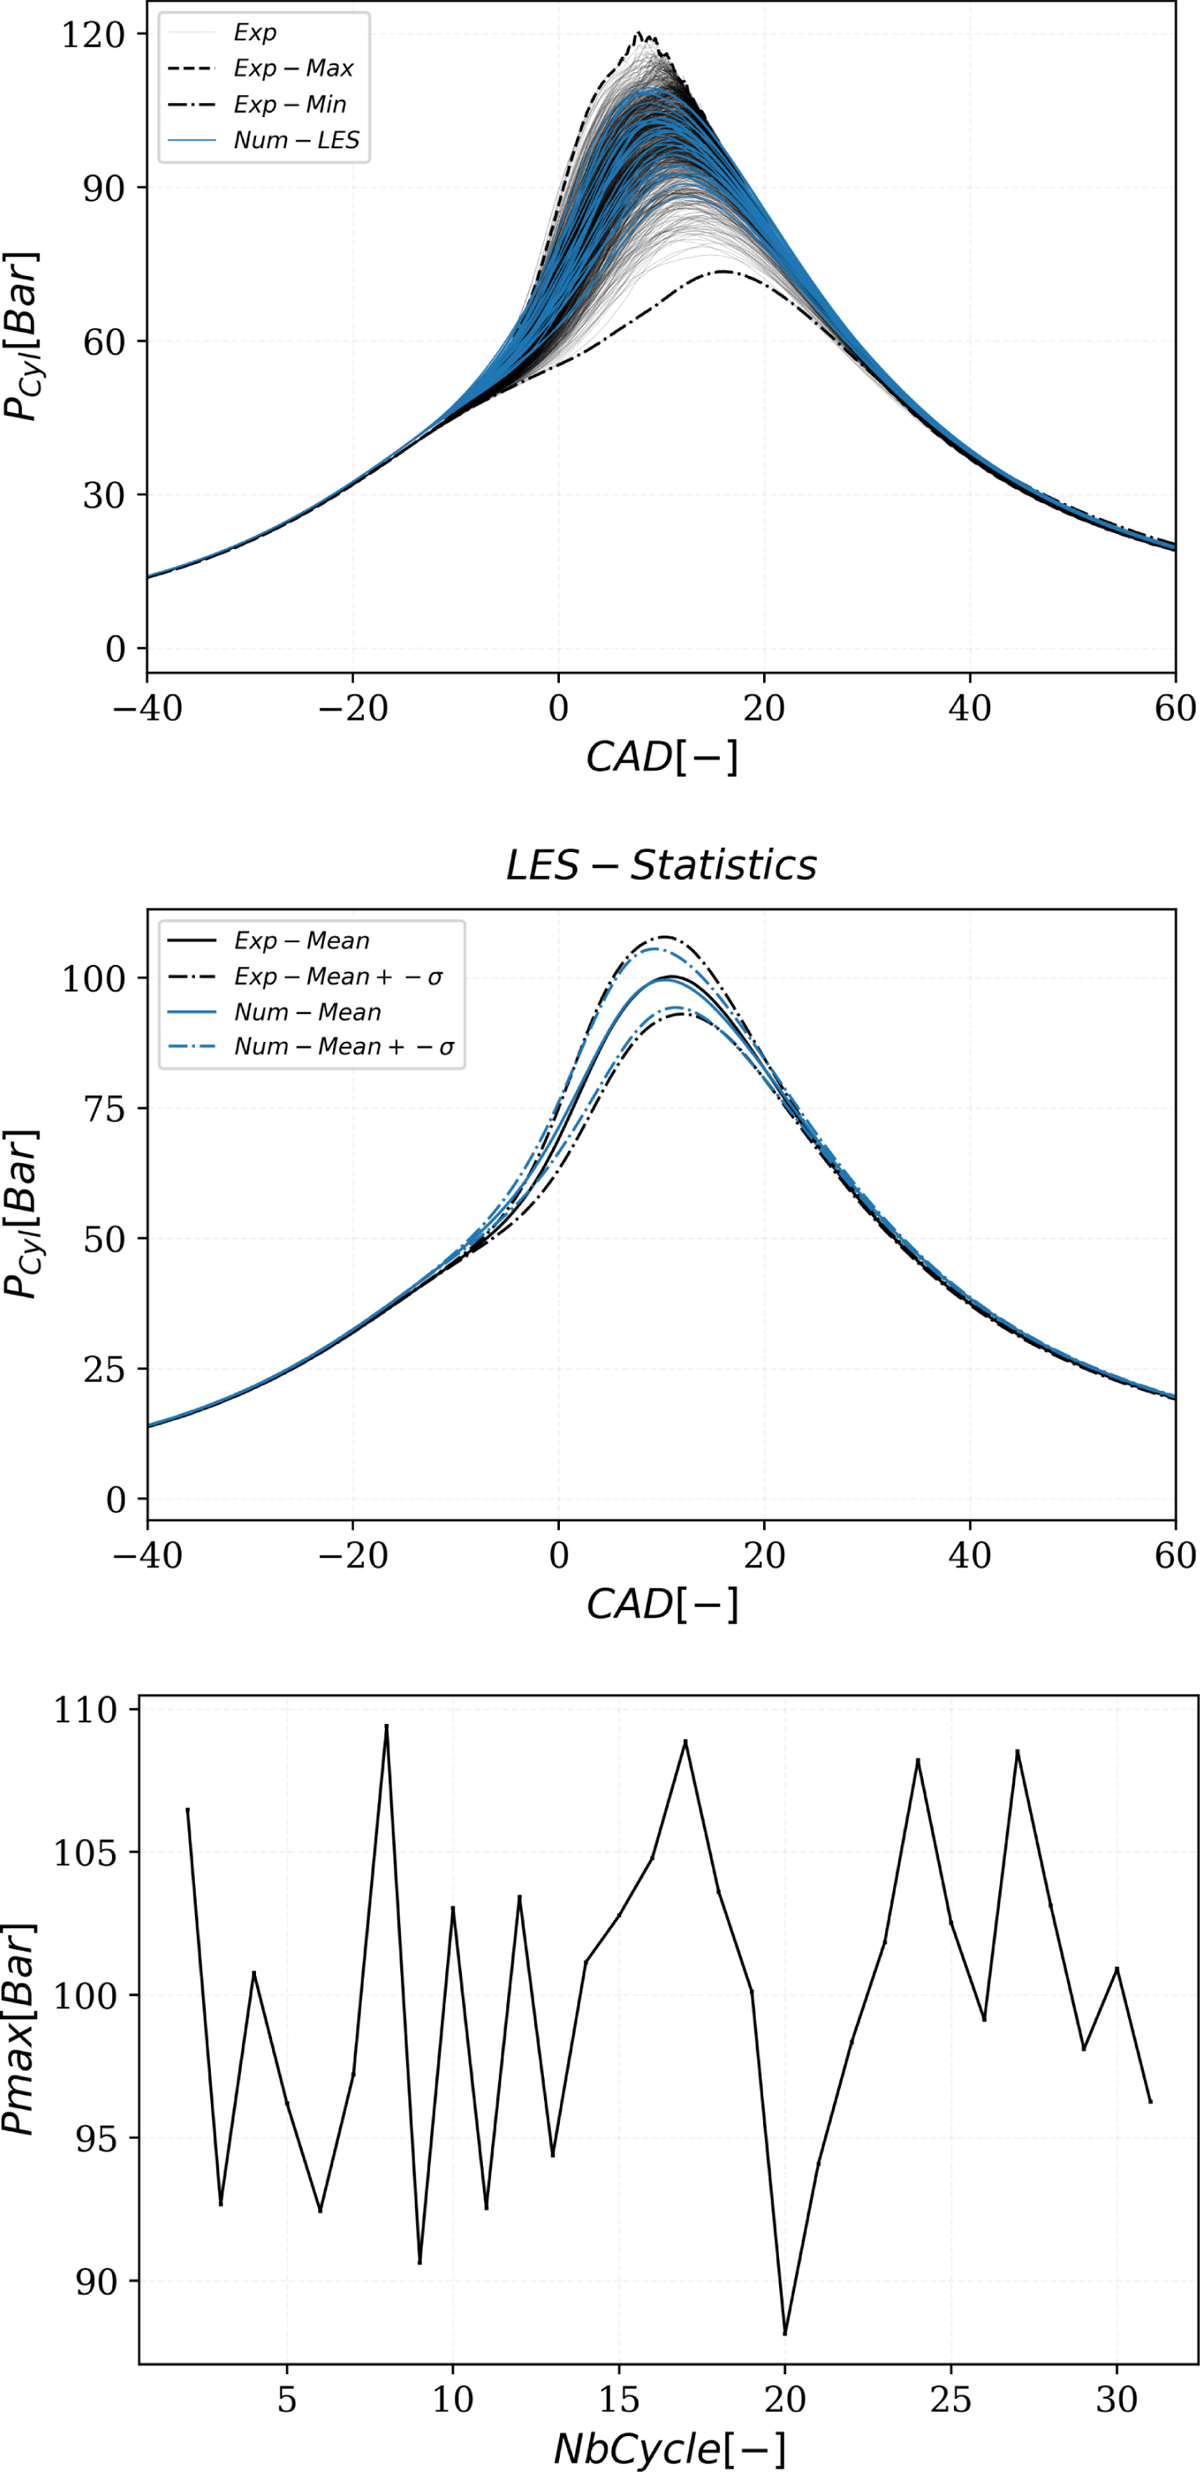
Fig. 5
Download original image
Upper figure: LES multi-cycle in-cylinder pressure traces compared to the experimental ones: the max and min of the experimental envelope are also highlighted. Middle figure: Mean and Mean ± σ of the pressure traces for LES and experiment; numerical pressure statistics are computed over 30 LES cycles while the experimental ones over 1000 cycles. Lower figure: maximum cylinder pressure for the 30 consecutive LES cycles.
Current usage metrics show cumulative count of Article Views (full-text article views including HTML views, PDF and ePub downloads, according to the available data) and Abstracts Views on Vision4Press platform.
Data correspond to usage on the plateform after 2015. The current usage metrics is available 48-96 hours after online publication and is updated daily on week days.
Initial download of the metrics may take a while.