")
")
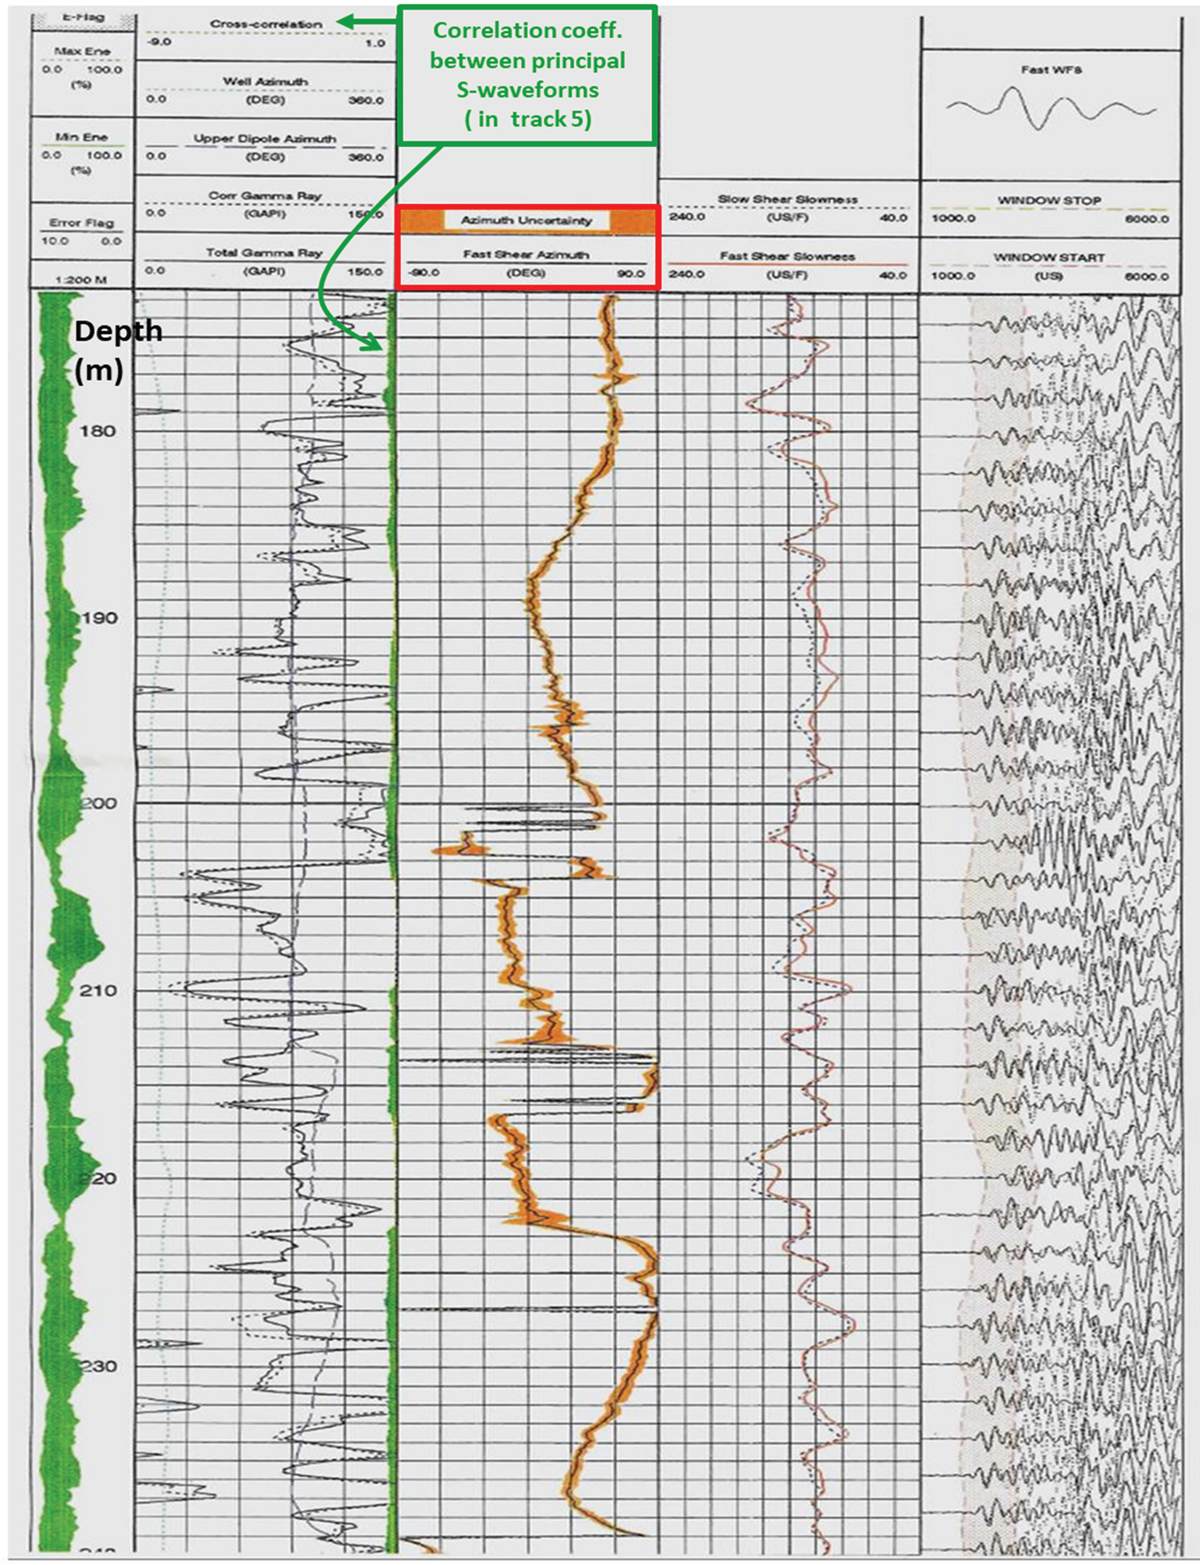
Fig. 17a
Download original image
GPF-Ardèche, MM1 borehole: Alford-type Process anisotropy results, 173–240 m. Track 1: Detection Quality: min and max Cross-ENERGY, green shade between the two curves. Track 2: Well azimuth and upper dipole EX azimuth (smooth dashed curve, 0–360°), GR (solid and dashed-curves), Correlation coefficient between principal waveforms (dashed green). Track 3: FSA/Fast S-wave azimuth, −180° to 180°: (solid black), surrounded with uncertainty orange ribbon, ±10°. Track 4: DTS slowness 40–240 μs/ft, DTSmin (red) and DTSmax (Black dashed) outputs. Track 5: Fast-S Waveform (solid wiggle) on receiver 8, Slow-S Waveform (dashed wiggle signal) on receiver 7, and shadowed computation window.
Current usage metrics show cumulative count of Article Views (full-text article views including HTML views, PDF and ePub downloads, according to the available data) and Abstracts Views on Vision4Press platform.
Data correspond to usage on the plateform after 2015. The current usage metrics is available 48-96 hours after online publication and is updated daily on week days.
Initial download of the metrics may take a while.