")
")
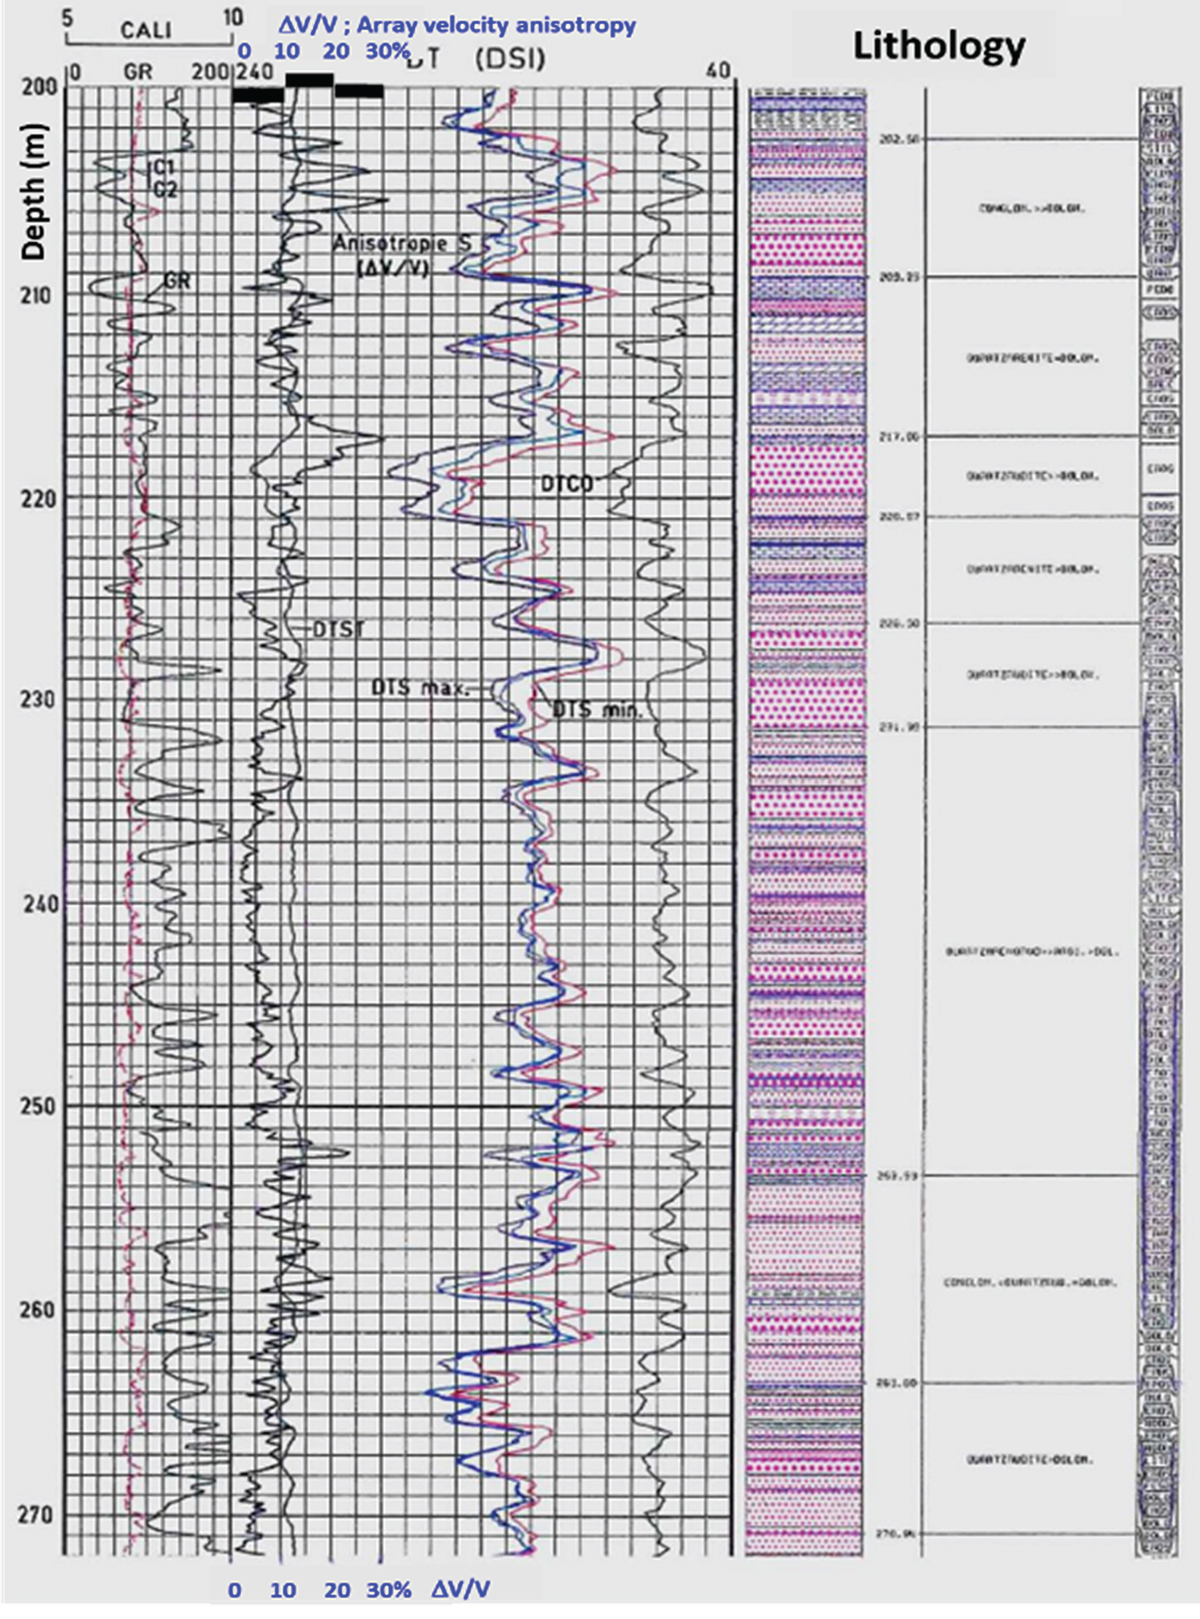
Fig. 10c
Download original image
MM1 borehole, 200–272 m, S-wave velocity anisotropy results from Rotation-scan. Track 1: max/min C1/C2 diameters from 4 arm Caliper, in red, and Gamma Ray/GR. Track 2: slownesses 40–240 μs/m: DTCO, DTSmin (red) and DTSmax (Black) from Rotation-Scan, DTS from monopole transmitter (blue), DTST/Stoneley (black, smooth curve), superimposed with the velocity anisotropy ΔV/V curve (black, high frequency). Tracks 3–5: Lithological columns.
Current usage metrics show cumulative count of Article Views (full-text article views including HTML views, PDF and ePub downloads, according to the available data) and Abstracts Views on Vision4Press platform.
Data correspond to usage on the plateform after 2015. The current usage metrics is available 48-96 hours after online publication and is updated daily on week days.
Initial download of the metrics may take a while.