")
")
Open Access
Review
Fig. 6
Download original image
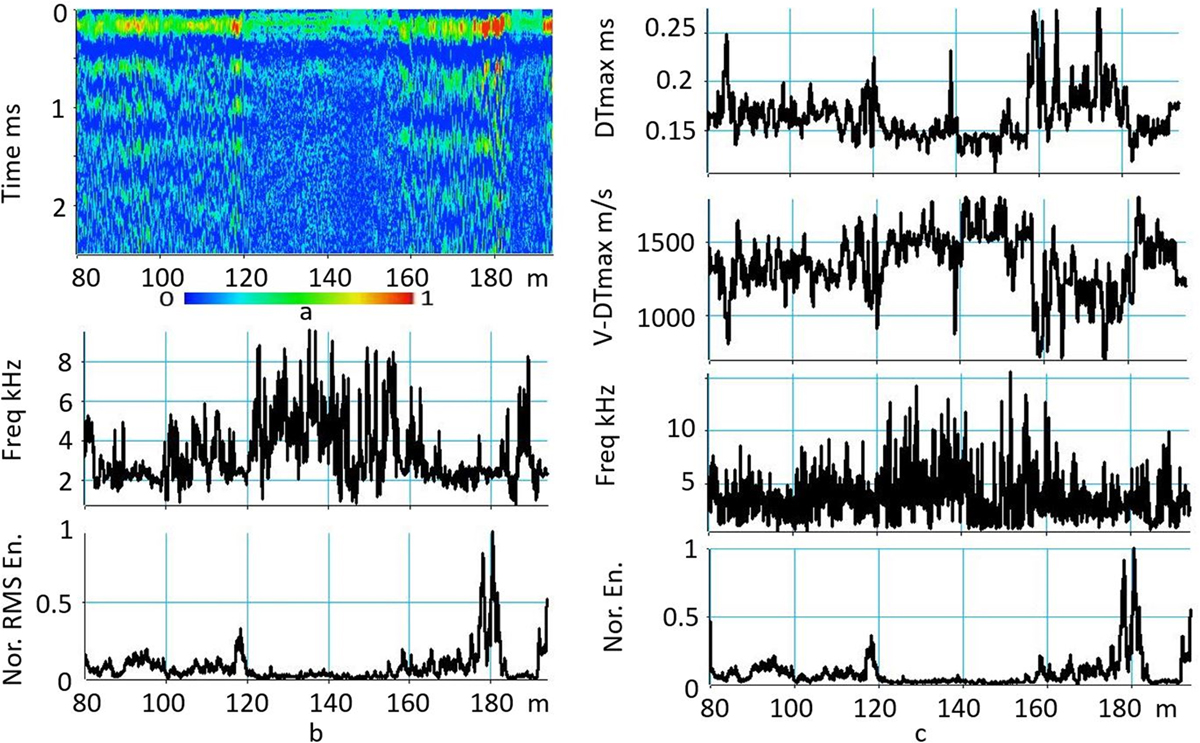
Passive acoustic logging: Identification of a Low Frequency Acoustic (LFA) wave. a: causal part of the interference noise section. The section is normalized and displayed with a color scale ranging from 0 (blue) to 1 (red). b: acoustic logs computed in the 0–0.5 ms interval, c: acoustic logs associated with the LFA wave.
Current usage metrics show cumulative count of Article Views (full-text article views including HTML views, PDF and ePub downloads, according to the available data) and Abstracts Views on Vision4Press platform.
Data correspond to usage on the plateform after 2015. The current usage metrics is available 48-96 hours after online publication and is updated daily on week days.
Initial download of the metrics may take a while.