")
")
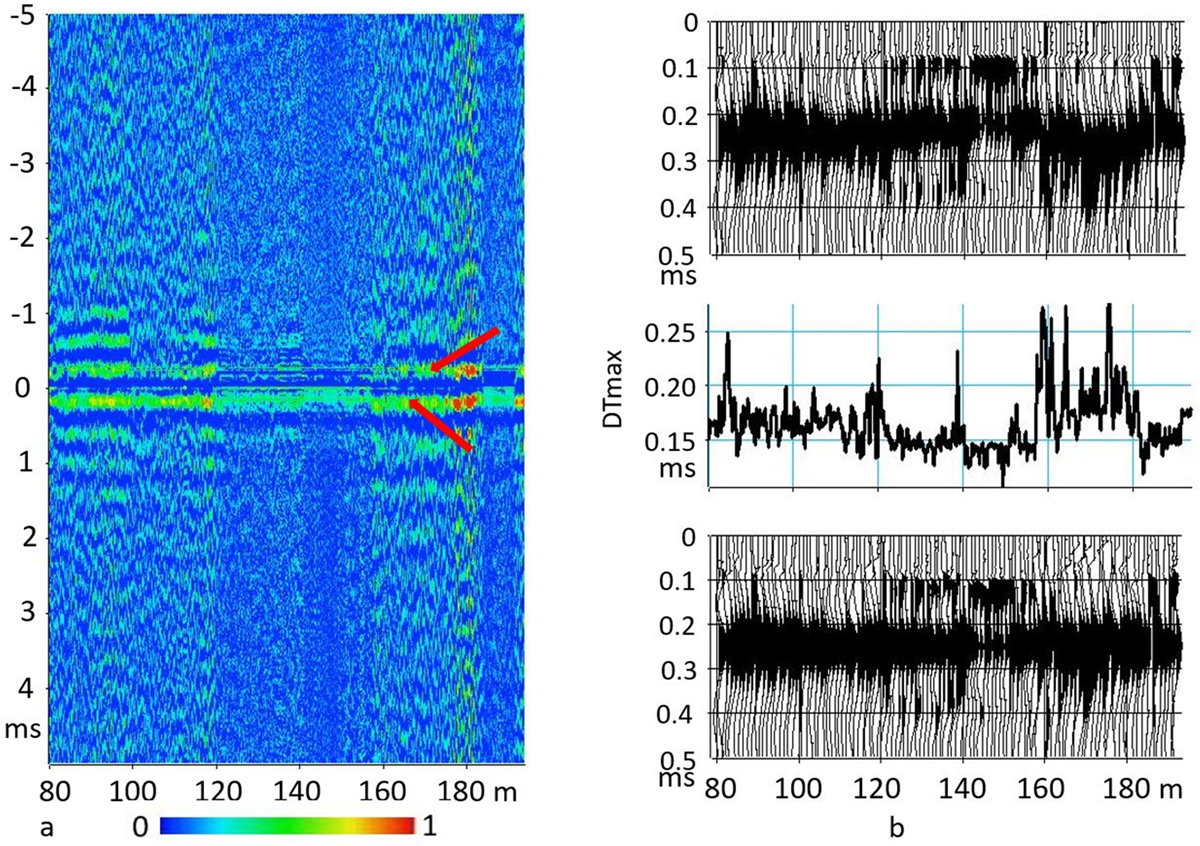
Fig. 5
Download original image
Passive acoustic logging processed by interferometry. a: interference noise section. The section is normalized and displayed with a color scale ranging from 0 (blue) to 1 (red). Arrows indicate the presence of acoustic waves. b: from top to bottom: zoom of the cross-correlation noise section in 0–0.5 ms time interval, picked times DTmax of the maximum of the cross-correlation noise section, flattening of the cross-correlation noise section with DTmax.
Current usage metrics show cumulative count of Article Views (full-text article views including HTML views, PDF and ePub downloads, according to the available data) and Abstracts Views on Vision4Press platform.
Data correspond to usage on the plateform after 2015. The current usage metrics is available 48-96 hours after online publication and is updated daily on week days.
Initial download of the metrics may take a while.