")
")
Open Access
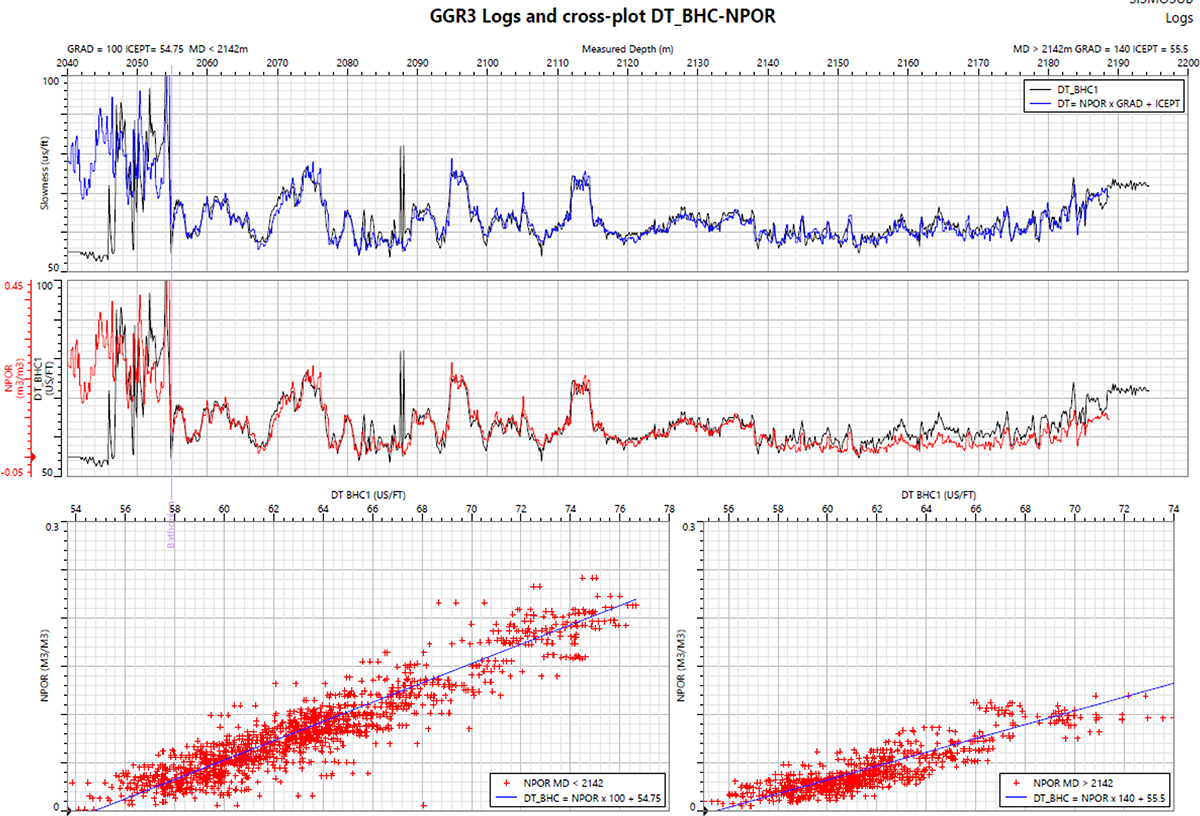
Figure A1.1
Download original image
GGR3 Logs within the reservoir and cross-plot (DT_BHC, NPOR). The equations used for regression appear in the cross-plot boxes. Figure reproduced from reproduced from Figure 3.1 in GGR3 TWT-Synthetic of Humphries [6].
Current usage metrics show cumulative count of Article Views (full-text article views including HTML views, PDF and ePub downloads, according to the available data) and Abstracts Views on Vision4Press platform.
Data correspond to usage on the plateform after 2015. The current usage metrics is available 48-96 hours after online publication and is updated daily on week days.
Initial download of the metrics may take a while.