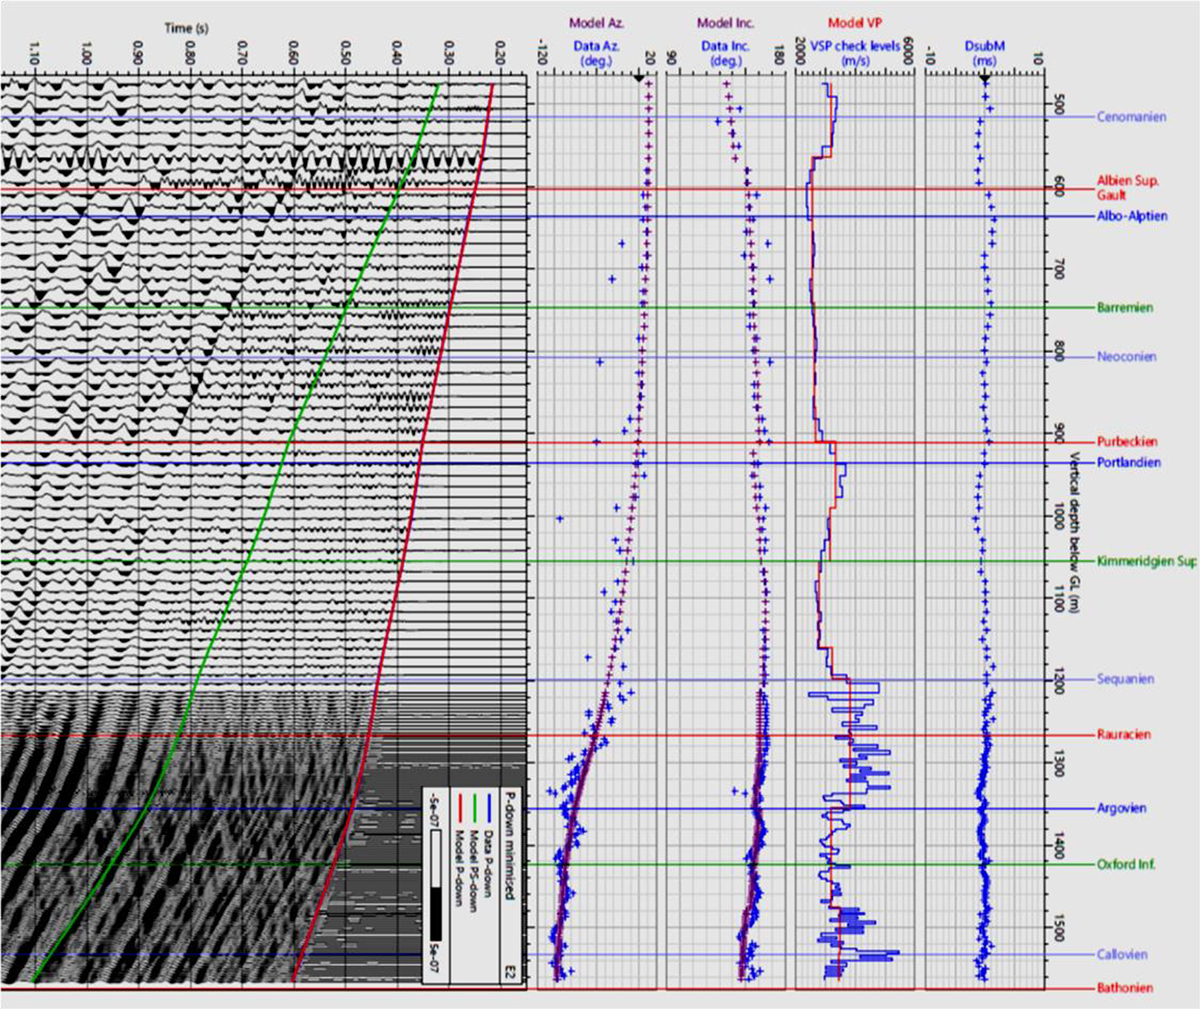
Figure 19

Download original image
Right to left: the first track DsubM is the difference in ms between the picked data P-wave arrival and the ray-trace modeled arrival; the drift is within ±1 ms. The 2nd track shows the layered velocity profile Vp in red and VSP interval velocity in blue. The 3rd track shows the model P-down inclination angle in purple, and data measured inclination in blue. The 4th track shows the model P-down azimuth angle in purple, and data measured azimuth in blue. The trace data on the leftmost track is the minimized P-down component which holds the majority of the P-S down signal. Figure reproduced from Figure 3.5.3 of Bailey [8].
Current usage metrics show cumulative count of Article Views (full-text article views including HTML views, PDF and ePub downloads, according to the available data) and Abstracts Views on Vision4Press platform.
Data correspond to usage on the plateform after 2015. The current usage metrics is available 48-96 hours after online publication and is updated daily on week days.
Initial download of the metrics may take a while.


