")
")
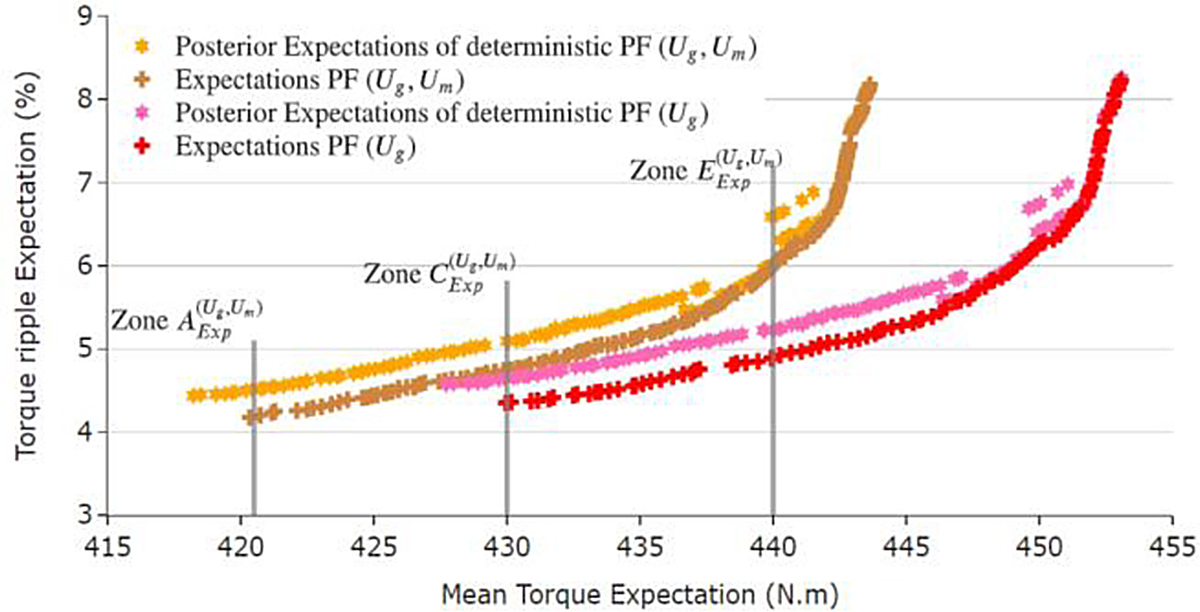
Fig. 13
Download original image
Pareto fronts obtained by expectations optimization (brown) and expectations obtained by posterior perturbations from deterministic optimization results (orange) where uncertainties come from geometrical and materials’ properties perturbations (Ug, Um). Red and pink sets of points come from Figure 9. Dark gray zones highlight points with similar mean torque expectation values.
Current usage metrics show cumulative count of Article Views (full-text article views including HTML views, PDF and ePub downloads, according to the available data) and Abstracts Views on Vision4Press platform.
Data correspond to usage on the plateform after 2015. The current usage metrics is available 48-96 hours after online publication and is updated daily on week days.
Initial download of the metrics may take a while.